Market Month in Review – April 2025

At a Glance
Macro Indicators: Headline and core PCE inflation rose by 2.3% and 2.6%, respectively, in March, signaling a continued albeit slow downtrend in inflation, but this reading was overshadowed by the advance estimate of 1Q 2025 GDP, which came in at -0.3% as imports surged ahead of tariff implementation. This is the first negative quarterly GDP reading since Q1 2022 and has amplified concerns of continued economic weakness due to tariffs. All eyes are on the labor market for signs of weakening, perhaps the most important macro indicator to watch right now.
Trump 2.0: The announcement of “Liberation Day” tariffs wreaked havoc on markets in April, and with a majority of the reciprocal tariffs paused until July 8, markets are waiting with bated breath for news of trade deals to potentially lessen the economic impacts of tariffs.
Fed & Monetary Policy: Fed Chairman Powell endured criticism from President Trump over the month but held firm on his apolitical views. Markets are pricing in four rate cuts this year with the Fed currently projecting only two rate cuts. Once again, the Fed is remaining data dependent when it comes to making monetary policy decisions. The market expects the next interest rate cut at the June FOMC meeting.
Equity Markets: Equity markets witnessed the worst 100 days of a presidency since Nixon in 1974, down over 7% since Trump’s second inauguration and experienced great volatility intra-month. Fixed income markets saw curves steepen and yields rise over the month, particularly in the municipal market, with investment grade tax equivalent yields north of 6% as of month-end. 1Q 2025 earnings season is underway, with relatively positive results thus far, but some companies are pulling forward guidance due to tariff uncertainty.
Asset Class Performance
International assets, encompassing equities and fixed income, continue to perform well on both a year-to-date (YTD) basis and over the past month. After an extremely volatile month, U.S. large cap equities ended relatively flat, with small cap equities posting more modestly negative performance as companies continue to struggle to price in the potential effects of tariffs.
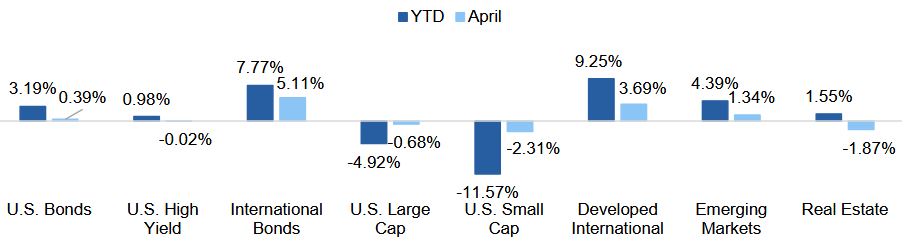
Source: YCharts. Asset class performance is presented using total returns for an index proxy that best represents the respective broad asset class. U.S. Bonds (Bloomberg U.S. Aggregate Bond TR), U.S. High Yield (Bloomberg U.S. Corporate High Yield TR), International Bonds (Bloomberg Global Aggregate ex-USD TR), U.S. Large Cap (S&P 500 TR), U.S. Small Cap (Russell 2000 TR), Developed International (MSCI ACWI ex US TR), Emerging Markets (MSCI EM TR), and Real Estate (Dow Jones U.S. Real Estate TR)
Markets & Macroeconomics
Trump Tariff Turmoil
President Trump has been publicly vocal about tariffs and unfair trading practices since the 1980s, so it should have come as no surprise to markets that he would pursue tariffs as part of his policy agenda. But it wasn’t Trump’s implementation of tariffs on April 2’s “Liberation Day” that surprised markets, it was the severity and magnitude of those tariffs, which were doled out globally and targeted countries with disproportionate trade surpluses, revealed by an esoteric tariff rate calculation. Without getting into the details, countries like Cambodia and Vietnam were given a “reciprocal” tariff of 49% and 46%, respectively, two of the higher rates as a result of their large trade surpluses with the U.S. On the other hand, China received a tariff of 145%, which was driven up from the original rate after a day or so of retaliation, and all imports into the U.S. received a base tariff of 10%. The majority of these tariffs (except for China and the 10% base tariffs) were paused on April 9 for 90-days to allow trade negotiations to take place. These announcements over the course of a few days translated into some substantial market swings that were ultimately being driven by concerns over how tariffs will impact economies, particularly the American economy. Most people understand the broad intent of tariffs: to strengthen U.S. manufacturing capabilities, promote domestic job growth, and, importantly, reduce the U.S. trade deficit. What is more difficult to stomach are the potential costs incurred by Trump’s tariffs, which many believe will ultimately be borne by the U.S. consumer and producer in the form of higher prices, particularly if negotiations fall through and tariffs remain in place.
Exhibit 1: U.S. Capital Market Reaction to Tariffs
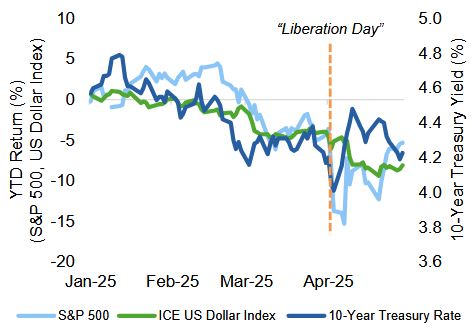
Source: YCharts
These potential costs are why “Liberation Day” induced the largest 2-day sell-off in history, which saw U.S. equity markets lose more than $6 trillion in value between April 3–4 and the S&P 500 hit a drawdown of over 18% from its year-to-date high (February 18). While the equity market reaction garnered most of the attention, we also witnessed a sell-off in U.S. Treasuries, which pushed the 10-Year yield to a high of nearly 4.5%, as well as in the U.S. Dollar, illustrating another consequence of Trump’s tariffs: a global diversification effort away from U.S. assets. This consequence fueled investor fears of massive selling of U.S. assets, particularly Treasuries, but, as usual, the reality is more nuanced. The U.S. remains a powerhouse and the home of the global reserve currency, and this position does not change overnight. What is likelier the case is that foreign countries are realizing they need to diversify outside of the U.S.
In months like what we just experienced, it is important to remember where we started. After witnessing strength for years, ushering in an age of “exceptionalism,” U.S. assets became rich both because of the advantageous investment environment and the large amounts of foreign capital that this environment attracted. Contrary to some current beliefs, today’s tariff turmoil is not proof that this “U.S. exceptionalism” is over, but it is likely an indication that U.S. assets are repricing to a more “normal” level. Just like individual investors, it is important for global countries to be diversified, particularly when uncertainty is present.
After Trump announced the 90-day pause on most tariffs, markets reversed course and soared to end the month relatively flat, illustrating how the worst days in the market are often followed by the best days, emphasizing the importance of staying invested. Trump’s (second) first 100 days were volatile thanks to tariffs, and this trend is expected to continue as trade negotiations play out in the short-term and potentially conflict with other parts of his administration’s agenda and, importantly, monetary policy decisions from the Federal Reserve.
The Bottom Line: The “Liberation Day” tariffs announced on April 2 drove a major market sell-off and heightened concerns about future U.S. economic growth. Negotiations will continue to play out meaning volatility is likely here to stay in the short-term, further emphasizing the need for diversification across asset classes.
Looking Ahead
Investing Amid Uncertainty
Thus far, the word best describing 2025 has been uncertainty: uncertainty related to what impact tariffs will have, what the Fed will do with interest rates and monetary policy, and which companies will win the “AI arms race.” Uncertainties will likely be prevalent in every investment environment, meaning the all-important question is not “will there be uncertainty?” but “how should I invest amid the uncertainty?” As the U.S. economy grapples with the highest tariff rates seen in decades, slowing growth, inflation above the Fed’s target, and an unruly (and unpredictable) government, investment decisions for long-term growth are more important than ever.
Following the intra-day and daily moves of markets can be exhausting and potentially even counterproductive for long-term investors. In these types of scenarios, focusing instead on age-old investment principles like diversification and paying the right price for the value of an asset can help create clarity and a greater sense of control around potential investment outcomes. Making investment decisions that are rational and rooted in valuations and quality also helps remove the emotional decision-making that can occur during volatile times like what we are witnessing today.
Valuations matter and heavy concentrations in portfolios and indices can enhance volatility. Even with the recent repricing, U.S. equity markets remain concentrated and over-valued: the Magnificent 7 stocks still represent 30% of the S&P 500 as of month-end and are driving 85% of the overall index’s share of returns on a year-to-date basis. Exhibit 2 illustrates common valuation metrics across various asset classes, demonstrating how U.S. equities are more over-valued than asset classes like international equities and fixed income. For instance, municipal securities look extremely cheap relative to historical averages, indicating a potentially attractive entry-point into the asset class, which is still boasting a substantial tax equivalent yield advantage over corporate fixed income. For context, 10-year AAA corporate yields are 4.8% versus over 7% on a tax equivalent basis in the municipal market for the highest federal tax bracket.
Exhibit 2: Current Valuations Across Asset Classes
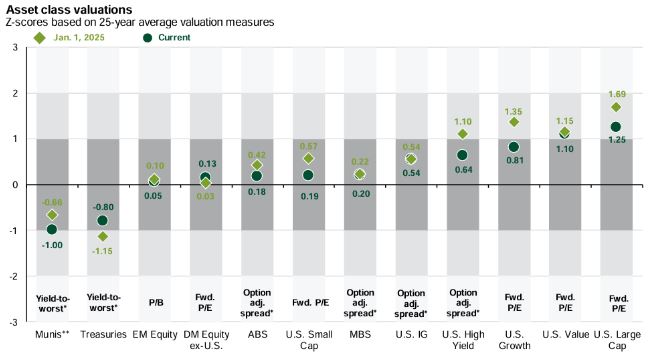
Source: J.P. Morgan Guide to the Markets
It is this type of rational approach to investing that is warranted in the current environment where uncertainty is rampant. Perhaps more than ever, markets are being driven by emotions, which is being further amplified by the persistent, large concentrations and high valuations in certain asset classes, like U.S. large cap equities. Focusing too much on short-term market movements and trying to perfectly time the market is an unsustainable (and impossible) strategy for building long-term wealth. Rather, investors should instead be focused on areas of the market that are undervalued and attractive fundamentally and potentially rebalance away from those parts of the market that have become too rich. The current investment environment is creating unique challenges for investors but that doesn’t mean opportunities aren’t present. When all else fails, focus on valuations and quality to provide greater clarity and direction amid the uncertainty.
The Bottom Line: Amid uncertainty, go back to basics. Time-honored investment principles like diversification and valuation-driven decision-making can help maintain discipline and logic even when volatility and uncertainty rear their ugly heads.
Capital Markets Themes
What Worked, What Didn’t
•International Reigns Supreme: International equity outpaced U.S. equities in April as concerns over economic growth paralyzed U.S. equity markets, finally providing some justification for why having international exposure in one’s portfolio is important.
•Look Under the Hood on Munis: While municipal bonds underperformed taxable counterparts over the month, the market witnessed a steepening in its yield curve which caused longer end yields to rise, reinforcing that while bonds aren’t the best candidate for total returns in the current environment, they are a great source of income, particularly as it relates to municipal bonds.
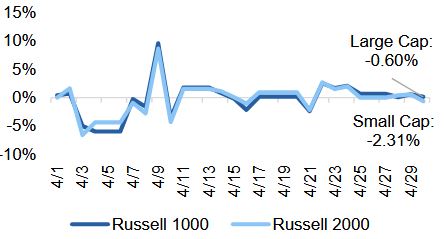
Large vs Small Cap Equity
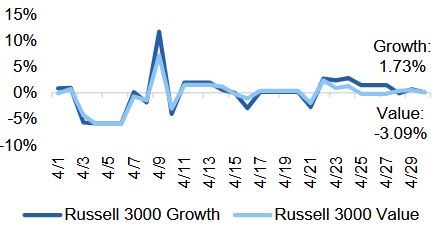
Growth vs Value Equity
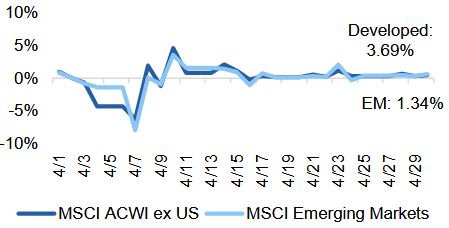
Developed vs Emerging Equity
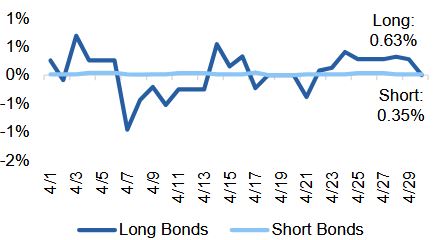
Short vs Long Duration Bonds
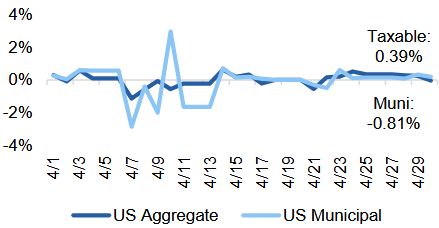
Taxable vs Municipal Bonds
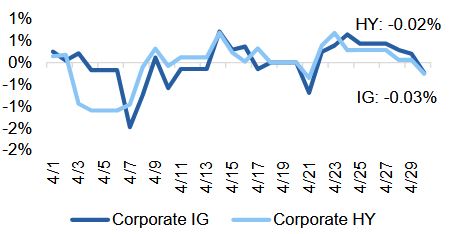
Investment Grade vs High Yield Bonds
Source: YCharts. Data call-out figures represent total monthly returns
On Alternatives
Spotlight on Triple Net Lease Real Estate
Real estate can be an important portfolio diversifier and a predictable source of income, particularly during times of uncertainty. A net lease is a type of commercial lease agreement in which the tenant is not just responsible for paying the rent, but other costs as well. A triple net lease agreement means the tenant pays the rent, as well as the property taxes, insurance costs, and maintenance costs – three additional costs and hence the name triple. Triple net leases provide unique advantages to investors versus other types of real estate, making them a potentially attractive and diversified opportunity amid today’s macroeconomic uncertainty.
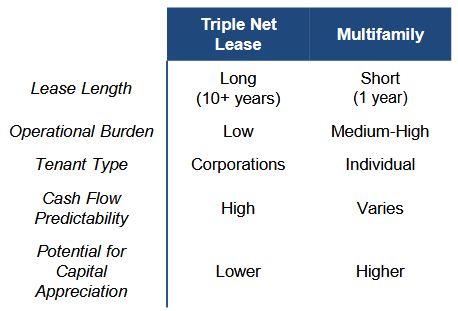
By nature, triple net leases are longer term, typically greater than 10 years, which provides stability for tenants, landlords, and investors alike. Tenants in this type of real estate are usually corporations or businesses, which means they usually prefer a longer-term lease to secure their location. This benefits both the investor and landlord as credit risk is relatively low with this type of high quality, stable tenant. Additionally, due to their longer-term nature, triple net leases typically have rent escalators built into the lease agreement that generally grow with inflation. While this feature does not eliminate inflation risk, it does mitigate the loss of purchasing power and supports cash flow stability even in periods with rising or high inflation. These escalators, in addition to the long-term nature of the leases, translate into less tenant rollover, lower vacancy risk, and greater predictability in income versus other shorter-term or non-escalating leases. Exhibit 4 outlines some key characteristics of triple net lease real estate versus multifamily real estate.
Exhibit 3: Real Estate Sector Comparison
Importantly, triple net lease real estate is often found in real estate investment trust (REIT) structures, which provide important tax benefits to investors, like favorable corporate tax treatment. In addition, landlords and investors can utilize depreciation shields on the property to reduce their taxable income, ultimately increasing the ability for income production. These tax implications for triple net lease real estate make it a compelling and diversified alternative to other income-producing asset classes. As with any type of investment, it is important to know what you own, and certain sectors of an asset class are more attractive or carry more risk than others.
For instance, focusing on triple net leases that are critical to a specific tenant’s operations enhances the stability and long-term occupancy of the property, which ultimately benefits investors. Investing in uncertain times can be difficult, but considering asset classes like triple net lease real estate may mitigate some of the consequences of uncertainty and ultimately provide some of the stability that investors are likely looking for. Exhibit 5 shows that during the 2008 housing crisis, net lease investments held up extremely well compared to other sectors of real estate.
Exhibit 4: Case Study in Net Lease Resilience
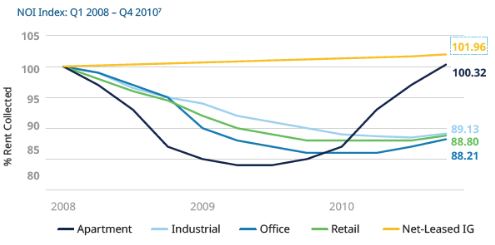
Source: Blue Owl Capital
The Bottom Line: Real estate can provide important benefits during periods of volatility, and triple net lease real estate can provide greater predictability through its stable income streams, strong tenant creditworthiness, and tax efficiency, all of which promote its resilient and inflation-resistant nature.
Asset Class Performance Quilt
Markets are ever-changing, making diversification across asset classes and sectors a critical component to portfolio construction. As illustrated below, a Balanced 60/40 portfolio provides greater consistency of returns and less volatility over time.
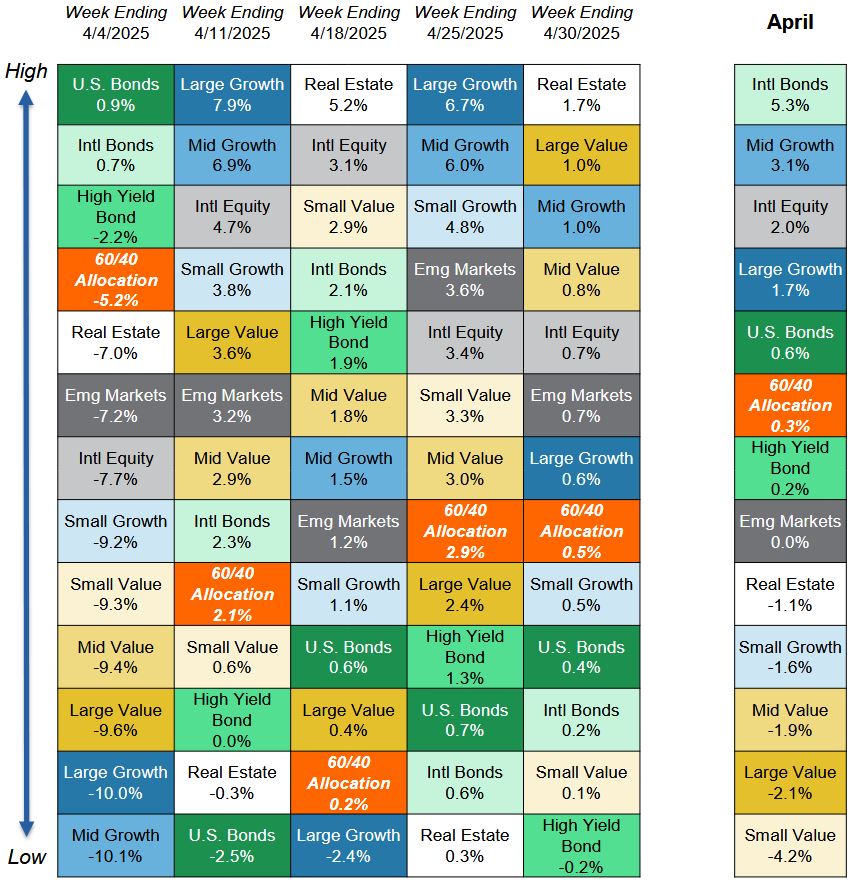
Source: YCharts. Asset class performance is presented using market returns from an exchange-traded fund (ETF) proxy that best represents its respective broad asset class. Returns shown are net of fund fees for and do not necessarily represent performance of specific mutual funds and/or exchange-traded funds recommended by Centura Wealth Advisory. The performance of those funds may be substantially different than the performance of broad asset classes and to proxy ETFs represented here. U.S. Bonds (iShares Core U.S. Aggregate Bond ETF); High Yield Bonds (iShares iBoxx $ High Yield Corp Bond ETF); Intl Bonds (Invesco International Corporate Bond ETF); Large Growth (iShares Russell 1000 Growth ETF); Large Value (iShares Russell 1000 Value ETF); Mid Growth (iShares Russell Mid-Cap Growth ETF); Mid Value (iShares Russell Mid-Cap Value ETF); Small Growth (iShares Russell 2000 Growth ETF); Small Value (iShares Russell 2000 Value ETF); Intl Equity (iShares MSCI ACWI ex US ETF); Emg Markets (iShares MSCI Emerging Markets ETF); and Real Estate (iShares US Real Estate ETF). The return displayed as “60/40 Allocation” is a weighted average of the ETF proxies shown as represented by: 40% U.S. Bonds, 12% International Stock, and 48% Large Blend.
