Market Month in Review – November 2025

At a Glance
Macro Indicators: The October jobs report will not be published in its full form due to the government shutdown, creating a lapse in the crucial data driving current monetary policy decision-making. The unemployment rate is 4.4% and inflation remains elevated above the Fed’s long-term target, with delayed September PCE inflation data to be published in early December. GDP growth for 3Q is projected to be 3.9% as of month-end according to the Atlanta Fed’s GDPNow tool.
Trump 2.0: The record-breaking, 43-day government shutdown ended on November 12 after a short-term funding bill was ultimately passed after 14 previously failed votes, funding the government through January 30, 2026. While the Trump Administration’s tariffs are coming under pressure from the Supreme Court, there are alternate means to keep tariffs in place should the ruling not be in President Trump’s favor.
Fed & Monetary Policy: All eyes are on the December Federal Open Market Committee (FOMC) meeting for a “Dot Plot” update and a potential 25-bps rate cut. Markets are predicting an 86% probability of an interest rate cut in December as of month-end. With clouded data from the government shutdown, the Fed continues to balance their dual mandate, weighing future inflationary concerns against current labor market softness.
Capital Markets: The AI trade came under pressure in November over concerns of lofty tech valuations, creating a rotation into more defensive parts of the market. The bond market continued to see increased debt issuance to fund AI capex spending. Treasury yields broadly fell over the month in anticipation of further Fed easing to end the year.
Asset Class Performance
Returns across asset classes in November were relatively muted, with both U.S. equity and fixed markets outperforming international markets over the month. On a year-to-date basis, international equities remain the clear winners.
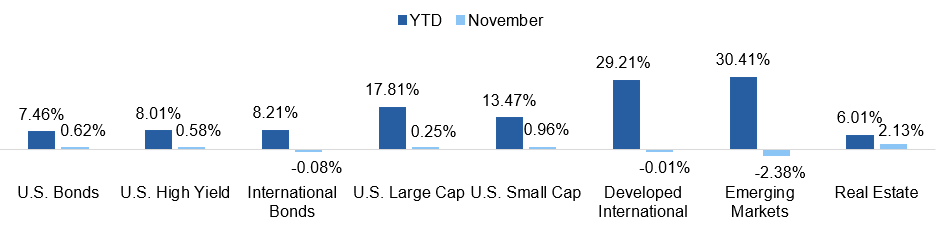
Source: YCharts. Asset class performance is presented using total returns for an index proxy that best represents the respective broad asset class. U.S. Bonds (Bloomberg U.S. Aggregate Bond TR), U.S. High Yield (Bloomberg U.S. Corporate High Yield TR), International Bonds (Bloomberg Global Aggregate ex-USD TR), U.S. Large Cap (S&P 500 TR), U.S. Small Cap (Russell 2000 TR), Developed International (MSCI ACWI ex US TR), Emerging Markets (MSCI EM TR), and Real Estate (Dow Jones U.S. Real Estate TR).
Markets & Macroeconomics
On Bubble Watch?
Artificial intelligence (AI) has been the dominant theme driving equity market performance this year, causing stocks within the “Magnificent Seven” group to account for nearly half of the returns in the S&P 500 on a year-to-date basis. Major hyperscalers in the public AI space, including Amazon, Google, Meta, and Microsoft, are spending astronomical amounts of money – collectively, close to $400B in 2025 alone – to invest in this new technology. These companies have also communicated to the market that the risk is spending too little, rather than too much, on AI, supporting the arms race narrative. 3Q earnings season showed few signs of a slowdown in spending, with capital expenditures (capex) expected to broadly increase in 2026, and the use of so-called “circular financing” across key players has investors drawing comparisons to the Dot-Com Bubble. These trends, coupled with a frothy market, has investors raising their eyebrows, begging the question of whether we are in an AI bubble.
The mania surrounding AI has caused the forward P/E ratio of the S&P 500 index to increase above its 10-year average of 18.7x to 21.5x. While tech valuations are driving this broader market froth, when compared to 10-year historical averages, valuations of the Magnificent Six (ex-Tesla) look high, but not lofty, illustrated in Exhibit 1. It is also important to note that unlike the Dot-Com Bubble, today’s tech companies are profitable, with the tech sector posting double-digit earnings growth in 7 out of the last 8 quarters. 3Q earnings growth for tech companies, however, is shaping up to be the lowest growth figure since 1Q 2023, indicating that this trend may be starting to slow, albeit still at a double-digit pace.
Exhibit 1: Forward P/E vs. 10-Year Average
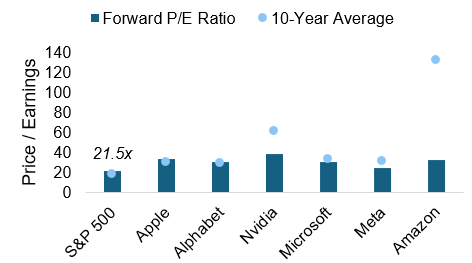
Historical and forward-looking earnings growth estimates are supportive of today’s valuations in the key hyperscaler companies, but investors have become more wary about capex. The majority of hyperscaler capex is going towards the buildout of data centers, which are needed to house cloud computing and other AI technologies but will likely take years to build given power generation constraints. This means investors (and the hyperscalers) may have to wait years before seeing a return on their investment, supporting the argument that markets have gotten ahead of themselves with the AI trade. While markets are seeing more debt issuance to fund the AI infrastructure build-out in both public and private markets, the hyperscaler companies continue to sit on high levels of cash, illustrated in Exhibit 2. While these trends support non-bubble territory, it does not mean that caution isn’t warranted. For instance, smaller or unprofitable tech companies may experience more strain if they are forced to use leverage to fund AI investments. Accounting practices are also being scrutinized by investors as it relates to estimating the useful lives of chips, evidenced most recently by Nvidia, creating further skepticism. The hyper-competition among the hyperscalers is expected to continue, but given the run-up already seen in the past two years, the risk to the downside has emerged as a growing concern, supporting diversification outside of AI, but not necessarily for bubble reasons.
Exhibit 2: Hyperscaler Capex & Cash Flow
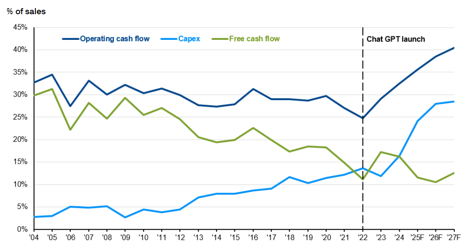
Source: JPMorgan Guide to the Markets
The Bottom Line: Equity markets in 2025 have been fueled by AI mania, prompting investor concern about bubble territory. Valuations of today’s large tech companies are supported by earnings growth, but moving forward, investors should be wary of lofty capex projections that carry no guarantee of investment return.
Looking Ahead
Testing U.S. Resilience
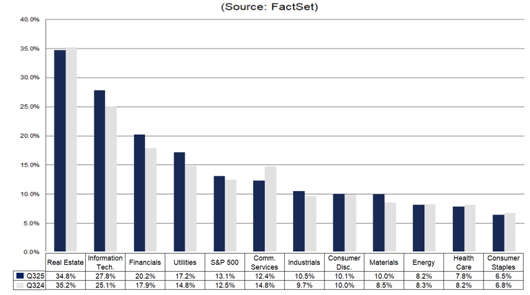
If 2025 taught investors anything, it is that the U.S. economy is resilient; however, multiple factors will test this resilience heading into 2026. Tariffs continue to be an outstanding threat despite Supreme Court scrutiny, with the potential to roil U.S. businesses who, thus far, have managed tariffs relatively well by shifting supply chains and absorbing higher costs. Net profit margins across equity sectors are similar if not better to where they were a year ago, illustrated in Exhibit 3, demonstrating the resilience of the corporate market. However, the longer these tariffs remain in place, the higher the probability of margin erosion, which could potentially induce companies to pass these higher costs onto an already-hurting consumer.
Exhibit 3: S&P 500 Net Profit Margins
The presence of this tariff threat is why economists continue to worry about inflation in the short-term, which has remained sticky around 3%, above the Federal Reserve’s longer-term 2% target. While markets are currently projecting three 25-bps rate cuts by the Fed over the next year, central bank policymakers will have to carefully weigh potential inflationary concerns against a slowing labor market, a difficult balance to strike. Recent private and federal jobs data (despite a lapse due to the government shutdown) has supported a slowdown in labor demand, which is occurring alongside a slowdown in labor supply as a result of the Trump Administration’s immigration policies. These projected trends in inflation and the labor market are contributing to a souring consumer, particularly in the lower-income cohorts. Years of inflation and higher borrowing costs have depleted consumer savings, and consumer confidence is trending lower, illustrated in Exhibit 4, with consumers expecting worsening inflationary and labor market conditions looking ahead. These expectations matter because they ultimately drive spending decisions or consumption, which represents roughly 70% of overall U.S. GDP growth.
Exhibit 4: Consumer Confidence Index®
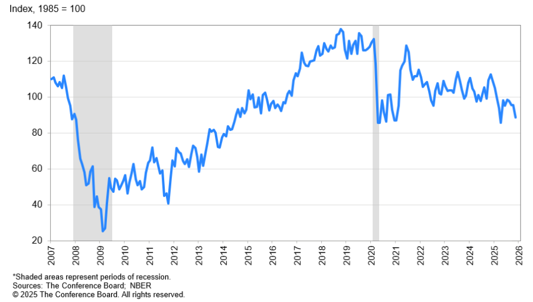
Sour consumer expectations can become self-fulfilling prophecies and have the potential to weigh on the broader economy. All of these factors combined – persistent inflation, a cooling labor market, and slowing economic growth from a weakening consumer – set the stage for potential stagflation, a policymaker’s nightmare and a critical threat to economic resilience. Finally, a wealth effect from equity market gains, driven by the AI trade, has led to the emergence of a K-shaped economy, whereby lower-income cohorts are in a weaker position than their higher-income counterparts. Should the AI trade fall apart, this could weaken the resilience in the higher-income consumer cohort. As the year draws to a close, these risks warrant monitoring, and time will tell whether the U.S. will continue to display resilience in 2026.
The Bottom Line: As 2025 wraps up, multiple factors will test the resilience of the U.S. economy, including potential additional inflationary pressures due to tariffs, softening in the labor market, and deteriorating consumer economic expectations, particularly in the lower-income cohort, calling for caution and prudence.
Capital Markets Themes
What Worked, What Didn’t
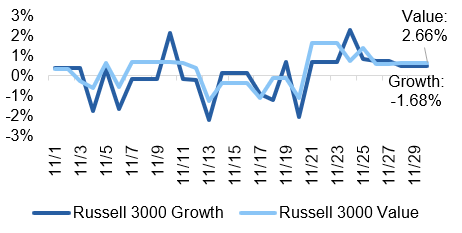
•Growth Stocks Struggle: After outperforming their value counterparts in October, growth stocks underperformed in November as a result of increased investor skepticism over lofty tech company valuations.
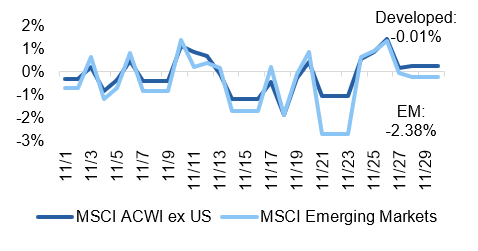
•Negative Returns for EM: Emerging markets also experienced negative returns from the rotation away from tech with underperformance coming most prominently from countries like Taiwan and Korea.
•Muted Month for Fixed Income: Returns across fixed income securities were relatively muted in November as yields stayed relatively stable, focused on the Fed and their interest rate decision in December.
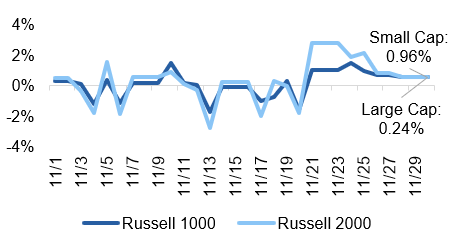
Large vs Small Cap Equity
Growth vs Value Equity
Developed vs Emerging Equity
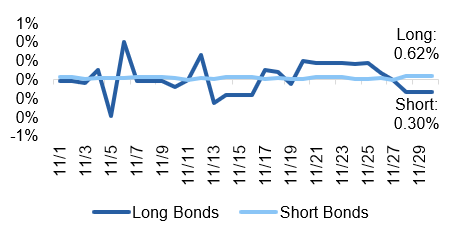
Short vs Long Duration Bonds
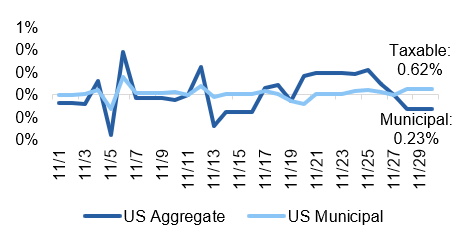
Taxable vs Municipal Bonds
Investment Grade vs High Yield Bonds
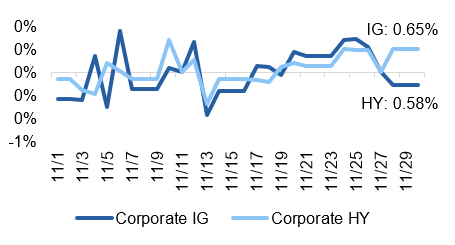
Source: YCharts. Data call-out figures represent total monthly returns.
On Alternatives
Private Credit Concerns
In recent months, the private credit market has experienced a string of high-profile defaults, notably from firms First Brands, Tricolor, and Renovo, raising concerns of a broader deterioration in the asset class. The first thing to note is that “private credit” is a very broad term and all three of these bankruptcies occurred in different pockets of the market – the broadly syndicated loan market for First Brands, the asset-backed financing market for Tricolor, and the private debt market for Renovo, and all three companies defaulted for unique reasons. Importantly, the defaults of First Brands and Tricolor centered around fraud allegations whereas the Renovo collapse involved a write-down of the loan from par to $0 in a matter of weeks, raising concerns over underwriting standards.
There are a few important lessons investors should takeaway from these credit events. The first is that defaults happen and they do not automatically signal systemic weakness. The private credit market has grown rapidly to a size of around $2 trillion – nearly 10x the size it was in 2009, according to data from Preqin – offering some perspective on the size impact of these defaulting loans.
Exhibit 5: Private Credit Deal Activity
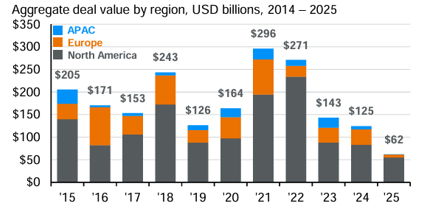
Additionally, like with any growing market, strong demand in private credit has attracted a broader range of lenders, including some who are more willing to accept looser underwriting standards. Driving this loosening is the lack of deal activity seen in recent years, illustrated in Exhibit 5. The high demand from investors coupled with lower deal activity has caused some lenders to be more willing to accept lighter covenants. Covenants are an important risk management mechanism in the private credit market – stricter covenants equate to stricter obligations for borrowers and thereby stronger protection for lenders. With the Fed continuing its rate cutting campaign, economic conditions are expected to further ease, which can coincide with loosening underwriting standards, but it may also re-ignite dealmaking activity. Lastly, while these three defaults have garnered much attention in the headlines, default rates across both private credit and the leveraged loan market remain below 2%, illustrated in Exhibit 6. The CDLI Index, the industry’s benchmark for the direct lending market, which is the largest asset class within private credit, is continuing to show earnings and EBITDA growth in the double-digits, a healthy signal. As always, it important to be selective in markets and work with managers who take a more conservative and quality-focused approach, which can help reduce exposure when defaults like the ones seen recently inevitably occur.
Exhibit 6: Default Rates
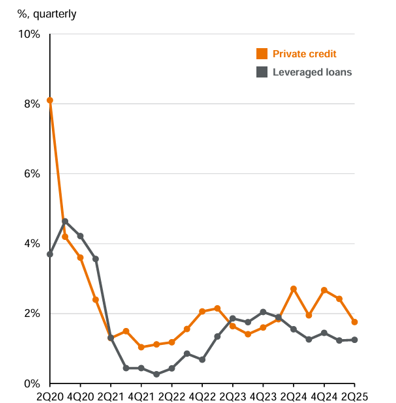
Chart Sources: JPMorgan Guide to Alternatives. Data through 2Q25.
The Bottom Line: The private credit market has come under scrutiny in recent weeks after a string of defaults across the ecosystem. While defaults are normal and do not automatically signal systemic risk, they heighten the importance of understanding the underlying structures of the debt, particularly as the Fed looks to further ease economic conditions.
Asset Class Performance Quilt
Markets are ever-changing, making diversification across asset classes and sectors a critical component to portfolio construction. As illustrated below, a Balanced 60/40 portfolio provides greater consistency of returns and less volatility over time.
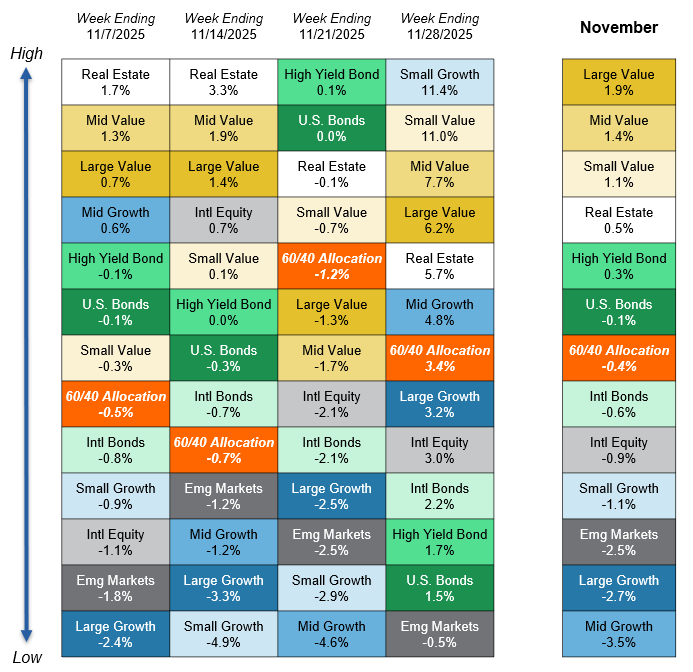
Source: YCharts. Asset class performance is presented using market returns from an exchange-traded fund (ETF) proxy that best represents its respective broad asset class. Returns shown are net of fund fees for and do not necessarily represent performance of specific mutual funds and/or exchange-traded funds recommended by Centura Wealth Advisory. The performance of those funds may be substantially different than the performance of broad asset classes and to proxy ETFs represented here. U.S. Bonds (iShares Core U.S. Aggregate Bond ETF); High Yield Bonds (iShares iBoxx $ High Yield Corp Bond ETF); Intl Bonds (Invesco International Corporate Bond ETF); Large Growth (iShares Russell 1000 Growth ETF); Large Value (iShares Russell 1000 Value ETF); Mid Growth (iShares Russell Mid-Cap Growth ETF); Mid Value (iShares Russell Mid-Cap Value ETF); Small Growth (iShares Russell 2000 Growth ETF); Small Value (iShares Russell 2000 Value ETF); Intl Equity (iShares MSCI ACWI ex US ETF); Emg Markets (iShares MSCI Emerging Markets ETF); and Real Estate (iShares US Real Estate ETF). The return displayed as “60/40 Allocation” is a weighted average of the ETF proxies shown as represented by: 40% U.S. Bonds, 12% International Stock, and 48% Large Blend.

