Market Month in Review – January 2026

At a Glance
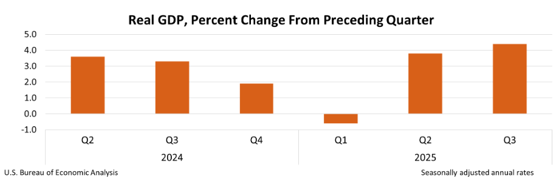
Macro Indicators: Inflation measures remain above the Fed’s long-term 2% target; however, there are greater concerns about the labor market, which is experiencing softening amid the “low hire, low fire” environment. GDP growth is surprising to the upside with third quarter data showing growth of 4.4%, driven by strong consumer spending and business investment, particularly within the technology sector.
Trump 2.0: The President made his nomination for the new Fed Chair, Kevin Warsh, who is expected to replace current Fed Chair Jerome Powell in mid-May. The Trump Administration also increased geopolitical pressures over the month, with the forced removal of Venezuelan President Maduro, threats to take over control of Greenland, and increased pressure on Iran. Tariffs remain in place unless the Supreme Court rules they are illegal.
Fed & Monetary Policy: The Federal Open Market Committee (FOMC) left interest rates unchanged in January. Current Fed Chair Powell’s term ends in mid-May and it is still undetermined whether he will stay on the Board after the fact. While concerns about Fed independence re-ignited over the month as the Department of Justice initiated a criminal probe into Chair Powell over the costly renovation of the Fed’s HQ, President Trump’s pick of Kevin Warsh as the next Chair quelled concerns.
Capital Markets: Geopolitical shocks and policy moves prompted volatility in commodity markets like gold and silver alongside continued weakness in the U.S. Dollar, but these trends reversed upon Warsh’s nomination. Early earnings releases point to another solid quarter, but elevated expectations in the tech sector fueled volatility across equity markets.
Asset Class Performance
After a stand-out performance in 2025, international equities continued the momentum in January, outpacing domestic equity markets. Within the U.S., small cap stocks outperformed large cap stocks, and fixed income markets experienced relatively muted performance to kick-off the first month of the new year.
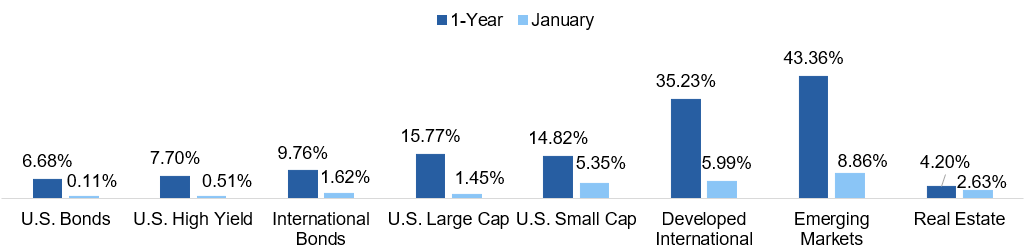
Source: YCharts. Asset class performance is presented using total returns for an index proxy that best represents the respective broad asset class. U.S. Bonds (Bloomberg U.S. Aggregate Bond TR), U.S. High Yield (Bloomberg U.S. Corporate High Yield TR), International Bonds (Bloomberg Global Aggregate ex-USD TR), U.S. Large Cap (S&P 500 TR), U.S. Small Cap (Russell 2000 TR), Developed International (MSCI ACWI ex US TR), Emerging Markets (MSCI EM TR), and Real Estate (Dow Jones U.S. Real Estate TR).
Markets & Macroeconomics
Does Interest in Gold & Silver Spell Trouble for the Dollar?
Ever since the Trump Administration’s “Liberation Day” in April 2025, markets have witnessed a broader diversification away from U.S. assets, prompting a decline in the global reserve currency. President Trump’s policies, in addition to concerns over persistent federal deficits, have popularized a “debasement trade,” a trade centered around a fall in value of a currency, in this case, the U.S. dollar. This trade has manifested itself in metal markets, which can be used as a hedge against a falling dollar, prompting greater interest and precipitous rises in the prices of gold and silver over the past year, illustrated in Exhibit 1.
Exhibit 1: Gold, Silver & U.S. Dollar Returns
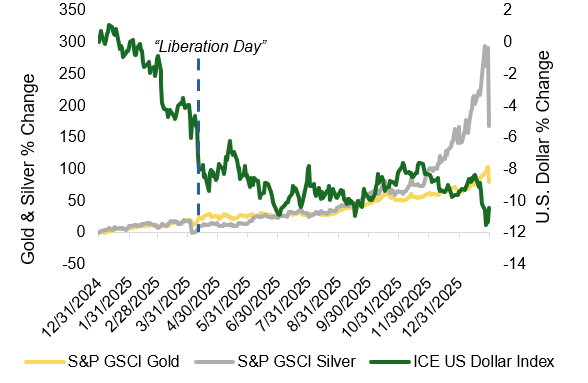
Geopolitical concerns are likely also driving commodity prices to start the year as global tensions have risen in place like Venezuela, Greenland, and Iran, most of which have been precipitated by the U.S. This combination of factors caused gold and silver to hit record highs in January, with gold prices topping $5,500/oz, nearly doubling in price since the beginning of 2025. Silver has experienced a more speculative run-up, surging to over $121/troy oz in January. While both metals offer intrinsic value that is attractive during currency downtrends, silver’s role as an industrial component, specifically for AI hardware, has helped fuel its growth. This dual purpose is likely responsible for silver’s parabolic rise that began last fall, but it can also lead to greater volatility than its gold counterpart.
The U.S. dollar index is trading at lows not seen since 2022, and this depreciation is a concern for markets, with retail participants driving the surge in gold and silver, illustrated by the rise in ETF flows in Exhibit 2.
Exhibit 2: Cumulative Net Retail Flows
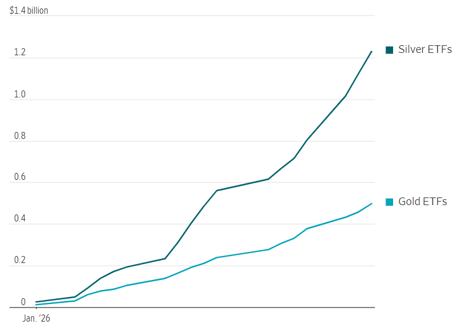
Source: Vanda Research (via Wall Street Journal)
President Trump acknowledged the dollar’s depreciation this month and, unlike markets, demonstrated a lack of concern. There are reasons why a falling dollar could be a good thing, including increasing the global competitiveness of domestic producers and domestically-manufactured goods abroad; however, there are some perils to a depreciating currency, like potential inflationary effects of higher import costs and a general erosion of confidence in the nation. Amid the current uncertain policy backdrop, investors are looking for reassurance that U.S. assets are a “safe” investment. The announcement of new Federal Reserve Chair Kevin Warsh offered much-needed comfort about Fed independence to markets to end January, prompting a rise in the dollar and a subsequently volatile fall in gold and silver. Time will tell on whether the debasement traders are correct, but, for now, the U.S. dollar remains the world’s most utilized currency.
The Bottom Line: President Trump’s policies, rising federal deficits, and geopolitical concerns have driven gold and silver prices to new highs, fueling the “debasement trade;” however, the recent appointment of new Fed Chair Kevin Warsh prompted a reassuring reversal in this trade to end January, illustrating how much markets are focused on policy decisions in the U.S.
Looking Ahead
Policy Remains at the Forefront
The month ended with monetary policy headlines: interest rates were held steady at the January FOMC meeting and President Trump nominated former Fed Governor Kevin Warsh as the new Fed Chair. This nomination came after intense speculation over who would replace current Chair Powell amid threats to central bank independence from the Trump Administration. The choice of Warsh, once a self-proclaimed “hawk” or a governor who supports higher interest rates, brought initial reassurance to independence concerns to close out the month.
Now that markets have clarity on the next Fed Chair, attention can turn back to what matters most: the health of the economy. According to CME FedWatch, markets are currently expecting one to two 25-bps interest rate cuts in 2026 as inflation remains above-target, the labor market cools, and economic growth remains robust. The labor market remains the key concern for policymakers: major layoffs were announced by Nike, Amazon, UPS, and Home Depot in January, and the post-college graduate working cohort is experiencing the highest rates of unemployment, even as broader federal unemployment remains steady around 4.4%.
Exhibit 3: 4-Week Moving Average of Initial Jobless Claims
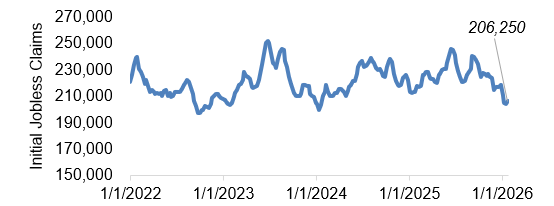
Source: FRED
Part of why the unemployment rate has not ticked higher is due to stricter immigration policies from the Trump Administration, which has contracted the amount of labor supply in the market, which, when met with more muted labor demand, has kept the unemployment rate moderate by historical standards. While labor softening trends are evident, other metrics support a relatively stable labor market, like the 4-week moving average of initial jobless claims, illustrated in Exhibit 3 with levels above 250,000 typically signaling greater labor market weakness. Should the labor market begin deteriorating across numerous metrics, the Fed is likely to cut interest rates more aggressively. One reason holding the Fed back from cutting interest rates further in 2026 is robust GDP growth, illustrated in Exhibit 4. While tariffs have skewed some of the GDP data, the key driver of economic growth has been consumer spending, followed by business investment, which has been fueled by AI capex.
Exhibit 4: GDP Growth
Despite gloomy survey data, the American consumer continues to spend, and the Trump Administration is hoping this trend continues in the lead-up to midterm elections in November. As we look ahead to the next 11 months of 2026, there are a few key policy matters to keep on the radar: 1) the “One Big Beautiful Bill” Act is expected to deliver a bumper crop of income tax refunds this spring, padding consumers’ wallets and supporting economic growth; 2) the Supreme Court will rule on the legality of the majority of President Trump’s tariffs, which could usher in a reversal of existing tariffs in their current form as well as add further uncertainty about how to unwind the tariffs; 3) rhetoric from the new Fed Chair about how he plans to manage the central bank’s dual mandate differently than his predecessor; and 4) the all-important midterm elections. All in all, the U.S. economy remains in solid condition, but with a changing of the guard at the Fed occurring in mid-May and an unpredictable fiscal policy agenda with major elections late this year, volatility is expected. Investors should understand the policy backdrop, but, at the end of the day, valuations should drive investment decision-making, not who is in charge at the Fed or whether the government is shut down.
The Bottom Line: Both fiscal and monetary policies are expected to be a driving force in 2026 as the Trump Administration focuses on spurring growth and the Fed manages its dual mandate under new leadership, with all eyes on the midterm elections later this year.
Capital Markets Themes
What Worked, What Didn’t
•Value Outperforms: Value stocks outperformed their growth counterparts as tech valuations continued to come under pressure, following a trend set at the end of 2025.
•International Run Continues: International equity markets continued their run-up in January after a banner 2025, with emerging markets outperforming developed international equities, boasting cheaper valuations and a boost from a depreciating U.S. dollar.
•Is this the year for small caps?: Small cap stocks outperformed their large counterparts in January, and the asset class’s outlook involves a positive earnings growth picture and a supportive environment as interest rates expect to decline further.
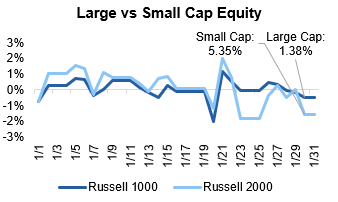
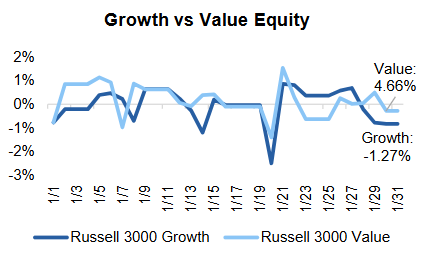
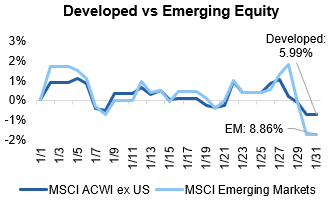
Source: YCharts. Data call-out figures represent total monthly returns.
On Alternatives
How IPOs and M&A Activity Shapes Private Equity Returns
Private equity value creation is driven by several factors, but investor returns ultimately depend on successful exits. IPO (Initial Public Offering) and M&A (Mergers & Acquisition) activity are the primary pathways that allow private equity firms to realize gains and return capital to investors. To understand why these exit channels are so critical, it helps to first look at how private equity (PE) firms generate value. While not all private equity firms operate identically, most follow a similar model: acquiring companies they believe are undervalued or can be operationally improved, with the goal of selling them later at a higher price. However, these strategies only translate into investor returns if firms are able to access viable exit opportunities. There are three main channels that PE firms use for exits: 1) IPO – the gold standard, typically offering the highest upside potential 2) Strategic – the sale of a portfolio company to another company looking to grow or strengthen its business (often through M&A) 3) Secondary Market – the sale of a portfolio company to another PE firm that believes it can create additional upside. These three exit channels work in harmony to ultimately drive returns for PE funds and their investors.
Exhibit 5: IPO Count vs Federal Funds Rate
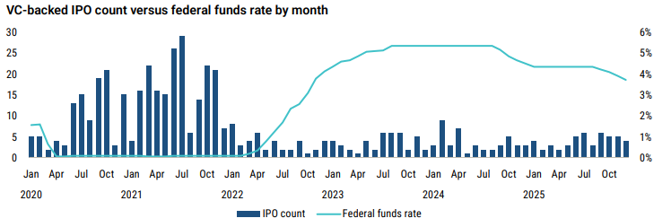
Source: PitchBook
As with many sensitive ecosystems, when a new variable is introduced, it has the capacity to disrupt the entire system. Enter the Federal Funds Rate. For years following the GFC (Global Financial Crisis), interest rates hovered near zero.
After the pandemic and subsequent government stimulus, inflation ran rampant, forcing the Fed to raise rates and disrupt the homeostasis of these markets. As interest rates rose, the cost of borrowing increased, causing growth to become more challenging. During this time, IPO activity faced a steep decline, illustrated in Exhibit 5.
Exhibit 6: PE Deal Activity
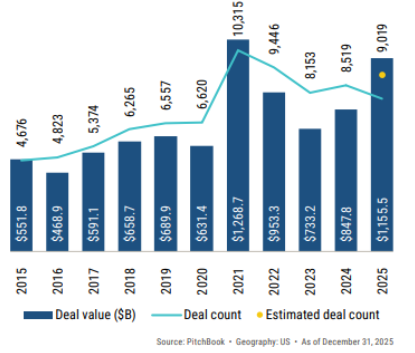
Knock-on effects included a reduction in M&A activity and a general slowing of PE deal flow. This slump has resulted in fewer exits for PE, which in turn has delayed capital returning to investors and made the fundraising environment more challenging for new funds looking to raise capital. While activity remained challenging, 2025 was expected to mark a resurgence and reopening in the market. Tariff-related volatility in the first half of ’25 delayed that recovery, but once markets adjusted, the second half of the year began moving in the right direction. As shown in Exhibit 6, 2025 trended positively, with deal activity in both count and value reaching the highest levels since ’21 peaks. Looking forward to ’26, we expect this trend to continue, bolstered by AI-driven efficiency improvements and continued investment, additional rate cuts under new Fed leadership, and an administration focused on positive economic sentiment heading into the November midterm elections.
The Bottom Line: Manager selection is increasingly critical as challenging exit and fundraising conditions are likely to drive greater dispersion across sponsors, with some managers potentially raising their final fund. This environment reinforces the importance of rigorous due diligence and may create opportunities for investors to capitalize on market dislocations.
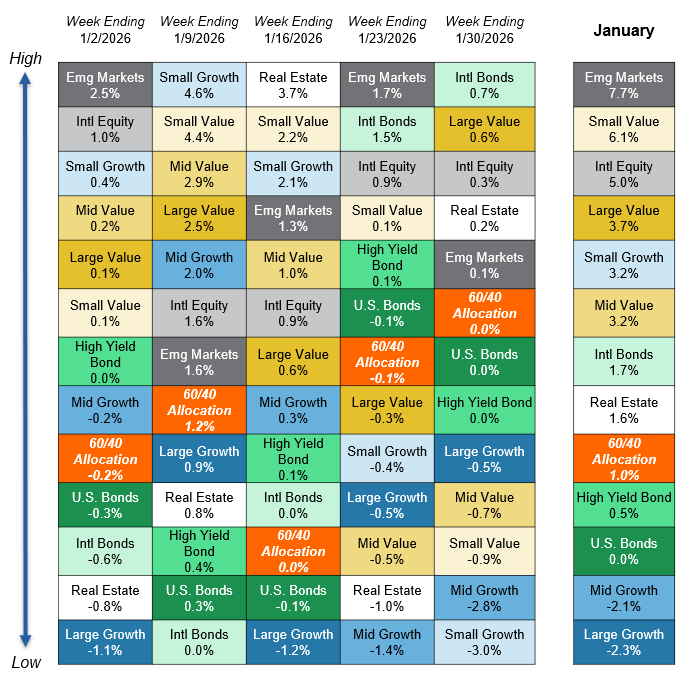
Asset Class Performance Quilt
Markets are ever-changing, making diversification across asset classes and sectors a critical component to portfolio construction. As illustrated below, a Balanced 60/40 portfolio provides greater consistency of returns and less volatility over time.
Source: YCharts. Asset class performance is presented using market returns from an exchange-traded fund (ETF) proxy that best represents its respective broad asset class. Returns shown are net of fund fees for and do not necessarily represent performance of specific mutual funds and/or exchange-traded funds recommended by Centura Wealth Advisory. The performance of those funds may be substantially different than the performance of broad asset classes and to proxy ETFs represented here. U.S. Bonds (iShares Core U.S. Aggregate Bond ETF); High Yield Bonds (iShares iBoxx $ High Yield Corp Bond ETF); Intl Bonds (Invesco International Corporate Bond ETF); Large Growth (iShares Russell 1000 Growth ETF); Large Value (iShares Russell 1000 Value ETF); Mid Growth (iShares Russell Mid-Cap Growth ETF); Mid Value (iShares Russell Mid-Cap Value ETF); Small Growth (iShares Russell 2000 Growth ETF); Small Value (iShares Russell 2000 Value ETF); Intl Equity (iShares MSCI ACWI ex US ETF); Emg Markets (iShares MSCI Emerging Markets ETF); and Real Estate (iShares US Real Estate ETF). The return displayed as “60/40 Allocation” is a weighted average of the ETF proxies shown as represented by: 40% U.S. Bonds, 12% International Stock, and 48% Large Blend.

