Capital Market Projections

Executive Summary
- Capital market projections (risk & return) allow Centura Wealth Advisory (CWA) to help clients with long-term strategic financial planning
- Estimates are applicable to financial planning, portfolio construction and risk management
- Represent the best thinking regarding forward looking markets and a longer-term outlook
- Issued by many sources and different methodologies are employed
- Financial planning risk models (e.g., Monte Carlo simulation) require such assumptions as inputs
- Portfolio construction utilizes these projections to evaluate markets and make informed decisions around asset allocation and investments
- Careful planning is recommended given current views on forward looking markets and the uncertainty represented therein
Introduction
Capital market return (and risk) projections are at the heart of wealth management. These projections are a critical input to financial planning and portfolio management applications where the opportunity cost of mis-estimation is material: project too high and one may get a false sense of security out of their retirement plan and/or portfolio estimates; project too low and one may not provide a realistic estimate of the future, thereby making naïve decisions with potentially harmful results (e.g., working too long, saving too much, taking too much portfolio risk, etc.).
In part 1 of a 3-part series, we discuss capital market projections, provide a framework for creating current estimates and compare those estimates to historical results. In parts 2 and 3 of this series, we discuss how capital market projections are used in financial planning and portfolio construction (i.e., Monte Carlo simulation and mean/variance optimization) applications.
Capital Markets

Capital markets are venues where buyers and sellers engage in trade of financial securities. Examples include stock and bond markets where savings and investments are exchanged between the suppliers of capital and those who demand it. Suppliers of capital include retail and institutional investors whereas those in need of capital are businesses, governments and people. 1,2,3
Capital markets consist of various types and sub-types. For example, stock markets can be broken down into large, mid and small company stocks as well as growth, value or blend.4 While there are many ways to slice and dice capital markets, below is a list of asset classes that are common among many of the providers and are also utilized in both financial planning and portfolio management applications at Centura:
| Table 1 – Capital Market Asset Classes | ||
|---|---|---|
| Equities | Fixed Income | Alternatives |
| Large Cap Growth | Government | Real Estate |
| Large Cap Value | Municipal | Hedge Funds |
| Mid Cap | Corporate | Private Equity |
| Small Cap | High Yield | Commodities |
| International Equities | International | |
| Emerging Markets | Cash | |
Each asset class has its own drivers of both risk and returns and must be evaluated differently when measuring and predicting both risk and returns. In addition, different firms and analysts within those firms may have different methods of evaluating each asset class and that means a wide variety of methodologies are employed.
To illustrate how firms may vary, here is an example of how Invesco estimates asset class returns which differs slightly from the approach used at the Callan Institute. We won’t dive into the specifics of different methods employed, but one should understand that differences exist between firms and careful consideration should be paid as to which estimates are utilized, when and why.
Capital Market Returns: Historical Results
Now that we understand different capital markets and their related asset classes, we can evaluate historical data to see how various asset classes have performed over time:
| Table 2- Asset Class Historical Results | |||
|---|---|---|---|
| Asset Class | Index | Annualized* Return (10yr) | Annualized* Return (25yr) |
| Large Cap | S&P 500 | 13.12% | 9.07% |
| Mid/Small Cap | Russell 2500 | 13.15% | 9.62% |
| International Equities | MSCI World ex USA | 6.24% | 4.76% |
| Emerging Markets | MSCI Emerging Mkts | 8.02% | 7.9%1 |
| US Fixed Income | Barclays Aggregate | 3.48% | 5.09% |
| Non-US Fixed Income | Barclays Global Agg ex-USA | 1.73% | 4.39% |
| Cash | 90-day T-Bill | 0.37% | 2.55% |
| Hedge Funds | Callan Hedge FOF | 5.26% | 6.06% |
| Commodities | Bloomberg Commodity | -3.78% | 2.03% |
| Private Equity | Cambridge PE | 11.62% | 15.46% |
| Real Estate | NFI-ODCE | 6.01% | 8.05% |
| Annualized returns for periods ended 12/31/2018. 1 Denotes 15 yr annualized return as 25 yr data is not availableSource: Callan Institute | |||
Historical returns are the baseline for which forward looking projections can be evaluated against and contextualized upon. While historical returns are insightful and provide context for both planning and portfolio management applications, they may have little or nothing to do with what is expected to take place in the near, intermediate and/or long term. To highlight this point, we note the well-known industry disclaimer which states, “past performance is not indicative of future results”. So, to cover our bases and provide a more robust view, we will now look at forward looking return projections followed by a comparison between the past and present.
Capital Market Return & Risk: Forward looking projections

To predict the future, however futile that may be, many institutions provide capital market projections that provide practitioners (and interested readers) with their firms best thinking regarding forward looking markets and long-term outlooks. These estimates serve as inputs for a variety of applications including Monte Carlo simulation and portfolio construction using mean variance optimization, both of which are key considerations to a healthy and sustainable long-term financial plan.
A partial but influential list of firms that provide capital market forecasts include:
- Callan Institute
- JP Morgan
- Blackrock
- Bank of New York
- MFS
- RBC
- PIMCO
- Goldman Sachs
While any single provider can be utilized, each brings a different methodology to the table and an average of several providers can be a good way to obtain exposure to many firms’ best ideas and to reduce risk associated with any one firms’ method being off in any given year.
The Table 3 below shows different asset classes and the 10 year forward looking estimates, averaged amongst several providers included in the list above. Table 3 also shows the estimated Sharpe ratio (i.e., risk adjusted return) which allows for an apples-to-apples comparison of asset classes, controlling for risk. Furthermore, we also include the real return, which is gross return less inflation (estimated to be 2.14% over the same period). In Chart 1 we represent these same results visually.
| Table 3 – Forward Looking Estimates | ||||
|---|---|---|---|---|
| Asset Class | Return | Risk | Sharpe Ratio | Real Return |
| Cash Equivalents | 2.20% | 0.48% | 0.00 | 0.06% |
| US Fixed | 3.49% | 3.45% | 0.37 | 1.35% |
| Non-US Fixed | 1.95% | 6.57% | -0.04 | -0.19% |
| Hedge Funds | 5.25% | 6.91% | 0.44 | 3.11% |
| Emerging Market Debt | 5.37% | 9.08% | 0.35 | 3.23% |
| High Yield | 5.47% | 9.35% | 0.35 | 3.33% |
| Real Estate | 5.52% | 11.34% | 0.29 | 3.38% |
| US Large Cap Equity | 6.33% | 15.58% | 0.27 | 4.19% |
| Commodities | 3.04% | 16.40% | 0.05 | 0.90% |
| Dev International Equity | 7.03% | 17.55% | 0.27 | 4.89% |
| US Mid/Small Cap Equity | 7.03% | 19.31% | 0.25 | 4.89% |
| Private Equity | 7.41% | 21.45% | 0.24 | 5.28% |
| Emerging Market Equity | 8.61% | 22.75% | 0.28 | 6.47% |
| Note: inflation estimate is 2.14% annualized. Sources: Callan Institute, JP Morgan, Blackrock, Bank of New York, MFS, RBC | ||||
Chart 1
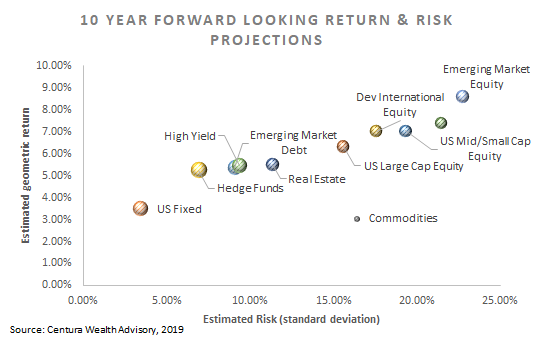
What is notable about the returns in Table 3, is that while asset class trends may be the same (e.g., stocks > bonds > cash) domestic equity returns are significantly lower than the returns in Table 2 as are private equity and real estate (over both time periods). This means that firms expect future returns in these asset classes to be less than historical results, which is in line with the big picture takeaways garnered from analysis of the current Shiller P/E ratio (as well as the current Buffett Indicator), both of which seek to estimate forward returns by incorporating capital market and economic data such as stock prices, GDP and earnings cyclicality. However, volatility in these asset classes is expected to stay in line with historical levels (if not slightly higher) which implies that investors should expect lower returns for the same level of risk on a go forward basis.
These lower forward-looking return projections are due to the cyclical aspect of business, credit and the economy. In the United States, we are late in the economic expansion cycle(s) and most expect some negative years (i.e., economic slowdown) in the coming decade which would materially impact return figures as compared to a decade prior when economic expansion was predominate.
This does not necessarily mean doom and gloom ahead but does imply that caution should be heeded in terms of where risk assets are allocated. Perhaps a greater allocation to cash and other stable investments is warranted given the relatively low level of anticipated inflation. However, if real returns on cash go markedly below zero, investors will be incentivized to purchase risk assets (e.g., stocks & bonds) at even more elevated prices than today, meaning the opportunity cost of sitting in cash is high. With such a dichotomy, careful planning is certainly required.
Conclusion
Individuals looking to retire (i.e., access investment assets for income) in the next 15 years would be well served to review their investment allocations and future income/cash-flow plans in the wake of a decade worth of gains in most risk assets. For these investors, locking in gains and preserving capital is of paramount importance, but in markets such as these professional guidance will certainly help navigate choppy waters.
Additionally, for investors already in retirement drawing down investment assets, extreme caution must be paid to asset distribution plans and how those assets are invested. Sequence risk can exacerbate financial plan failures and in order to protect against running out of money in adverse scenarios, sophisticated planning software and risk models must be employed to develop a robust cash-flow and integrated portfolio plan that is well suited to defend wealth in any and all markets.
In part 2 of this 3-part series, we will explore risk modeling in financial planning (e.g., Monte Carlo simulation). Last, part 3 will explore how capital market projections are used to construct portfolios and develop strategic asset allocations.
About the Author
Sean Clark holds a Master of Science in Risk Management from New York University and a Bachelor of Arts in Economics from Clemson University. Areas of practice include financial planning and portfolio management, specializing in applied mathematics and risk.
References
- https://www.investopedia.com/terms/c/capitalmarkets.asp
- https://www.investopedia.com/ask/answers/021615/whats-difference-between-capital-market-and-stock-market.asp
- https://economictimes.indiatimes.com/definition/capital-market
- Why does portfolio construction matter – PIMCO
- Callan Institute
- JP Morgan
- Blackrock
- Bank of New York
- MFS
- RBC
- PIMCO
- GoldmanSachs
- RightCapital
- XY Planning Network
- Invesco
- Multipl
- Gurufocus
- Yale.edu
- The balance

