Capital Market Projections for Asset Allocation and Portfolio Construction – Part 3 in series
Executive Summary
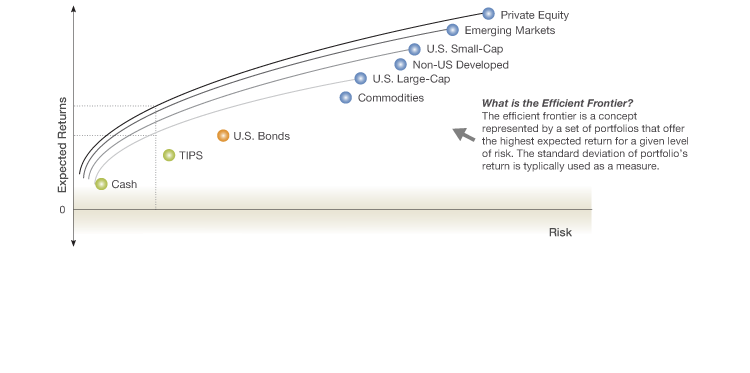
- Under Modern Portfolio Theory, the goal of portfolio construction is to extract as much return as possible for a given level of risk.
- Capital Market projections (the forecasting of expected rates of returns on assets, and the variance of those returns) are essential inputs to constructing efficient client portfolios.
- In addition to expected returns, and variance of those returns, efficient portfolio construction relies on the co-variance or correlation of each asset’s return with that of the others.
- The combination of a suite of portfolios optimized for efficiency and a sophisticated planning process that matches an individual’s cash flow needs with an optimal investment portfolio for their assets is at the core of true wealth management services.
Introduction
In this post, the third in a series of three on capital market projections, we will cover the importance of capital market projections in the process of asset allocation and portfolio construction. When constructing a portfolio, a portfolio manager will typically start with a desired level of risk or a target rate of return. From there the goal would be to maximize the portfolio’s expected return for the particular level of risk, or minimize the portfolio’s risk in pursuit of the targeted rate of return. In order to do either, we need to use capital market assumptions in the calculations. The greater the quality of the capital market forecasting, the greater probability that our targets will be met (i.e., efficient portfolios, successful financial plans, etc.)
The Fundamentals

Nobel Prize winning economist Harry Markowitz wrote the article “Portfolio Selection” in 1952 where he introduced the notion that combining uncorrelated assets reduced a portfolio’s risk, or variation of returns, to a greater extent than would be assumed by taking the average level of risk of each of the underlying holdings. This is incredibly important given that volatility can erode returns over time, and more efficient portfolios are preferred. Consider this example: If you lose 20% on an investment ($10 to $8) you need a 25% return to get back to $10 ($2/$8 = 25%), but if you lose 50% on an investment ($10 to $5) you need a 100% return to get back to $10 ($5/$5 = 100%). Since markets tend to move downward quicker and more violently than they go up, this is of key importance when building wealth over time. Thus, limiting downside risk when constructing portfolios is of paramount importance.
Portfolio Standard Deviation
When calculating the expected rate of return of a portfolio, one merely takes the simple weighted average of the expected return for each asset. But, when calculating the expected risk of a portfolio the calculation is lengthy and far more complex. It uses the expected variance (standard deviation squared) of each asset’s return along with the correlation of each pair of assets in the portfolio to one another. Let’s take a simple example to illustrate how this works in a portfolio of two assets that are perfectly uncorrelated (Correlation=0).
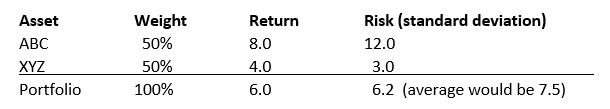
The return of the two-asset portfolio is the weighted average of the returns of the two assets. The risk of the portfolio, as measured by standard deviation, is significantly lower than the weighted average of the risk levels of the two assets. This is the math behind the benefits of diversification. Let’s be even more clear. In this example we will assume the two assets have the same risk and return expectations but are still perfectly uncorrelated.
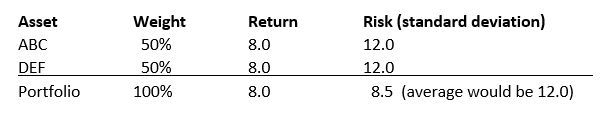
By combining two uncorrelated assets, the same level of return with a much lower level of risk would be theoretically achievable. This is referred to as having a better “risk adjusted” return, which is the ultimate goal of modern portfolio theory. In building a portfolio to target either risk or return, the forecasting of both is critical to the task.
Portfolio Construction
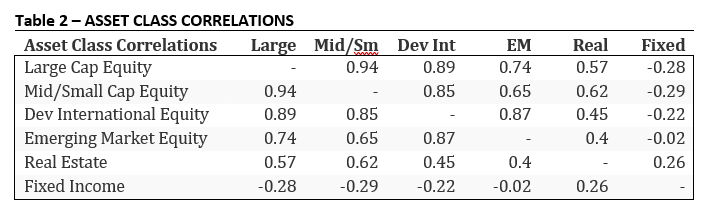
We can use the math from the previous examples to build a customized portfolio to suit a particular need. The inputs needed could be found in Table 1 (forecasted returns and risk), and Table 2 (asset class correlation matrix), which shows how correlated each of these asset classes are to each other.
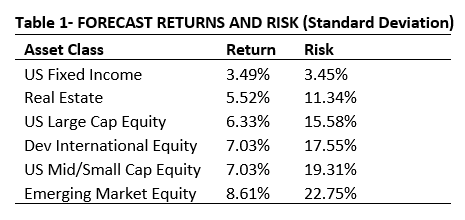
Sources: Callan Institute, JP Morgan, Blackrock, Bank of New York, MFS, RBC
Source: Silicon Cloud Technologies, LLC 2019.
In practice, we use data like this to build a suite of portfolios. Each portfolio in the suite is like a tool in the chest. They can be used independently or in combination with one another to accomplish a variety of tasks across a portfolio/estate. The array of potential solutions spans from low risk/low return portfolios to high risk/high return portfolios, with a variety of vehicles employed (e.g., stocks, bonds, ETF’s, mutual funds, SMA’s, LP’s, insurance, other). Regardless of need, the goal is that each portfolio in the suite has the highest expected level of return for its specified level of risk.
See a sample illustration of three different portfolios below in Exhibit 1, each representing a different risk tolerance (i.e, conservative, moderate, aggressive). By design, the expected returns increase as the risk increases and returns are maximized for each unit of risk taken.
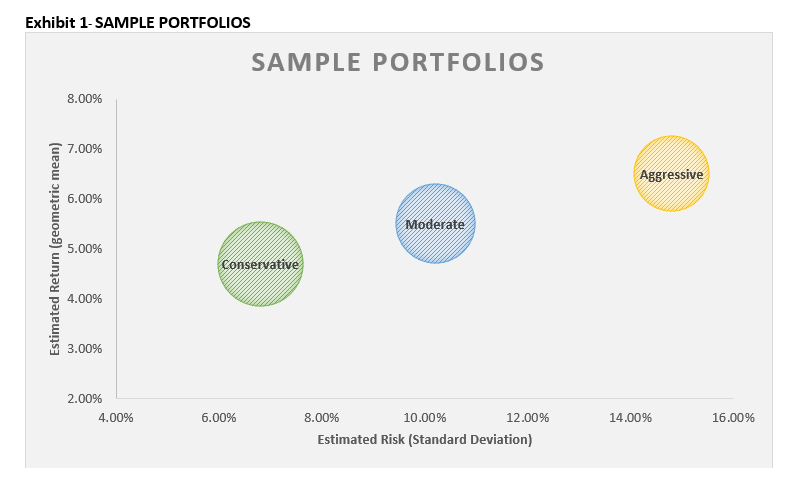
When done properly, a well-tailored financial plan includes custom portfolio solutions designed to meet specific client needs/goals. Portfolios like those shown in Exhibit 1 are crafted carefully and their constituents are not random. They are chosen based on investment ethos, capital market risk/return forecasts and the unique interplay between assets in the portfolio. At Centura, we believe that multi-asset portfolios are significantly more complex to model than most realize.
For example, illiquid alternatives do not behave the same way as exchange traded alternatives, and neither behaves the same way in all markets. Thus, sophisticated risk modeling must be employed to get a true understanding of how assets could behave in different scenarios. Ultimately assets selected for inclusion are accretive to risk adjusted returns at the portfolio level and can be combined with tactical shifts to over and under-weight different assets at different times to take advantage of opportunities.
Conclusion

Realizing that capital market projections play a critical role in the Liberated Wealth® management process, we take great care to ensure that we use thoughtful, forward looking capital market projections and that they are updated on a regular basis. These projections are used in our financial planning, asset allocation, and portfolio construction processes. The quality of these inputs’ ties directly to the quality of our process outputs and in striving to drive positive outcomes for our clients we ensure no detail is overlooked; this includes the capital market projections that are used.
At Centura, we use forward looking capital market projections to design and construct bespoke portfolios which seek to maximize risk adjusted returns, take advantage of opportunities presented in the market(s) and integrate with Monte Carlo simulation to forecast cashflows and asset growth over time. We don’t just take generic data prepopulated by software vendors, rather we take great care to analyze available data to ensure the quality of the projections used. If you have not had your portfolio analyzed for risk/return optimization or stress tested proactively to understand exactly what risks you are taking, contact Centura Wealth Advisory to learn how we can help.
Disclosures
Centura Wealth Advisory (“Centura”) is an SEC registered investment adviser located in San Diego, California. This brochure is limited to the dissemination of general information pertaining to Centura’s investment advisory services. Investing involves risk, including risk of loss.
Centura Wealth does not make any representations as to the accuracy, timeliness, suitability or completeness of any information prepared by any unaffiliated third party, whether linked to or incorporated herein. All such information is provided solely for convenience purposes and all users thereof should be guided accordingly.
Past performance is no guarantee of future results and may have been impacted by market events and economic conditions that will not prevail in the future. This newsletter contains certain forward‐looking statements (which may be signaled by words such as “believe,” “expect” or “anticipate”) which indicate future possibilities. Due to known and unknown risks, other uncertainties and factors, actual results may differ materially from the expectations portrayed in such forward‐looking statements. As such, there is no guarantee that the views and opinions expressed in this letter will come to pass.
Indices are unmanaged. Any reference to a market index is included for illustrative purposes only as it is not possible to directly invest in an index. The figures for each index reflect the reinvestment of dividends, as applicable, but do not reflect the deduction of any fees or expenses, or the deduction of an investment management fee, the incurrence of which would reduce returns. It should not be assumed that your account performance or the volatility of any securities held in your account will correspond directly to any comparative benchmark index. Bonds and fixed income investing involves interest rate risk. When interest rates rise, bond prices generally fall.
For additional information about Centura, please request our disclosure brochure as set forth on Form ADV using the contact information set forth herein, or refer to the Investment Adviser Public Disclosure web site (www.adviserinfo.sec.gov). Please read the disclosure statement carefully before you engage our firm for advisory services

