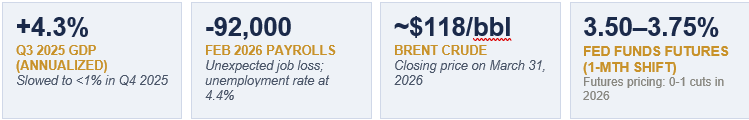
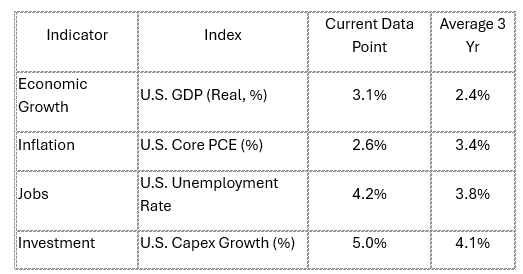
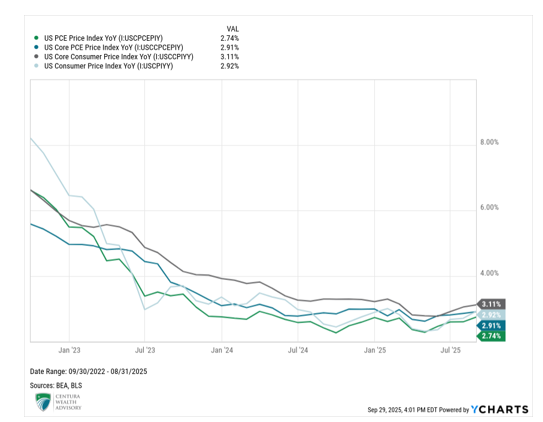
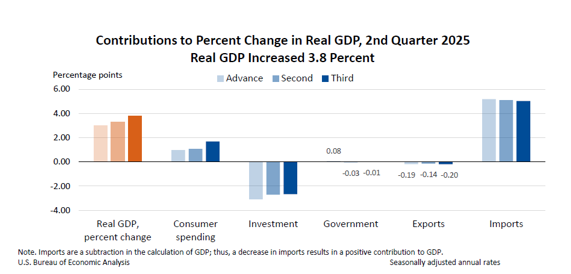
Macro Indicators: Inflation remains a key macroeconomic risk, with March headline CPI and PCE showing prices rising 3.3% and 3.5% on a YoY basis, respectively, due to increased energy prices related to the Iran conflict. The advance estimate for 1Q 2026 GDP printed at 2.0%, driven by AI investment spending, after 4Q 2025’s near-flat growth. The labor market continues to plod along, with unemployment claims continuing to tick down and the unemployment rate at 4.3% as of March.
Trump 2.0: Tariffs remain on the docket, contingent on Congressional approval in mid-July. Geopolitical tensions remain heightened in the Middle East despite the April 8 ceasefire. The fiscal year 2027 federal budget was released in April, proposing a 42% increase in defense and a subsequent 10% decrease in non-defense spending.
Fed & Monetary Policy: At the April FOMC meeting, the Fed held interest rates steady with notable dissents, signaling an uncertain path forward for monetary policy. During his last FOMC press conference as Chair, Jerome Powell broke from tradition to announce he will stay on the Board after his Chair term ends, citing concerns over Fed independence. Kevin Warsh is expected to replace Powell in mid-May, barring confirmation from the Senate.
Capital Markets: Risk assets came back into favor over the month, with U.S. equities rallying to all-time highs, fueled by the tech sector and a strong 1Q earnings season. The dollar reverted to its pre-Iran conflict trend of weakening, helping push international equity markets higher. Credit spreads remain tight and U.S. Treasury yields drifted toward 4.4% on oil-driven inflation concerns. Brent crude oil prices ended the month around $114/bbl.
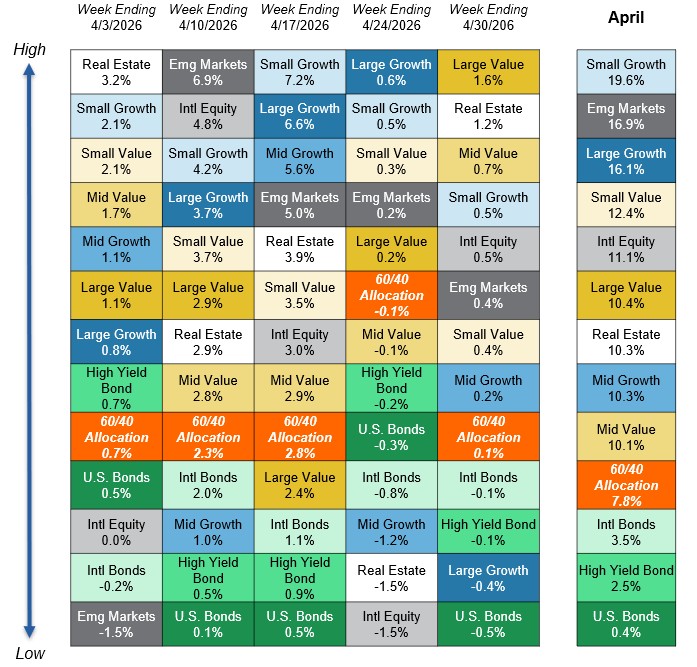
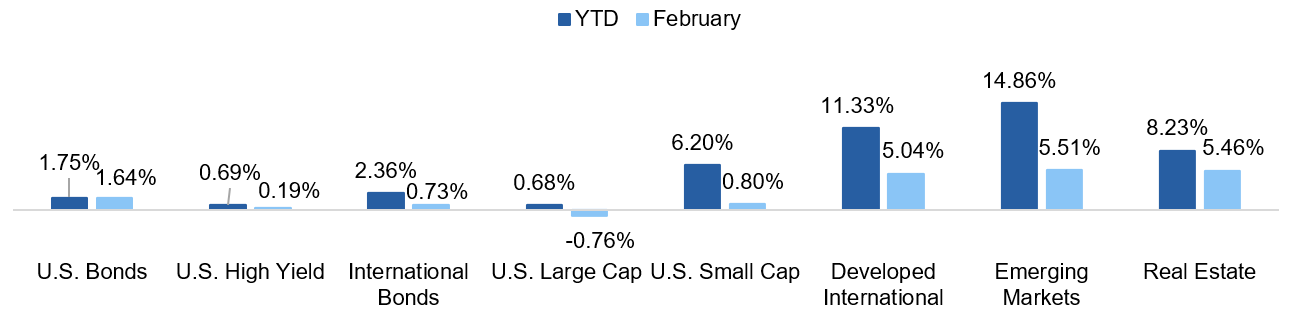
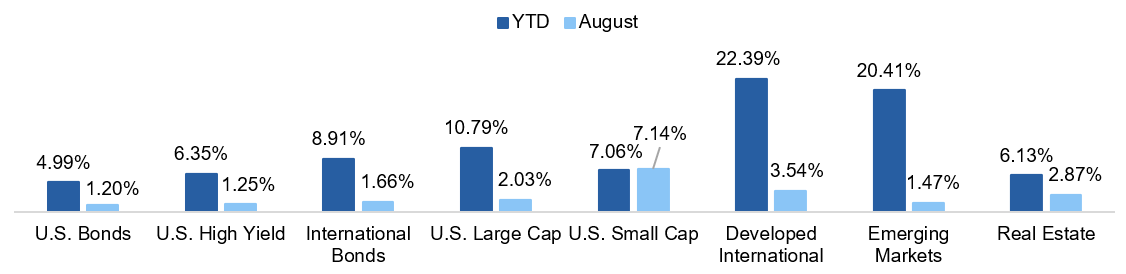
Asset Class Performance
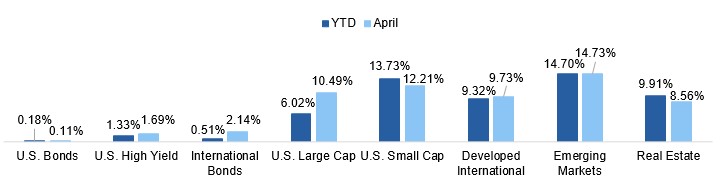
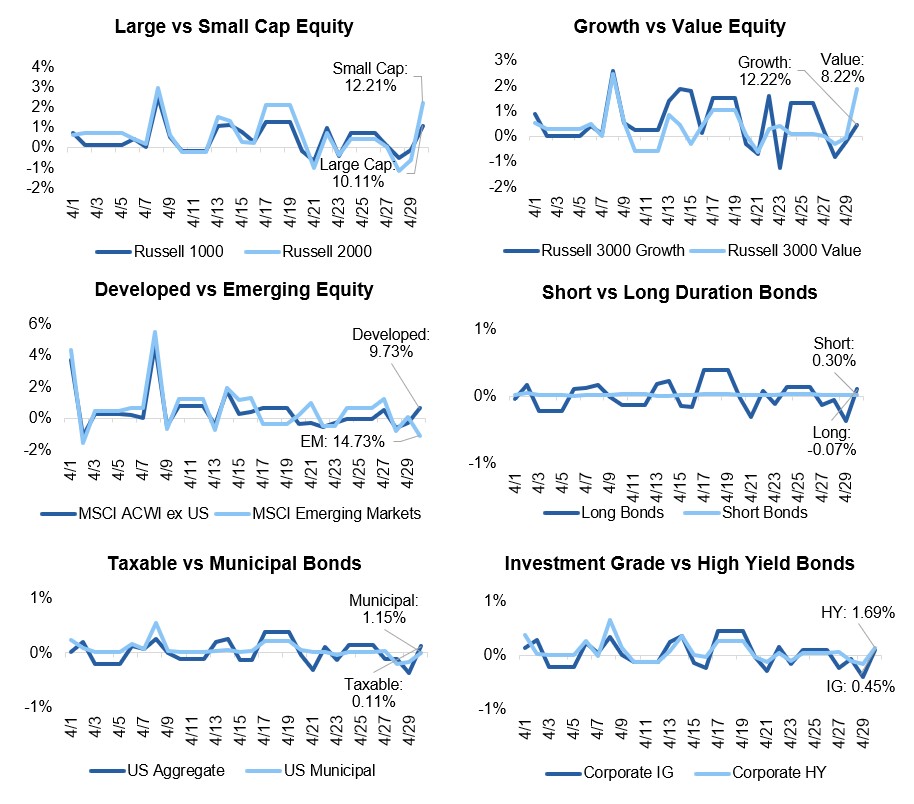
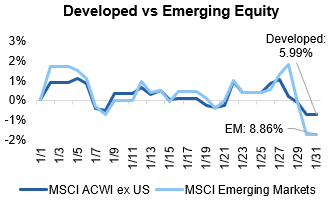
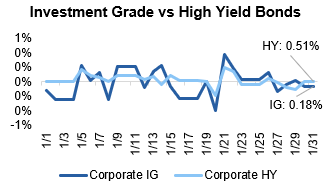
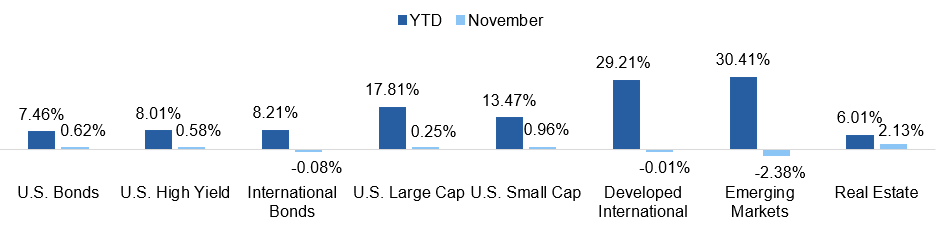
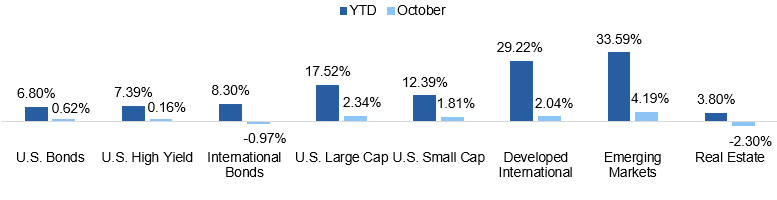
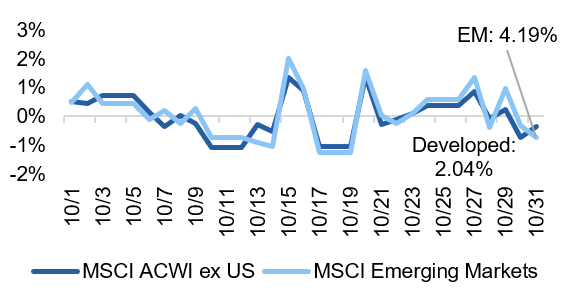
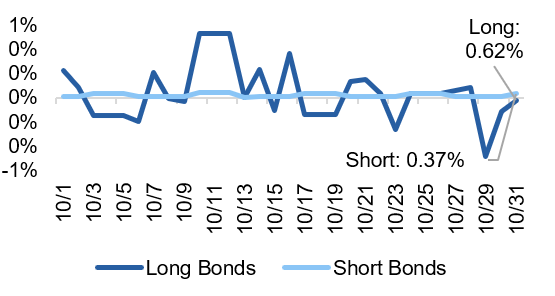
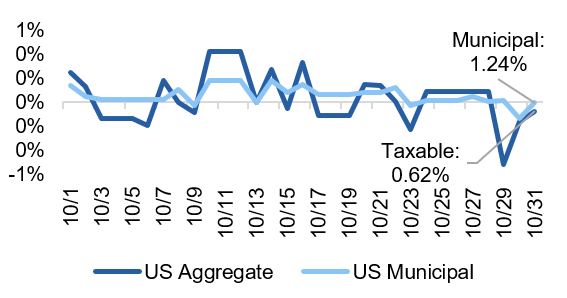
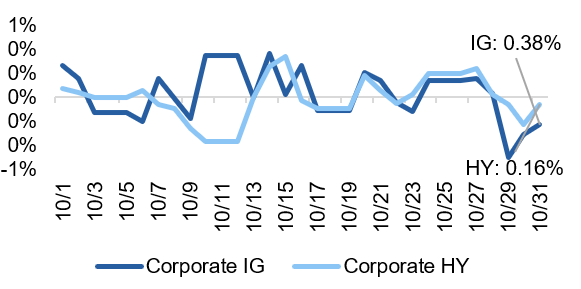
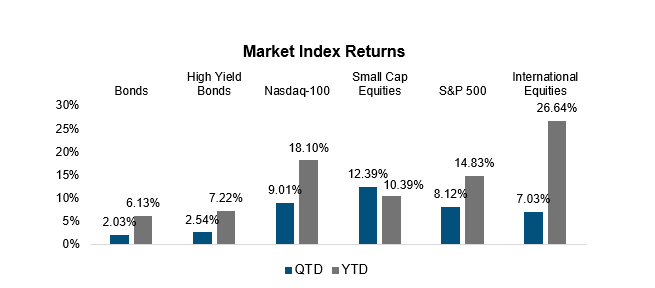
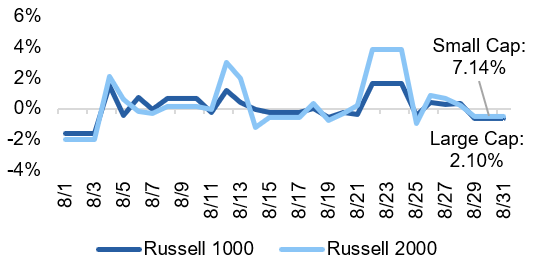
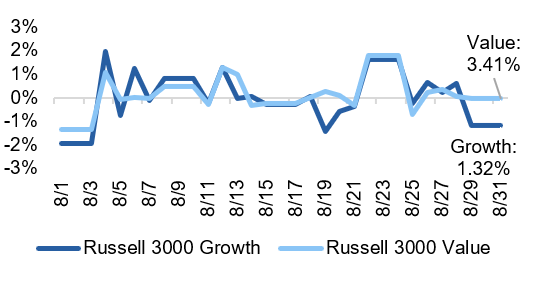
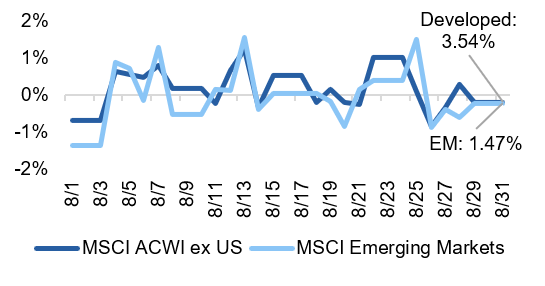
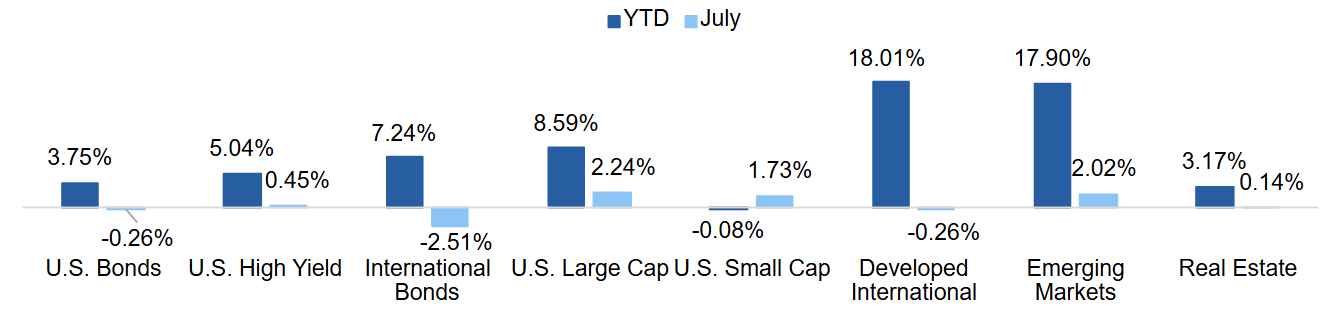
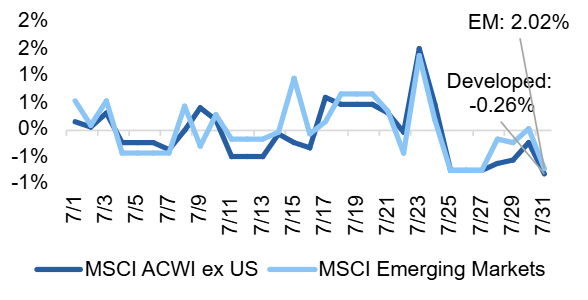
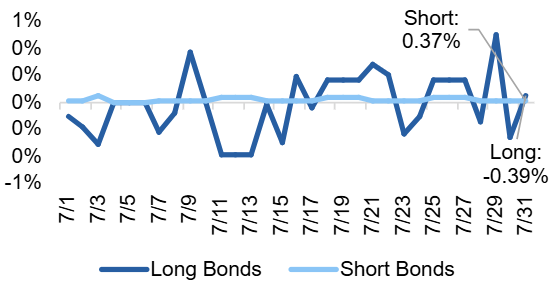
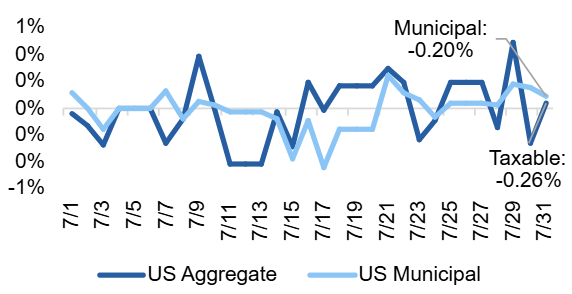
Markets turned positive in April as geopolitical concerns abated. After underperforming in prior months, U.S. equity markets ran at pace with international equity markets in April but continue to underperform on a YTD basis. High yield fixed income markets showed positive performance as spreads tightened over the month.
Source: Source: YCharts. Asset class performance is presented using total returns for an index proxy that best represents the respective broad asset class. U.S. Bonds (Bloomberg U.S. Aggregate Bond TR), U.S. High Yield (Bloomberg U.S. Corporate High Yield TR), International Bonds (Bloomberg Global Aggregate ex-USD TR), U.S. Large Cap (S&P 500 TR), U.S. Small Cap (Russell 2000 TR), Developed International (MSCI ACWI ex US TR), Emerging Markets (MSCI EM TR), and Real Estate (Dow Jones U.S. Real Estate TR).
Markets & Macroeconomics
New Highs in Stocks and at the Pump
In April, global energy markets confronted one of the worst supply shocks on record. The conflict in the Middle East, which is now entering its third month, kept the Strait of Hormuz almost entirely closed, with the U.S. now blocking traffic in an effort to starve off Iran from continued toll-taking and further exports. The chokepoint handles roughly 20% of the world’s oil and LNG trades where approximately 20 million barrels typically transit the waterway daily. The issue is not isolated to Iran, as the conflict with Iran as well as spillover into neighboring countries forced Gulf producers to reduce total output by more than 14 millions barrels per day – totaling an approximately 440 million barrel expected supply loss thus far.
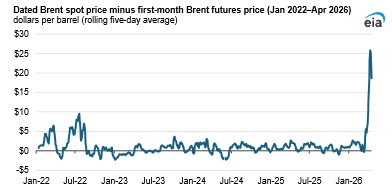
While Brent crude futures peaked at around $120 near the end of April, those derivative contracts did not tell the whole story of the supply squeeze taking place. In the spot market (for those taking physical delivery of oil), actual transaction prices came in around $25 per barrel higher, illustrated in Exhibit 1. The market is pointing to genuine stress in the physical oil market – for context, during the Russian invasion of Ukraine in February 2022, this premium never peaked above $10. And even though the U.S. is now a net energy exporter, they are not fully insulated from the effects of higher energy costs globally.
Gas prices at the pump rose above $4.10 by month-end from $2.80 at the start of the year. The longer oil is not flowing through the Strait, the tighter the pressure on domestic consumption and the greater risk that input costs flow through to corporate margins.
Despite continued conflict and repeated failed attempts at peace talks, markets have looked through the noise and pushed to new highs on the back of a strong start to the 1Q earnings season. While markets are looking through the conflict, one question remains: whether or not the Federal Reserve will as well. The April FOMC meeting saw three governors oppose the inclusion of easing language in the statement. Expectations for PCE inflation have risen; however, importantly, expectations of long-run inflation remain anchored. While the consumer and broader economy have remained resilient, the risk of higher energy costs feeding through to core inflation creates a much more complex task for the expected incoming Fed Chair Kevin Warsh. As of month-end, Warsh has been approved by the Senate Banking Committee and should face a full Senate confirmation vote in May. Markets have historically tested a new Fed Chair, and the current environment appears ripe for history to rhyme once more.
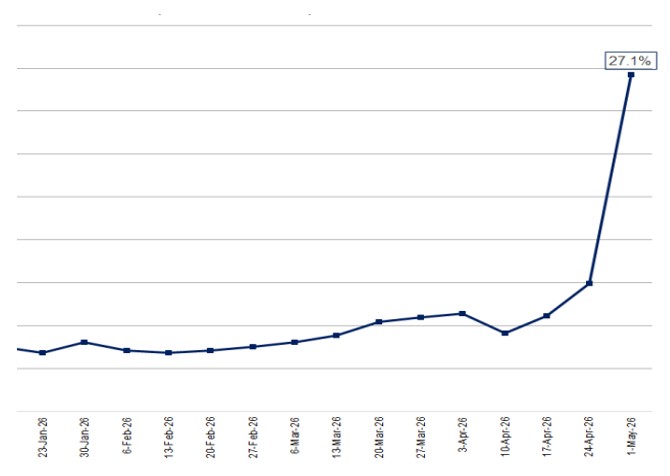
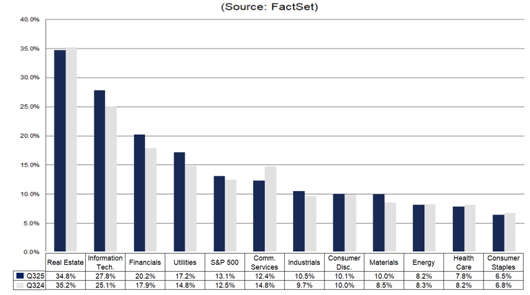
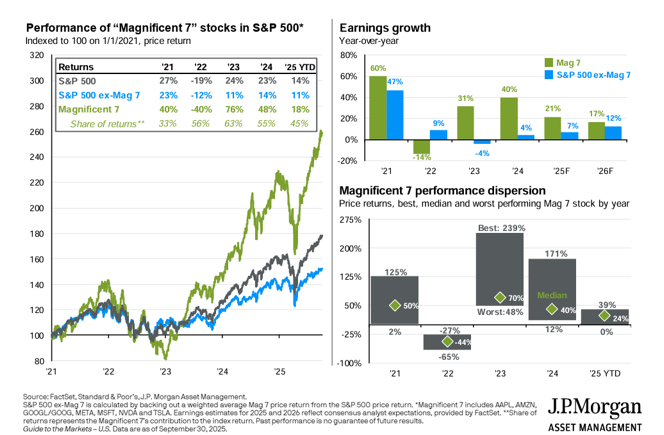
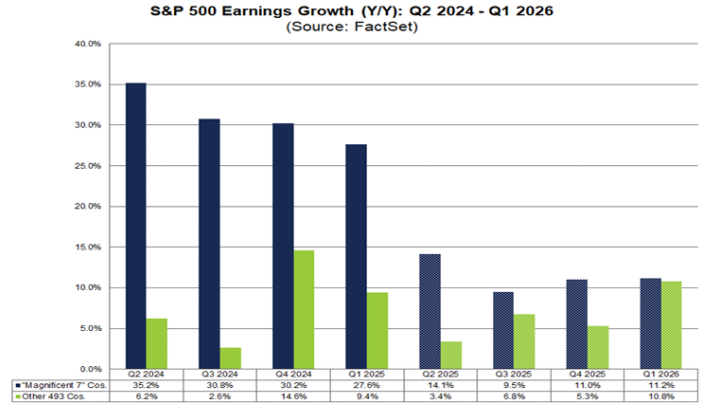
Exhibit 2: 1Q’26 S&P 500 Earnings Growth (YoY)
Source: Source: FactSet, Earnings Insights
The Bottom Line:April delivered a study in contradictions: equity markets climbed to new highs on the back of surging earnings growth, even as the worst oil supply shock since the Russian invasion of Ukraine sent gas prices soaring, reigniting inflation fears. The incoming Fed Chair is set to inherit a divided institution, an unresolved energy crisis, and a market with very little room for disappointment.
Looking Ahead
Navigating the Macroeconomic Fog
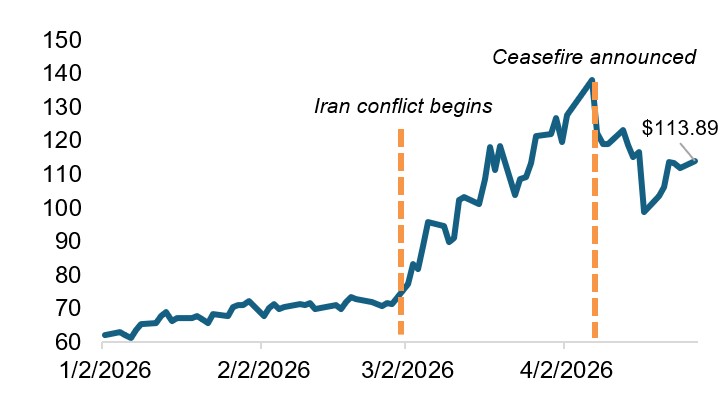
The two forces dominating the outlook heading into May are the same ones that defined April: an oil-driven inflation shock with no clear end date and a Federal Reserve entering a leadership transition at precisely the wrong moment. Together, these forces are creating a policy environment with fewer positive outcomes than markets may be currently pricing in. The Iran conflict that began February 28 has proven more durable than early consensus expected – going on 60+ days – with the Strait of Hormuz still effectively closed and oil prices around $114 to end the month, despite a ceasefire, illustrated in Exhibit 3. This means that the energy shock is no longer a tail risk, but rather a base case. For the U.S. economy, every $10 rise in Brent adds roughly 0.2 to 0.5 percentage points to inflation and shaves 0.1 points off output growth. This stagflationary math is already showing up in the data: core PCE accelerated to 3.2% in March, headline PCE touched 3.5%, and 1Q GDP growth came in at a modest 2.0%, below the 2.2% consensus. Beneath the headline data, the labor market continues to show sluggish growth and the IMF revised 2026 global inflation up to 4.4%. The Fed now faces a classic (and dreaded) dual mandate dilemma: fighting inflation could tip a slowing economy into contraction, but staying on hold could cause inflation expectations to become unanchored from the 2% target.
Exhibit 3:Brent Crude Oil YTD Spot Price ($/bbl)
Source: EIA
Adding to the current environment’s complexity is the Fed’s leadership backdrop. Incoming Chair nominee Kevin Warsh cleared the Senate Banking Committee 13-11 on April 29 and now awaits a full Senate vote. The simultaneous April 29 FOMC decision to hold rates at 3.50-3.75% drew four dissents, the most divided vote since October 1992. As of month-end, markets are pricing a roughly 25% probability of one 25-bps hike over the next 12 months. Investors should expect elevated uncertainty around the Fed’s reaction function and a wider rate-path distribution in the forward-looking environment, particularly as concerns related to Fed independence remain heightened.
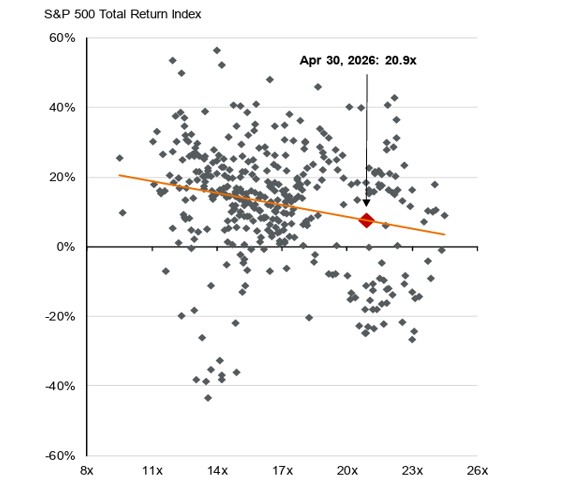
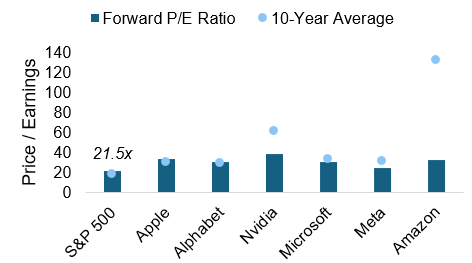
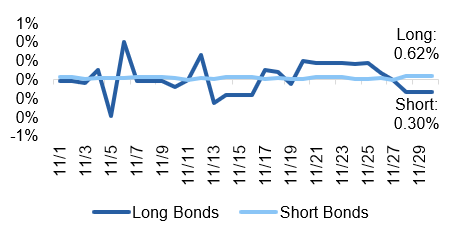
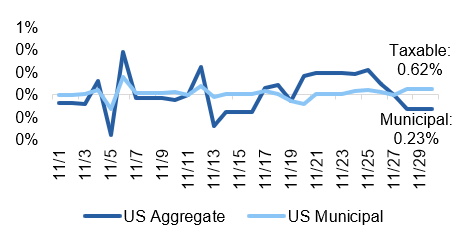
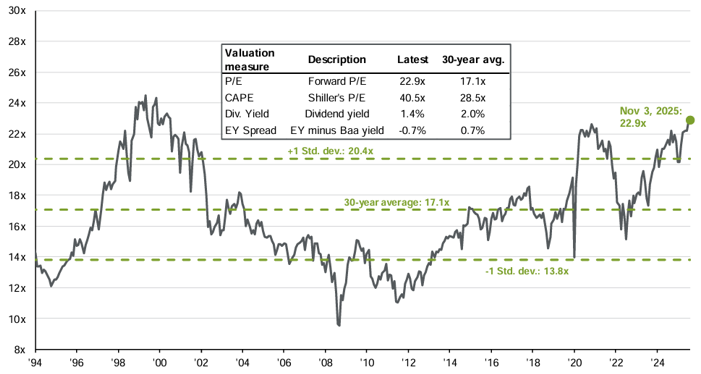
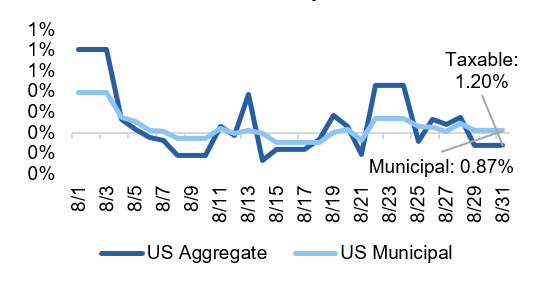
From a positioning standpoint, staying anchored to fundamentals remains crucial rather than trying to call the market top or dramatically reposition portfolios. Equities have recovered impressively from March lows, with the S&P 500 closing the month of April at a fresh all-time high of 7,193. However, this trend reversal means that valuations are once again stretched to historic levels. Historically, higher equity valuations tend to result in lower forward-looking returns, illustrated in Exhibit 4. While earnings growth projections look strong, the full pass-through of higher oil prices to corporate margins has likely not yet occurred. The fixed income market has seen yield curves steepen globally, with better risk-adjusted value in the belly of the U.S. curve and high-quality municipals than long duration sovereigns. Outside of these trends, quality, diversification, and duration discipline continue to be the right tools for the foggy environment ahead.
Exhibit 4: : S&P 500 Forward P/E & 1-Year Returns
Source: JPM Guide to the Markets
The Bottom Line:The Iran conflict and Fed leadership transition have created a policy environment with few obvious answers for how to allocate portfolios. While a recession or a market breakdown is not largely expected, we are watching the duration of the oil shock and global interest rate divergence closely. The next two to three quarters will require patience and discipline as these forces work through the economy, allowing the macro fog to (hopefully) lift.
Capital Markets Themes
What Worked, What Didn’t
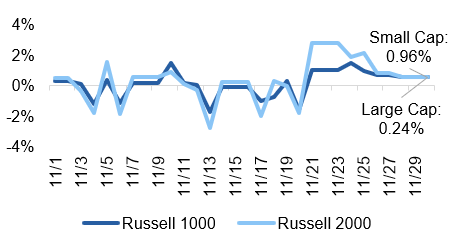
•U.S. Equity Markets Soar Back: U.S. equity markets posted a positive month, with large cap equities soaring to all-time highs and the more attractively valued small cap sector posting over 12% total returns, driven by both sentiment and a strong earnings season.
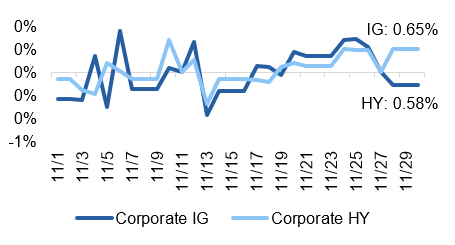
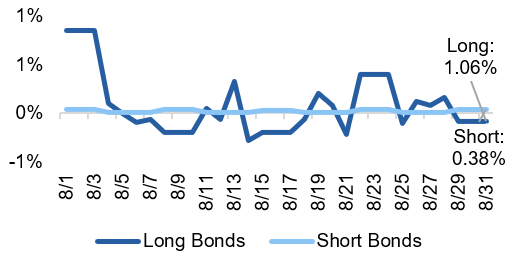
•Spreads Tighten: Credit spreads tightened over the month, prompting close to 2% returns in high yield bonds, another illustration of the return of the “risk on” attitude across markets.
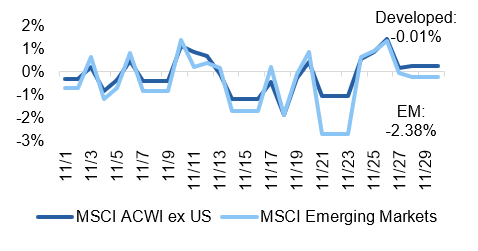
•International Outperformance Continues: International equities returned to their pre-conflict trend of outperformance, strengthened by a weakening dollar and a ceasefire in the Middle East that helped partially reopen the Strait of Hormuz, easing oil prices.
Source: YCharts. Data call-out figures represent total monthly returns.
On Alternatives
Following the Capital, Missing the Returns
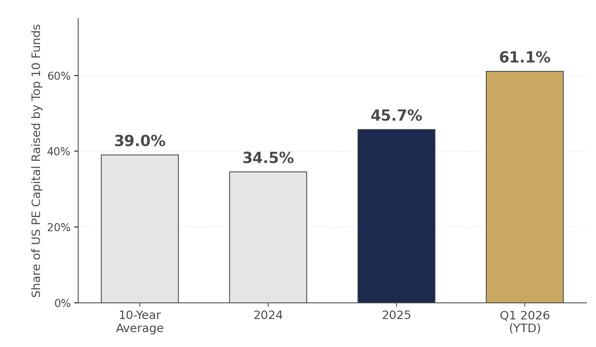
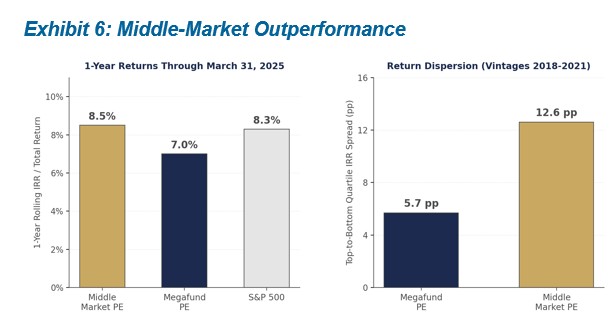
The 10 largest U.S. Private Equity (PE) funds raised in 2025 captured almost half (45.7%) of all PE capital, well above the 10-year average of 39%. Through mid-April 2026, the top 10 funds have captured 61.1% of capital ($60.2B of $98.5B), illustrated in Exhibit 5, though that share will likely moderate as more funds close throughout the year. With this much capital flowing into so-called megafunds, one would assume they would outperform the rest of the PE market, but the data tells a different story. One-year rolling IRR through March 31, 2025 was 8.5% for middle-market managers, narrowly outpacing the S&P 500 at 8.3%, while megafund managers came in at just 7.0%. PitchBook’s research shows the same at the manager level: emerging managers have outperformed established managers across the most recent vintages. Middle-market funds have demonstrated a consistent ability to outperform their larger counterparts over time, yet LP inflows continue to favor scale over performance.
Exhibit 5: Megafund Concentration Surge
Source: PitchBook
Exhibit 6: Middle-Market Outperformance
Source: PitchBook
Why have LP inflows favored megafunds? The answer lies in dispersion of returns. The performance gap between top- and bottom-quartile middle-market managers has run about 12.6% in recent vintages, more than double the 5.7-point spread seen among megafunds, illustrated in Exhibit 6. Middle-market managers offer more upside but realizing that upside requires better manager selection. For most LPs, consolidating with larger, established managers is the more practical path, even if it means giving up some of that upside.
Why are middle-market managers outperforming the megafunds and their nearly unlimited resources? The large-cap space is simply more efficient, leaving less room to drive alpha. In the lower- and middle-market, managers can access niches and deals that megafunds cannot reach due to their size, and their specialized teams can exploit those inefficient pockets. The large buyout space, by contrast, has come to resemble public equity exposure, just with added fees and illiquidity. With so much capital chasing a limited set of large deals, megafunds end up bidding against each other for the same assets, ultimately compressing investor returns.
The Bottom Line: The data shows that the more inefficient corners of the PE market add more value to investor portfolios, but this warrants an emphasis on rigorous manager selection on GPs with a proven ability to drive alpha. While mega PE funds have attracted more capital recently, we prefer to reserve our large-cap equity exposure for the public market, where we receive daily liquidity for a similar return profile.
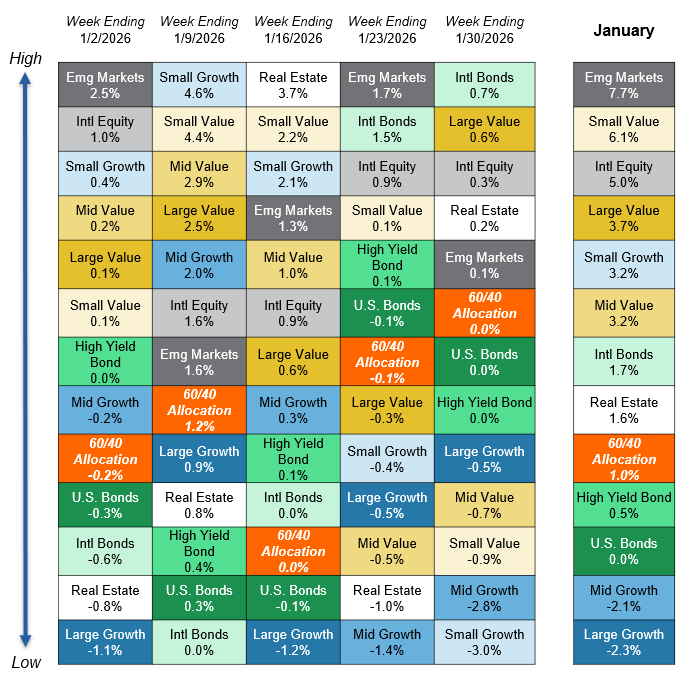
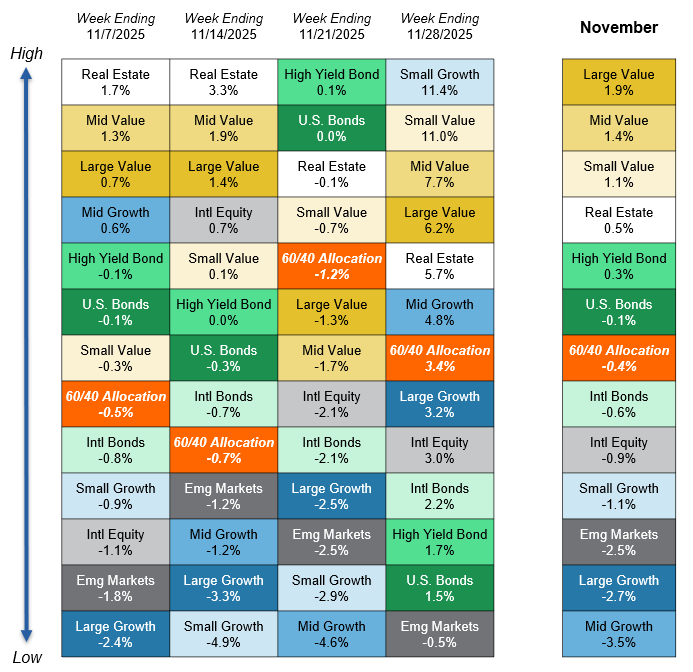
Asset Class Performance Quilt
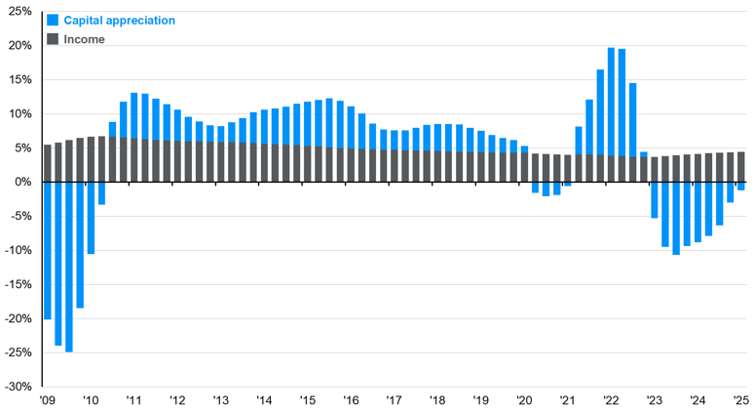
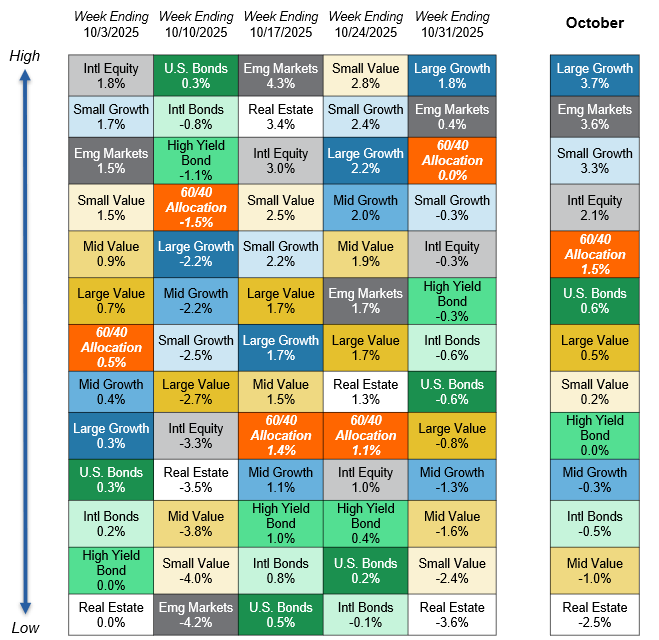
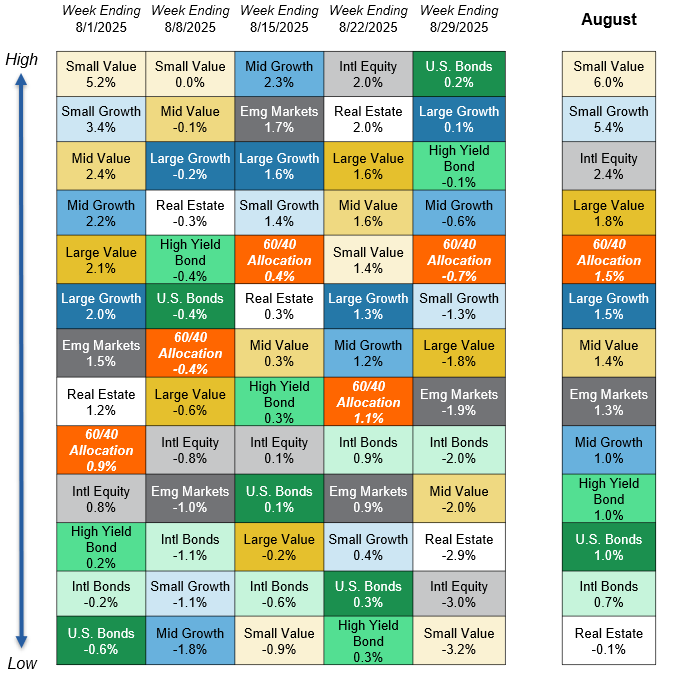
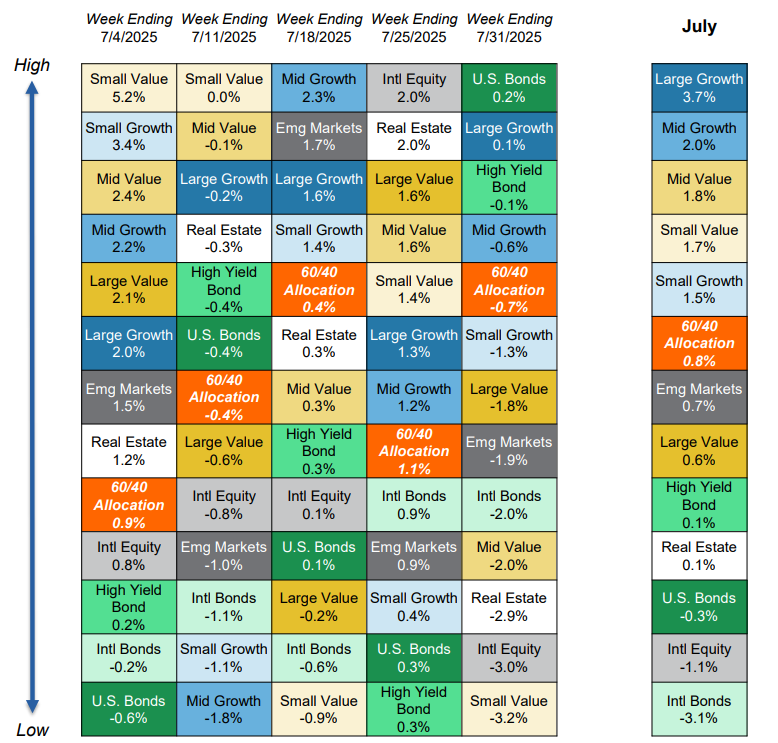
Markets are ever-changing, making diversification across asset classes and sectors a critical component to portfolio construction. As illustrated below, a Balanced 60/40 portfolio provides greater consistency of returns and less volatility over time.
Source: YCharts. Asset class performance is presented using market returns from an exchange-traded fund (ETF) proxy that best represents its respective broad asset class. Returns shown are net of fund fees for and do not necessarily represent performance of specific mutual funds and/or exchange-traded funds recommended by Centura Wealth Advisory. The performance of those funds may be substantially different than the performance of broad asset classes and to proxy ETFs represented here. U.S. Bonds (iShares Core U.S. Aggregate Bond ETF); High Yield Bonds (iShares iBoxx $ High Yield Corp Bond ETF); Intl Bonds (Invesco International Corporate Bond ETF); Large Growth (iShares Russell 1000 Growth ETF); Large Value (iShares Russell 1000 Value ETF); Mid Growth (iShares Russell Mid-Cap Growth ETF); Mid Value (iShares Russell Mid-Cap Value ETF); Small Growth (iShares Russell 2000 Growth ETF); Small Value (iShares Russell 2000 Value ETF); Intl Equity (iShares MSCI ACWI ex US ETF); Emg Markets (iShares MSCI Emerging Markets ETF); and Real Estate (iShares US Real Estate ETF). The return displayed as “60/40 Allocation” is a weighted average of the ETF proxies shown as represented by: 40% U.S. Bonds, 12% International Stock, and 48% Large Blend.
https://centurawealth.com/wp-content/uploads/2024/11/iStock-1816227914.jpg12242448Cailyn Changhttps://centurawealth.com/wp-content/uploads/2024/07/Centura-Logo-White.pngCailyn Chang2026-05-05 10:10:292026-05-05 13:31:34Market Month in Review – April 2026
On February 28, 2026, coordinated U.S. and Israel military strikes on Iran escalated into the effective closure of the Strait of Hormuz – the first time in history this chokepoint has been blocked. Approximately 20% of global oil and LNG supply transits this corridor and its closure caused Brent crude to surge from roughly $80 per barrel to nearly $119 within weeks. This single event has reshaped the investment outlook across every asset class covered in this report and represents the most significant geopolitical supply shock since at least the 1970s, according to the International Energy Agency. The outlook for the conflict remains highly uncertain and how it plays out will define how assets perform for the remainder of the year.
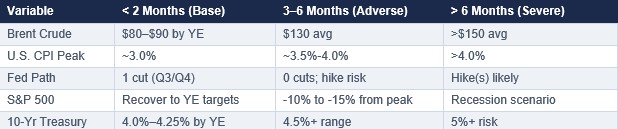
Scenario Framework: Iran Conflict Duration Is the Key Variable
Source: Capital Economics, Goldman Sachs, EY-Parthenon, Charles Schwab, Federal Reserve March 2026 projections, Al Jazeera/Chatham House economic analysis. Oxford Economics Alpine Macro baseline does not expect conflict to extend beyond two months.
Key Cross-Asset Themes in Q1
U.S. Macro: The Iran conflict introduced a stagflationary risk premium not seen since the 1970s oil shocks. Energy-driven inflation is tracking toward 3.5% to 4.0%, while the labor market continues to soften, with volatile monthly reports. GDP growth for 2026 was revised to approximately 2.0%, contingent on a conflict resolution within 2-3 months. Compounding the macro uncertainty, the incoming Fed Chair, Kevin Warsh, has yet to be nominated, creating implications for monetary policy moving forward.
U.S. Fixed Income: The standard safe-haven bid for Treasuries failed as yields rose, not fell, with inflation expectations dominating sentiment. The 10-year Treasury climbed from 3.97% pre-conflict to 4.30% as of quarter-end. At their March 18 FOMC meeting, the Fed held rates unchanged for the second consecutive meeting, with only one cut now projected for 2026. Rate hike risk is non-trivial: the Atlanta Fed shows a ~20% probability of a 25 bps increase. Moving forward, TIPS and short-duration agency MBS are preferred over assets like long-duration Treasuries. The attitude of the Fed will be critical for risk assets. Do they “look through” the price spike associated with the change in oil prices or react?
U.S. Equities: The S&P 500 ended the quarter down approximately 6.5% from its January peak (with daily swings of up to 2%). Over the quarter, defense, energy, and AI adoption beneficiaries outperformed; consumer discretionary, companies displaced by AI (namely, software), and airlines underperformed. History suggests geopolitical-driven drawdowns recover within 12 months if the conflict is contained, but the 2026 EPS estimate of $305–$313 per share remains under revision as the Iran conflict continues.
International Equity: Asia – particularly India, South Korea, and Southeast Asia – is most vulnerable to the energy shock whereas Europe faces moderate spillover. Despite the headwind of the Iran conflict, the structural case for international equities remains intact: valuations remain cheaper than U.S. equivalents, and dollar weakness is likely to resume post-conflict. As the Iran conflict continues, Latin American energy exporters (Brazil, Colombia) and Gulf sovereign equities should benefit.
Private Equity: Near-term dealmaking has stalled as GPs await resolution of the Iran conflict. Defense contractors, domestic energy infrastructure, and AI-integrated portfolio companies are the clear near-term beneficiaries. The structural M&A recovery thesis remains intact: a H2 2026 reacceleration is expected once macro uncertainty clears. Secondaries and continuation vehicles remain the primary liquidity mechanism for legacy 2021–2022 vintage holdings.
Private Debt: A coordinated wave of retail redemptions swept major BDC and interval fund vehicles in Q1, notably forcing gating events at Blackstone (BCRED: $3.8B requested, 7.9% of AUM – injected $400M firm capital), BlackRock (HPS HLEND: $1.2B requested, 9.3% of NAV; $620M approved), Blue Owl (OBDC II permanently frozen), and Cliffwater ($33B fund: 14% of shares requested vs. a 7% cap), in addition to Morgan Stanley, Ares, and Apollo. Two structural risk drivers are converging: AI-driven disruption of SaaS borrowers (~19% of direct loans) eroding creditworthiness and a structural liquidity mismatch in semi-liquid vehicles. Payment in kind (PIK) loan usage and covenant-lite structures are the leading indicators of deeper credit stress. Morgan Stanley projects default rates could reach 8%; UBS warns of up to 13% in a severe scenario.
Real Estate: Rising Treasury yields have deferred cap rate compression and the core real estate recovery with the outlook for the U.S. multifamily sector uncertain as the Iran conflict has disrupted expectations for interest rate cuts in 2026. Data centers and industrial logistics remain secular overweights; office is structurally impaired. The $936B CRE debt maturity wall is generating a growing pipeline of distressed refinancing opportunities for well-capitalized opportunistic investors.
Bottom Line: The conflict in Iran has come at a time when U.S. equity valuations and credit spreads are at all-time highs and tights, respectively, and when the U.S. economy is suffering from stubborn inflation and a weakening labor market. Moving forward, we expect continued volatility and potential downside risks. The outlook for the medium-term (3+ years) remains intact, but the longer oil prices stay elevated, the more that thesis will be challenged.
U.S. Macroeconomic Landscape
Q1 2026 Market Review
The U.S. macroeconomic picture in Q1 2026 was defined by a fragile but resilient economy suddenly confronting a major exogenous shock. The quarter began with GDP momentum on solid ground – Q3 2025 had printed an exceptional 4.3% annualized growth rate – but Q4 2025 slowed sharply to below 1%, reflecting the combined drag from a 43-day government shutdown in October and November, softening consumer spending, and a decelerating labor market. January data confirmed these trends: core PCE inflation rose to 3.1%, above the Fed’s 2% target, while consumer confidence approached recessionary levels. February brought further deterioration: the economy shed an unexpected 92,000 nonfarm payroll jobs, pushing the unemployment rate to 4.4%. This “low-hire, low-fire” equilibrium – where the labor market is too weak to generate jobs but too stable to trigger Fed easing – placed the FOMC in an uncomfortable holding pattern. Then, on February 28, the U.S.-Israel strike on Iran transformed the macro outlook. Brent crude surged above $100 per barrel within days and ended the quarter at around $119/bbl. National average gasoline prices climbed from $2.98/gallon pre-conflict to $4.02/gallon by March 31 – crossing $4.00 for the first time since August 2022 – directly and immediately pressuring consumer purchasing power. The Fed held rates unchanged for the second consecutive meeting on March 18, with Chair Powell acknowledging the “uncertainty” while projecting year-end core PCE at 2.7%.
2026 Forward Outlook
The U.S. macroeconomic outlook for the remainder of 2026 now hinges critically on the duration and intensity of the Iran conflict. The pre-war base case – GDP growth of 2.0%–2.6%, gradual Fed easing to 3.0%–3.25%, and core PCE declining toward 2% by year-end – has been materially revised across most institutional forecasters.
The inflation path has worsened significantly. Before the Iran strikes, core PCE was running at 3.1% and headline CPI was at 2.4%. Higher energy costs now threaten to push headline inflation to 3.5%–4.0% in the near term, with potential second-round effects on food, transportation, and utilities. CNBC quotes economists warning of “a familiar but uncomfortable dilemma,” alluding to an energy shock generating inflation alongside a slowing labor market. J.P. Morgan notes that “there’s never a good time for an adverse supply shock, but ideally the starting point would be low and stable inflation,” a precondition that clearly did not exist entering the conflict. The CBO had already projected PCE inflation at 2.7% for 2026 before the conflict, above the Fed’s pre-conflict estimates.
The stagflation risk – rising inflation alongside slowing growth – is the dominant macro concern. Federal Reserve officials, including Powell, have pushed back against the “stagflation” label, arguing that the 1970s comparison requires double-digit unemployment and inflation that does not apply today. However, the structural parallels are uncomfortable: an oil shock in an environment of above-target inflation, weakening employment, and politically constrained monetary policy. The Atlanta Fed’s probability tracker shows a nearly 20% probability of a rate hike this year – a scenario that would have been broadly inconceivable three months ago.
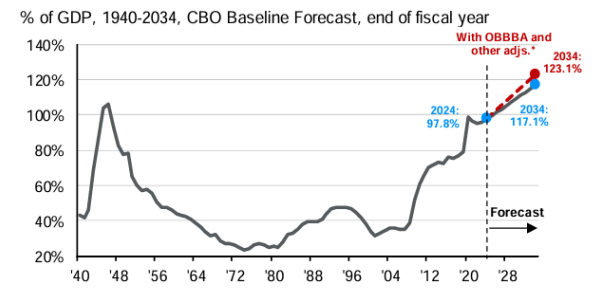
The One Big Beautiful Bill Act’s (OBBBA) fiscal stimulus, including an estimated $150 billion in consumer tax refunds flowing in Q1–Q2 2026 and full equipment expensing benefits, provides a partial offset, supporting consumer spending and business investment in the near term. However, the CBO’s warning of $3.4 trillion in added deficits over 10 years remains a structural constraint, and rising defense spending from the Iran conflict will widen this deficit further, potentially exerting upward pressure on long-term Treasury yields.
Lastly, the May 15 Fed Chair transition remains a significant institutional wildcard, particularly as Kevin Warsh’s nomination remains stalled in the Senate. If Powell departs without a confirmed successor, markets face an extended period of leadership uncertainty at the FOMC during one of the most complex monetary policy environments in decades. Powell has stated he has “no intention” of leaving voluntarily until a related investigation is resolved and his successor is confirmed.
Bottom Line: The most likely base case is that the conflict proves shorter than feared, oil retreats toward $80–$90 per barrel by H2 2026, the Fed delivers one 25-basis-point cut in Q3, and GDP growth lands near 2.0% for the full year. But the tail risks, particularly a prolonged Strait of Hormuz closure, are more severe today than at any point since 2020 and the 2008 financial crisis.
U.S. Equity Markets
Q1 2026 Market Review
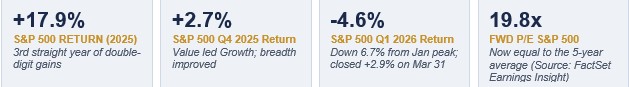
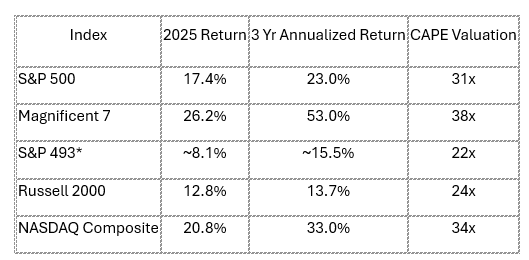
U.S. equity markets entered Q1 2026 with considerable momentum following the S&P 500’s strong 2025 close, where the index gained 17.9% for the year and posted its third consecutive year of double-digit returns. Q4 2025 closed with notable leadership rotation: value outperformed growth; cyclical sectors, including financials, industrials, and healthcare led; and Magnificent 7 correlations fractured for the first time in the cycle. Small caps, as measured by the Russell 2000, were up 2.2% in Q4, finally beginning to perk up on improving macro expectations. January 2026 extended this momentum, supported by strong Q4 earnings releases and fiscal stimulus optimism from the OBBBA. However, the quarter was violently interrupted on February 28, when joint U.S.-Israeli military strikes on Iran triggered retaliatory attacks across the Gulf and the closure of the Strait of Hormuz. The S&P 500 finished the quarter down 4.6%, led by the energy sector while consumer discretionary and technology faced pressure from rising oil prices compressing consumer purchasing power. Equity markets swung sharply in March as conflict headlines drove outsized daily moves – falling as much as 1.7% on March 26 before surging 2.9% on March 31 to close out the quarter. Healthcare and defense-related names outperformed as AI capex narratives gave way to geopolitical risk-premium repricing. The more economically sensitive small- and mid-cap market reversed its outperformance and underperformed their large cap peers.
2026 Forward Outlook
The U.S. equity outlook for the remainder of 2026 has bifurcated sharply: the base case before February 28 (continued AI-driven earnings growth, multiple expansion, broadening leadership) must now be weighed against a scenario where elevated oil prices compress consumer spending, reignite inflation, and complicate the Fed’s easing path.
The Iran conflict has introduced a stagflationary risk premium into equity valuations that was absent entering the year. Morgan Stanley notes that markets have historically posted double-digit gains three and six months after the onset of major conflicts, but this historical pattern is conditioned on conflicts being contained and energy disruption temporary.
For corporate earnings, the consensus S&P 500 EPS estimate for 2026 of $305–$313 is actively under review. Energy companies and defense contractors benefit directly from the Iran conflict and increases in defense spending could drive multiyear demand for aerospace, drone, satellite, and missile defense technologies, a structural shift that could outlast the immediate conflict. Conversely, consumer discretionary, airlines, shipping, and energy-intensive industrials face near-term margin pressure.
History counsels patience. In 20 major military conflicts since World War II, the average market recovery following the initial geopolitical shock has been positive within 12 months. Investors who exit during geopolitical downturns typically miss the recovery, supporting the notion that portfolios constructed with appropriate diversification should remain in place. The key tactical pivot is from broad market beta to sector-specific positioning: overweight defense, energy infrastructure, TIPS-linked assets, and AI adoption beneficiaries with pricing power. Investors can also consider going underweight consumer discretionary, airlines, and yield-sensitive sectors where the combination of higher rates and higher energy costs creates a dual squeeze. Mid- and small-cap exposure may face near-term headwinds as higher-for-longer rates bite on financing costs and higher energy prices impact margins.
Bottom Line: The conflict in Iran has come at a challenging time for the U.S. equity sector, with stretched valuations, a stalled rate-cutting cycle, and a weak labor market. We would expect substantial sector rotation as the market tries to find safe havens against the geopolitical turmoil causing the indices to gyrate substantially.
International Equities
Q1 2026 Market Review
International equity markets carried extraordinary momentum into Q1 2026 following the most decisive year of outperformance versus U.S. equities in over a decade. The MSCI EAFE returned 31.9% in 2025 and the MSCI EM returned 34.4% in USD terms – roughly double the S&P 500’s 17.9% – with approximately 10 percentage points of the EAFE return attributable to U.S. dollar weakness. The MSCI EM Index opened 2026 with approximately 7% gains through early February, clearing major resistance at its 2021 highs, with broad participation (over two-thirds of constituents trading above their 200-day moving averages). European equities extended gains through January on German fiscal stimulus optimism. This constructive picture was disrupted materially when U.S. and Israeli forces struck Iran on February 28. Asia appears most vulnerable to the energy supply shock given its dependence on Persian Gulf oil and LNG imports, while Europe faces meaningful exposure through energy price pass-through and slowing growth. The near-term dollar appreciation impulse – historically a headwind for international equity returns for USD-based investors – has arrested the dollar’s decline, at least temporarily, removing one of the key 2025 tailwinds for international equities.
2026 Forward Outlook
The Iran conflict has introduced the most significant near-term headwind to international equity performance since the 2022 Russia-Ukraine crisis, but the structural case for an international allocation remains compelling, and, in some respects, is strengthened by the conflict’s dynamics.
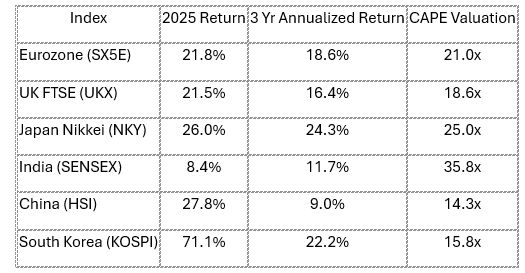
The divergence in vulnerability is stark. Asia, particularly India, South Korea, Japan, and Southeast Asian manufacturing economies, faces the most acute near-term pressure from higher energy import costs. India, with thin foreign exchange reserves and heavy Middle Eastern crude dependence, faces elevated vulnerability to prolonged disruption, with higher energy costs feeding inflation and weakening the rupee. South Korea, home to Samsung and other global technology players, faces energy cost pressure on semiconductor manufacturing. Wheat prices have also risen, with food-importing countries facing acute stress from the conflict’s agricultural disruption.
Europe’s exposure is meaningful but more manageable. Chatham House estimates that if the conflict is contained, European inflation in 2026 would be approximately 0.5 percentage points higher than pre-conflict forecasts. A more severe scenario – oil at $130 per barrel – could push Eurozone inflation to over 4% year-over-year, potentially forcing the ECB to raise rates and causing the Eurozone economy to contract in Q2. Germany’s fiscal stimulus, however, remains a powerful structural support for European equities, and the MSCI EAFE’s high cyclical weighting (60% in Financials, Industrials, Materials, and Consumer Discretionary) provides exposure to sectors that can absorb energy cost increases through pricing power.
Despite near-term headwinds, the structural bull case for international equities remains intact. Valuations are still significantly cheaper than U.S. equivalents even after 2025’s strong run. The dollar’s longer-term downtrend, driven by geopolitical fracturing and a shift away from dollar-denominated assets, may actually be reinforced by the unilateral nature of the U.S. decision to strike Iran. Dollar weakness will likely resume once hostilities subside, providing a renewed tailwind for international equity returns.
Emerging markets require the most careful differentiation. Energy exporters – Gulf states, Brazil, Colombia, Nigeria – benefit directly from higher oil prices. Latin America, particularly Brazil and Mexico, remains a high-conviction overweight on outsized monetary policy stimulus, supply chain reconfiguration, and oil export revenue. China, despite modest 2026 growth headwinds from higher energy costs, is relatively insulated given its massive renewable energy investments, diversified hydrocarbon suppliers, and strategic petroleum reserves. In fact, some Chinese analysts see the war as a net positive for China’s competitive position.
Bottom Line: While in the short-term, overseas markets are vulnerable to the impact of higher energy prices, there will be winners and losers in that space depending on the oil reliance coming from the Strait of Hormuz. On the assumption that the conflict will end, we expect this to accelerate the shift out of U.S. equity markets and U.S. dollars into overseas markets where valuations are more supportive.
U.S. Fixed Income
Q1 2026 Market Review
Q1 2026 opened with fixed income markets navigating a complex cross-current of moderating inflation, a cautious Federal Reserve, and – most disruptively – the outbreak of the U.S.-Israel military conflict with Iran on February 28, 2026. The quarter began with the Bloomberg U.S. Aggregate enjoying tailwinds from the Fed’s Q4 2025 rate cuts (which brought the federal funds rate to 3.50%–3.75%) and investor optimism around a gradual easing cycle. The 10-year Treasury yield briefly traded as low as 3.93% in late February, reflecting a rally driven by soft economic data, weakening consumer confidence, and falling oil prices. That dynamic reversed sharply when U.S. and Israeli forces launched strikes on Iran, closing the Strait of Hormuz. The 10-year Treasury yield climbed from 3.96% to as high as 4.4% in March, defying the typical safe-haven bid for Treasuries. The Fed held rates unchanged at its March 17–18 FOMC meeting, their second consecutive hold, as policymakers weighed oil-driven inflation risks against a softening labor market that shed 92,000 payroll jobs in February.
2026 Forward Outlook
The remainder of 2026 presents one of the most complex fixed income environments in years, with the Iran conflict reshaping nearly every element of the rate, inflation, and credit outlook. The direction of oil prices – and the duration of Strait of Hormuz disruption – is now the single most important variable for fixed income investors, outshining the previous concerns of a weakening labor market and stubborn inflation.
The Iran conflict has materially complicated the Fed’s policy path. Before the February 28 strikes, consensus forecasted two 25-basis-point cuts in 2026. The Atlanta Fed’s Market Probability Tracker has shown a nearly 20% probability of a rate hike, a sharp contrast to the December 2025 “Dot Plot.” Some economists project Brent crude averaging $150 per barrel over the next six months if the conflict lasts three months, which would push headline PCE inflation well above 3% and force the Fed’s hand to hike rates. The OECD recently raised the inflation outlook for the U.S. to 4.2%, illustrating the potential for rising prices as a result of the conflict. The Fed’s updated March projections forecast year-end core PCE at 2.7%, with Chair Powell acknowledging that “nobody knows” the full economic impact and signaling the central bank will act as needed. Powell’s term ends May 15, and Kevin Warsh’s nomination to succeed him remains stalled in the Senate amid a Justice Department probe, adding a layer of institutional uncertainty.
Investment grade credit faces elevated spread risk. Prior to the conflict, IG spreads were near multi-decade tights of 80 basis points with little cushion. AI infrastructure issuance, which dominated 2025 supply, will continue to absorb market capacity, but rising uncertainty and potential economic slowdown from the oil shock may trigger spread widening in lower-rated IG names.
Agency MBS retains its most-favored status within core fixed income. Spread levels relative to IG corporates remain attractive, and the asset class benefits from its relative insulation from energy-driven credit risk. The technical backdrop – supplementary leverage ratio (SLR) regulatory relief and the end of QT – remains intact.
USD EM debt faces headwinds from the Iran conflict. While EM fundamentals remain broadly sound, higher oil import costs are pressuring India, South Korea, and other net importers, illustrating the outsized impact of the oil disruption on Asian economies.
Bottom Line: U.S. fixed income returns will be a function of whether the market sees the inflationary pulse coming from higher oil prices as temporary or more permanent. Against the backdrop of a weakening labor market, the Fed will be forced to pick between looking through the inflationary surge or increasing rates and slowing the economy further. All eyes will be on Warsh and how he is interpreting the data.
Private Equity
Q1 2026 Market Review
Private equity entered Q1 2026 with genuine momentum after a rocky 2025. Total deal value reached $1.2 trillion across 9,000+ transactions in 2025 – only the second time on record above $1 trillion – with exit activity recovering strongly to $682 billion, the best since 2021. The H2 2025 acceleration, driven by macro clarity and Fed rate cuts, carried into January 2026 with sponsor confidence returning, financing costs lower, and bid-ask spreads narrowing on quality assets. The Fed’s three 2025 rate cuts had reduced the average cost of PE middle market term loans by approximately 300 basis points from cycle peaks, directly improving LBO return profiles. However, the Iran conflict outbreak on February 28 introduced a new source of macro uncertainty that has caused GPs to pause M&A processes and limited partners to reassess portfolio exposure. Deal processes underway at quarter-end have been paused or extended as buyers wait for clarity on the conflict’s economic duration. The disruption echoes the Q2 2025 tariff-induced lull, suggesting that H1 2026 deal momentum may disappoint with recovery a function of the outlook on the conflict. Fundraising remains a structural challenge: global PE capital raised fell 11% in 2025 for the second consecutive annual decline, with LPs withholding commitments pending improved distribution metrics.
2026 Forward Outlook
Private equity’s 2026 outlook has been complicated by the Iran conflict but the structural cycle recovery remains intact, with activity expected to rebound once geopolitical uncertainty clears.
The most immediate impact of the Iran conflict on PE is the re-widening of bid-ask spreads and the deferral of exit processes. Rising rate expectations following the Fed’s hawkish hold at the March meeting reduce the DCF-driven uplift to asset valuations that had been building since late 2024. For leveraged buyouts specifically, any reversal of the rate-cut path meaningfully dampens return assumptions, since PE’s carried interest economics are highly sensitive to the entry and exit multiple gap. Morgan Stanley estimates that the cost of PE middle market financing has declined 300 basis points from cycle peaks, but the Iran conflict risks narrowing this advantage if rates stay higher for longer.
The Iran conflict also creates sector-specific opportunities. Defense, aerospace, and energy infrastructure are receiving increased government spending that could drive multiyear demand – exactly the type of predictable, contracted revenue stream that PE platforms prize. Energy infrastructure (pipelines, LNG terminals, grid modernization) and digital infrastructure (data centers, power generation) remain high-conviction deployment themes, and the conflict arguably accelerates both: the Strait of Hormuz closure has renewed calls for energy diversification and domestic production, while defense budgets across NATO are being revised upward.
The secondaries market and continuation vehicles (CVs) remain critical tools for portfolio management in 2026. LPs are increasingly using secondaries for liquidity (due to the explosive growth over “evergreen” funds) and portfolio rebalancing rather than as a last resort, and GPs are using CVs to manage legacy 2021–2022 vintage positions that remain below acquisition cost. Dry powder, while declining from record levels, remains ample to fund large buyouts once clarity surrounding the macro picture returns. The key milestones to monitor are, once again, the duration of the Iran conflict, the Fed’s June meeting for interest rate insights, and Q2 earnings season, which will reveal the extent of energy cost pass-through to PE portfolio company margins.
Bottom Line: PE remains an attractive asset class, however the excess returns generated over public equity may be more muted than in previous decades. Higher borrowing costs, an increase in the number of managers, and more price transparency mean that being selective in choosing your manager is more important than ever.
Private Debt
Q1 2026 Market Review
Private debt markets entered Q1 2026 facing their most significant liquidity test since the asset class became a dominant source of non-bank financing. What began as isolated fraud-driven failures in 2025 with First Brands and Tricolor in the U.S. auto parts sector cascaded into a broad reassessment of BDC and interval fund structures as retail investors sought exits. The wave of gating events in Q1 was unprecedented in scale: Blackstone’s BCRED faced $3.8B in requests (7.9% of its $82.5B AUM) and injected $400M of firm capital to avoid formal gating; BlackRock’s HPS Corporate Lending Fund (HLEND) received $1.2B in withdrawal requests (9.3% of NAV) – its first-ever redemption breach – approving only $620M; Blue Owl permanently froze OBDC II; Cliffwater’s $33B flagship fund received requests for 14% of shares, double its 7% regulatory maximum quarterly cap; and more asset managers followed. Beneath the liquidity headlines, two structural fault lines are widening: first, AI-driven disruption of SaaS and enterprise software borrowers – approximately 19% of total direct loans and 15–17% of BDC portfolios by deal count – is eroding cash flows and threatening the revenue models underpinning loan valuations; second, covenant erosion through covenant-lite structures and escalating PIK usage – approximately 10% of BDC interest income now accrues as PIK rather than cash, a measurable proxy for shadow credit stress. The Iran conflict added a third layer: higher energy costs increase operating expenses for borrowers, higher-for-longer rates intensify refinancing pressure on 2020–2021 vintage floating-rate debt, and resurgent inflation threatens the collateral values underpinning loan marks.
2026 Forward Outlook
The 2026 outlook for private debt is defined by two compounding risk streams that will fundamentally differentiate returns across managers and vintages. On credit quality: AI disruption is systematically eroding the revenue models of SaaS and enterprise software borrowers – the single largest borrower category in direct lending at approximately 19% of outstanding loans. Software stocks fell ~30% between October 2025 and February 2026 with roughly 15% of SaaS borrowers struggling to cover interest expenses. Morgan Stanley projects direct lending defaults could reach 8%; UBS warns of 13% in a severe AI disruption scenario. However, both agree this would reprice, not break, the asset class given its distributed structure and superior bank capitalization versus 2008.
On structure and liquidity: covenant-lite terms have compressed workout timelines and the first observable signal of borrower distress is now often a missed payment rather than a covenant breach. 23 of 32 rated BDCs face $12.7B in unsecured debt maturities in 2026 – a 73% increase over 2025 – creating a compounding refinancing wall. The opacity of private credit valuations is a structural liability: managers who mark their own assets delay stress recognition, creating conditions for sudden gaps when secondary market transactions or forced sales reveal true pricing. Widening credit spreads and higher bank collateral charges are raising effective back-leverage costs and compressing net returns. The Q1 gating events at Blackstone, BlackRock, Blue Owl, Cliffwater, Ares, and Apollo have exposed a fundamental structural tension: retail capital expecting quarterly redemption access is mismatched with assets requiring months or years to liquidate at fair value. We favor senior secured, hard-covenant structures with documented workout capabilities and limited software sector concentration and intend to avoid covenant-lite legacy vintages from 2020–2022.
Bottom Line: Private debt as an asset class is here to stay however they are not immune to the stresses causing their publicly traded peer’s spreads to widen. We expect a continued tough ride for the near term – not just because of liquidity issues but also because the economic fundamentals are changing.
Real Estate Markets
Q1 2026 Market Review
Real estate markets entered Q1 2026 with cautious optimism – valuations had stabilized after two years of cap rate expansion and transaction volumes were recovering (up 25% year-over-year in Q3 2025). The $936 billion CRE debt maturity wall arrived in earnest in Q1, with a wave of commercial real estate loans requiring refinancing in an environment where interest rates remained elevated and cap rates had not compressed sufficiently to generate equity value. Office properties – impaired structurally by remote work trends – and hospitality assets are facing the softest transaction markets. Industrial and multifamily assets maintained the strongest fundamentals, supported by persistent housing supply constraints and e-commerce demand. The Iran conflict added new complexity: surging energy costs directly affect real estate operating expenses (utilities, HVAC), rising long-term Treasury yields push up commercial mortgage rates, and increased macro uncertainty has deferred transaction decisions from buyers who had been poised to re-enter the market.
2026 Forward Outlook
Real estate’s path for the remainder of 2026 is now shaped by three competing forces: the structural recovery driven by supply discipline and stabilizing valuations; the $936 billion debt maturity wall creating forced transaction activity; and the Iran conflict’s impact on rates, energy costs, and investor risk appetite.
The Iran conflict introduces a specific set of real estate dynamics. Higher energy costs increase operating expenses, particularly for industrial and office properties with high utility consumption. Rising long-term Treasury yields directly increase commercial mortgage rates and cap rate expansion pressure, delaying the cap rate compression necessary for core real estate revaluation.
Data centers represent the most compelling secular growth story in real estate and are directly reinforced by the Iran conflict: the energy security focus accelerates domestic power generation investment, while AI infrastructure demand, which was already driving unprecedented data center development, remains undiminished by geopolitical events. Industrial and logistics real estate maintains strong fundamentals. New construction remains muted across property types, supporting occupancy and rent growth. Supply chain reconfiguration away from the Strait of Hormuz has increased demand for domestic warehousing and logistics infrastructure, a direct near-term tailwind. The outlook for multifamily is likely a mixed bag: housing supply constraints remain acute and affordability pressures prevent many renters from transitioning to homeownership. Office remains a challenged sector of the real estate market as work-from-home structural trends are entrenched. Additionally, the Iran conflict’s uncertainty may further defer corporate real estate decision-making. Hospitality faces a compound headwind: surging jet fuel costs are driving airline ticket prices sharply higher (Gulf carriers are operating under major airspace restrictions), dampening business and leisure travel demand.
The base case for core real estate returns in 2026 is low-single-digit total returns with capital appreciation remaining negative or flat. Value-add and opportunistic strategies targeting distressed debt and repriced assets offer the most compelling risk-adjusted entry in the current cycle.
Bottom Line: Real estate may have a challenging year ahead but given the ebb and flow of supply it is setting the stage for future growth a few years out. In this environment, it makes sense to keep powder dry and consider distressed or opportunistic assets.
DISCLOSURES
The information provided is for educational and informational purposes only and does not constitute investment advice and it should not be relied on as such. It should not be considered a solicitation to buy or an offer to sell a security. It does not take into account any investor’s particular investment objectives, strategies, tax status or investment horizon. You should consult your attorney or tax advisor.
The views expressed in this commentary are subject to change based on the market and other conditions. These documents may contain certain statements that may be deemed forward-looking statements. Please note that any such statements are not guarantees of any future performance and actual results or developments may differ materially from those projected. Any projections, market outlooks, or estimates are based upon certain assumptions and should not be construed as indicative of actual events that will occur. All information has been obtained from sources believed to be reliable, but its accuracy is not guaranteed. There is no representation or warranty as to the current accuracy, reliability, or completeness of, nor liability for, decisions based on such information and it should not be relied on as such.
Centura Wealth Advisory is a registered investment advisor. Advisory services are only offered to clients or prospective clients where Centura Wealth Advisory and its representatives are properly licensed or exempt from licensure. 12255 El Camino Real, St. 125, San Diego, CA 92130.
https://centurawealth.com/wp-content/uploads/2024/10/iStock-1699822168-scaled-1.jpg11592560Cailyn Changhttps://centurawealth.com/wp-content/uploads/2024/07/Centura-Logo-White.pngCailyn Chang2026-04-08 10:46:212026-04-08 16:27:35Q1 2026 Market Wrap: The Oil Shock: Reassessing the Outlook for Growth, Inflation, and Capital Markets
Macro Indicators: The economic backdrop remains solid but is getting bumpier. Inflation remains stubbornly above the Fed’s 2% target and chaotic tariff policy is only adding fuel to that fire. Growth is slowing, with GDP decelerating from 2.8% in 2024 to 2.2% in 2025, and Q4 coming in at a soft 1.4%. Meanwhile, the labor market is quietly losing steam, with unemployment hitting 4.3% in January as AI-driven job cuts move from headline risk to reality.
Trump 2.0: The Supreme Court dealt the Administration a legal blow, ruling its IEEPA tariffs unconstitutional, but the White House pivoted fast, slapping a 10% tariff back on under a different law (Section 122 of the Trade Act of 1974). The clock is now ticking as Congress has 150 days to approve an extension of the tariffs, setting up a high-stakes vote in the middle of re-election season. On the geopolitical front, a joint U.S.-Israel military operation in Iran resulted in the assassination of Iran’s Supreme Leader, sending geopolitical risk sharply higher and putting global markets on edge to end the month.
Fed & Monetary Policy: Rates are expected to stay on hold through the end of Chair Powell’s tenure. His likely successor, Kevin Warsh, is expected to come in with a rate-cutting bias and a desire to slim down the Fed’s balance sheet, but the macro data may threaten these plans.
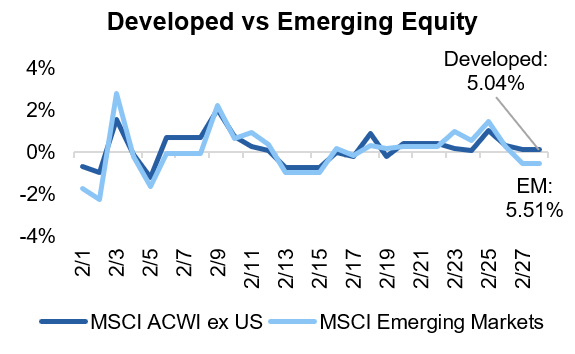
Capital Markets: February was a rough month for U.S. stocks, which saw broad declines, with investors quietly rotating out of last year’s darlings (tech and financials) and into energy and materials. Meanwhile, international equities kept outpacing domestic ones, with emerging markets standing out as a particularly attractive pocket of value. On the fixed income side, yields held relatively steady and credit spreads remain tight by historical standards.
Asset Class Performance
U.S. large cap equities posted negative returns in February as AI pressures prompted sell-offs in the technology and financials sectors. Longer-term Treasury yields declined over the month, contributing to positive total returns. International equities continued their run-up, driven by Asian markets.
Source: YCharts. Asset class performance is presented using total returns for an index proxy that best represents the respective broad asset class. U.S. Bonds (Bloomberg U.S. Aggregate Bond TR), U.S. High Yield (Bloomberg U.S. Corporate High Yield TR), International Bonds (Bloomberg Global Aggregate ex-USD TR), U.S. Large Cap (S&P 500 TR), U.S. Small Cap (Russell 2000 TR), Developed International (MSCI ACWI ex US TR), Emerging Markets (MSCI EM TR), and Real Estate (Dow Jones U.S. Real Estate TR).
Markets & Macroeconomics
A Lot to Digest
One year into President Trump’s second term and markets have been taken on a wild ride, and February was no exception. The Supreme Court struck down IEEPA tariffs, but the White House didn’t skip a beat: a new 10% tariff was back in place almost immediately, this time under a different law (Section 122 of the Trade Act of 1974). The message? Tariffs aren’t going anywhere. The catch? Section 122 tariffs expire after 150 days unless Congress votes to extend them. That vote lands in mid-July – right in the middle of re-election season, with midterms in November. Expect politics to get very tangled with policy as we progress through the year.
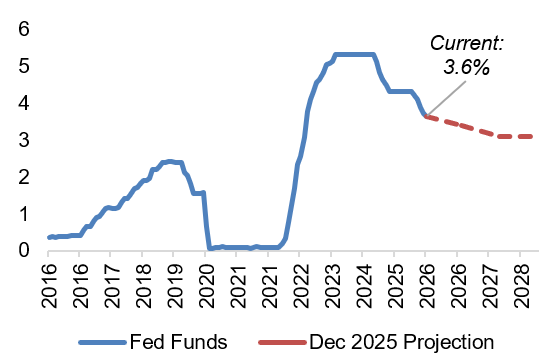
Exhibit 1: Effective Federal Funds Rate
Sources: FRED, Federal Reserve Board
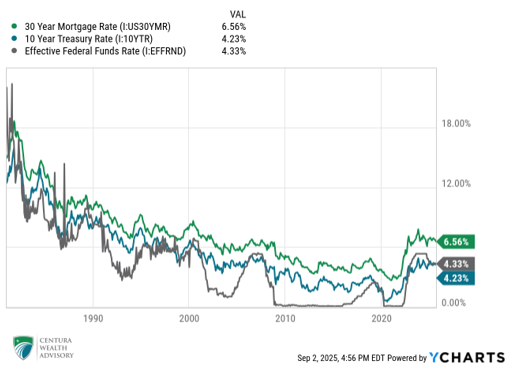
On the rates front, uncertainty continues to be the name of the game. Current Fed Chair Powell is on his way out, with Kevin Warsh set to take the helm in May. Fed officials expect interest rates to settle around 3.0% by the end of 2028, illustrated in Exhibit 1, but the road there is anything but clear. Normally, slowing growth and a softening job market would be a green light to cut rates. However, tariffs and fiscal policy continue to pose challenges for the Fed, meaning any hint of rising inflation could pump the brakes on cuts entirely. Warsh has also made no secret of wanting to shrink the Fed’s balance sheet, a move that would effectively tighten financial conditions even if rates are being cut. Per usual, the path forward for monetary policy remains unclear and highly dependent on macroeconomic data.
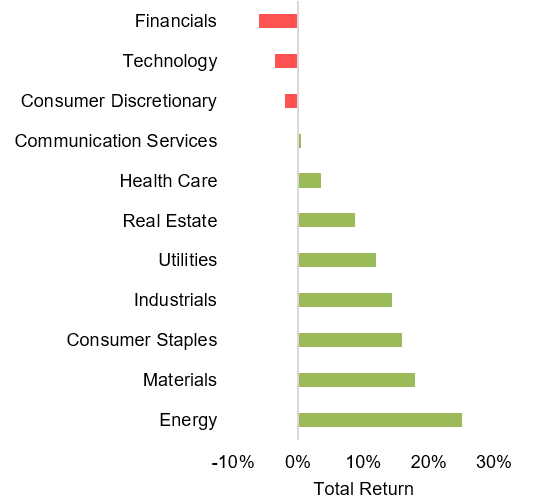
Exhibit 2: Year-to-Date Equity Sector Returns
Source: YCharts. Data through 2/28/26.
AI is still the topic du jour, but lately it has become a source of turbulence, not just excitement. Some of last year’s biggest winners, like the financials and tech sectors, have flipped to become the worst performers this year, illustrated in Exhibit 2. And just when markets had enough to chew on, geopolitical turmoil reared its ugly head with fresh conflict in Iran to end the month. Middle East instability and oil prices have a long history together, and a prolonged conflict in the region could stoke domestic inflation just as these concerns had started to fade, reigniting not just the potential for further price increases, but the dreaded stagflationary environment. So how should investors make sense of all this? The short answer is stay diversified and look for value rather than just safety. One of the most important things to keep in mind is that markets don’t move on headlines, they move on surprises. The risks everyone is already talking about? They are largely priced in. The real wildcard is always the risk nobody is modeling yet.
The Bottom Line: The market continues to digest a lot – tariff turmoil, Fed leadership changes, midterm election build-up, geopolitical risk, and AI implications – but the real danger isn’t what’s making headlines; it’s what isn’t, making valuations and current market expectations the most important things for investors to keep in focus.
Looking Ahead
Where Are We in the Market Cycle?
The business cycle refers to the natural fluctuations in the economy over time, implying that the economy moves through periods of expansion and contraction. The business cycle is broadly comprised of four stages: recovery, expansion, late cycle, and recession. There is no set length of a business cycle, meaning the only way we can determine where we are in the cycle is by looking for clues. Right now, the clues are increasingly pointing to a late cycle environment.
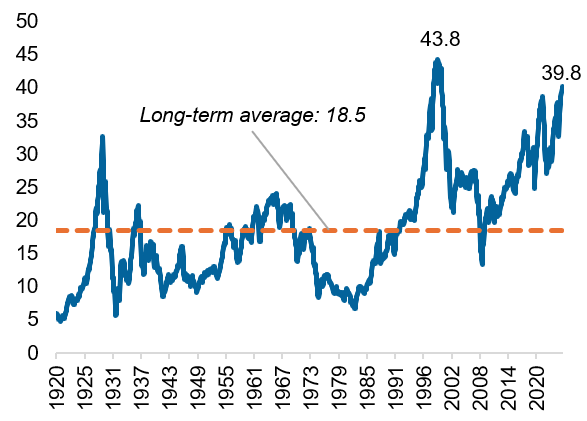
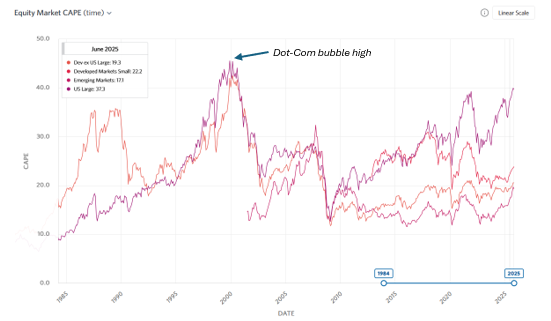
What does late cycle look like? This cycle stage is broadly characterized by slowing economic growth, tighter monetary policy, pricey markets, and widening credit spreads. More anecdotally, this stage can also be characterized by excess – leverage, investor exuberance, and a “nothing can go wrong” attitude, characteristics we are seeing in today’s environment. On the valuation front, the numbers are hard to ignore. The Shiller Cyclically Adjusted P/E or “CAPE” ratio, widely considered the gold standard for measuring whether stocks are cheap or expensive, is at levels only seen once before in history: early 2000, right before the Dot-Com bubble burst, illustrated in Exhibit 3. While there is real earnings growth propping up these valuations, history suggests these stretched ratios are far more likely to come down than go higher moving forward.
Exhibit 3: Historical CAPE Ratio for the S&P 500
Source: YCharts
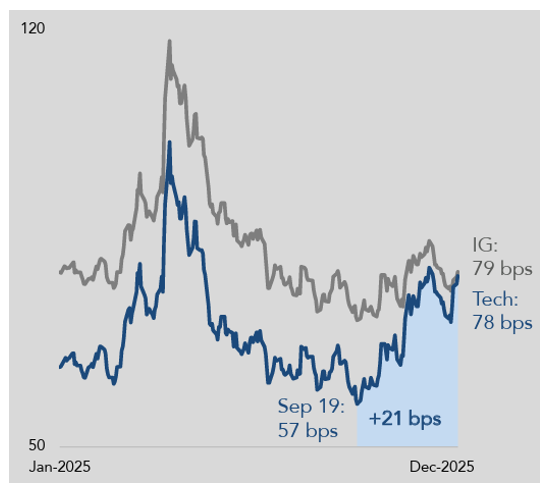
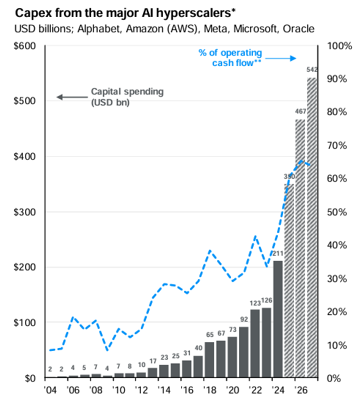
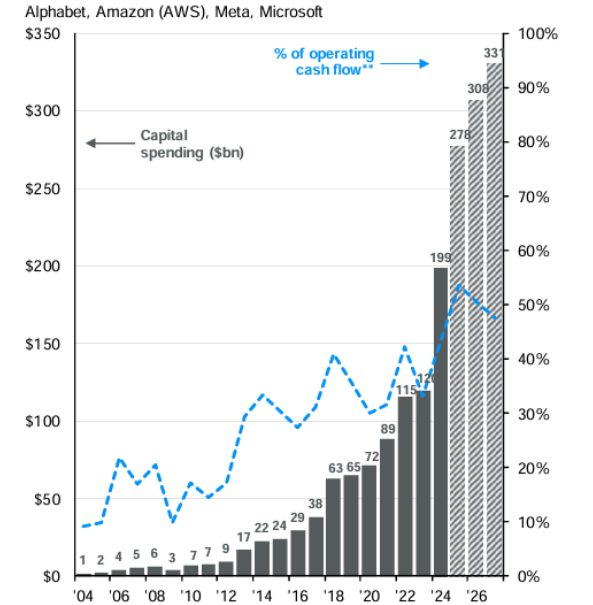
The credit markets are flashing similar signals of excess and late cycle behavior. The biggest AI players are spending at eye-watering levels to build out infrastructure, and they are increasingly borrowing to do it. These companies have historically had fortress balance sheets and ratcheting up debt issuance will naturally reduce the quality of their financial statements. Some hyperscalers, like Meta, are even using Special Purpose Vehicles to keep debt off their balance sheets – a type of financial engineering that is classic late cycle behavior. While some of these trends may raise eyebrows, including increasing investment grade spreads in the tech sector, illustrated in Exhibit 4, late cycle doesn’t mean sell everything. Stages of the business cycle can last longer than anyone expects, but it does warrant attention from investors with February’s market rotation serving as a preview. Investors are already quietly repositioning toward tomorrow’s opportunities, but the playbook here isn’t to chase what has been hot, but rather to stay anchored to valuations and think about where you want to be when the cycle turns.
Exhibit 4: Investment Grade (IG) Index vs. IG Tech Spreads
The Bottom Line: Today’s market is flashing a late cycle warning with stretched valuations and rising leverage. Rather than chase yesterday’s winners, investors should be thinking about valuations and where they want to be positioned when the music stops.
Capital Markets Themes
What Worked, What Didn’t
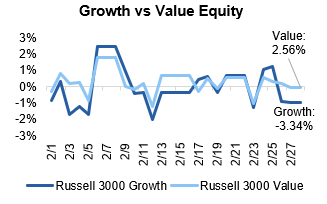
•Value Continues its Outperformance: Growth stocks had another rough month as lofty tech valuations continued to deflate, a trend that has been gaining steam since late 2025.
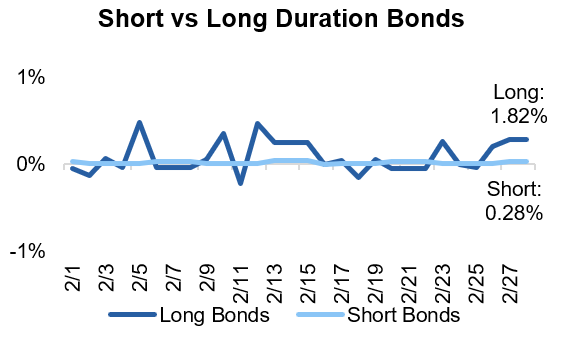
•Long Duration Looks Attractive: With uncertainty running high, investors fled to safety and pushed further out on the yield curve, rewarding long duration bonds with a 1.82% return in February.
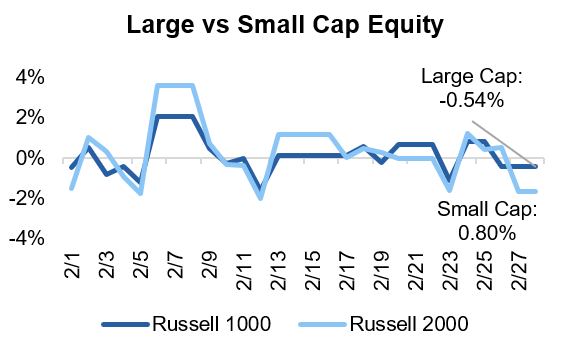
•Large Cap Equities Falter: U.S. large cap equities slipped into the red as investors rotated away from risk assets. The culprits? A trifecta of fiscal policy uncertainty, geopolitical tensions, and AI-driven disruption. The trade that worked for years is showing cracks.
Source: YCharts. Data call-out figures represent total monthly returns.
On Alternatives
The Basics of BDCs
Business development companies or “BDCs” have been in the headlines recently, prompting an explainer on what they are, why investors like them, and why they have been coming under pressure. At their core, BDCs pool investor money and either lend it out or take equity stakes in small and mid-sized businesses that cannot easily do business with a big bank. They are required to pay out at least 90% of their taxable income as dividends, which makes them a natural fit for income-hungry investors. Some BDCs trade on public exchanges with a daily price, while others are non-traded and harder to access. The appeal for retail investors is high yields, but these yields typically come with a more concentrated portfolio. BDCs are not known to spread risk across hundreds of positions – instead, they are more concentrated in specific sectors and parts of the capital stack. This type of approach is fine in calm markets, but in choppy ones, there is no natural cushion when something goes wrong. Additionally, loans are typically more difficult to trade than stocks, creating additional difficulties when everyone heads for the exit at once.
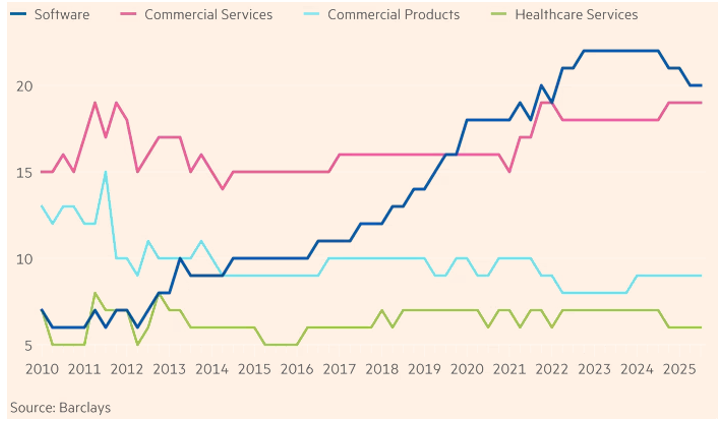
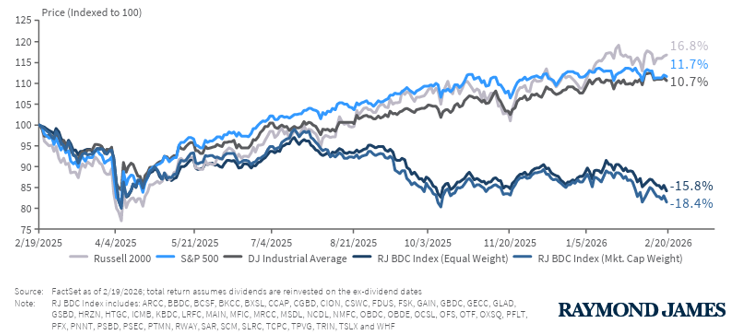
So why are BDCs in the news today? Over the past decade, they have steadily loaded up on software companies – and for good reason. Enterprise software historically has had low default rates thanks to sticky customers and a predictable, recurring revenue stream, prompting BDCs to increase their exposure, illustrated in Exhibit 5. With rapid advancements in AI in recent months, this thesis is starting to crack open, threatening not just the revenues of these software companies, but their existence as a whole. While the AI-driven sell-off in BDCs began in earnest in mid-2025, illustrated in Exhibit 6, it has accelerated in recent weeks, fueling headlines. Importantly, the structure of BDCs has played a role in this sell-off – the combination of daily pricing, a concentration in illiquid underlying holdings, and a roughly 20% exposure to software created the perfect storm. The lesson here is not that BDCs are bad investments, but that an investment’s vehicle is an important consideration. Put another way, investors should be reminded that it is not simply what you own that matters, but how you own it. When markets get jittery and everyone rushes for the door at once, structure matters just as much as substance.
The Bottom Line: Publicly traded BDCs have experienced drawdowns recently thanks to their heavy concentration in software, a sector now squarely in AI’s crosshairs, and the resulting sell-off is a masterclass in why vehicle selection matters just as much as manager selection, especially in private markets.
Asset Class Performance Quilt
Markets are ever-changing, making diversification across asset classes and sectors a critical component to portfolio construction. As illustrated below, a Balanced 60/40 portfolio provides greater consistency of returns and less volatility over time.
Source: YCharts. Asset class performance is presented using market returns from an exchange-traded fund (ETF) proxy that best represents its respective broad asset class. Returns shown are net of fund fees for and do not necessarily represent performance of specific mutual funds and/or exchange-traded funds recommended by Centura Wealth Advisory. The performance of those funds may be substantially different than the performance of broad asset classes and to proxy ETFs represented here. U.S. Bonds (iShares Core U.S. Aggregate Bond ETF); High Yield Bonds (iShares iBoxx $ High Yield Corp Bond ETF); Intl Bonds (Invesco International Corporate Bond ETF); Large Growth (iShares Russell 1000 Growth ETF); Large Value (iShares Russell 1000 Value ETF); Mid Growth (iShares Russell Mid-Cap Growth ETF); Mid Value (iShares Russell Mid-Cap Value ETF); Small Growth (iShares Russell 2000 Growth ETF); Small Value (iShares Russell 2000 Value ETF); Intl Equity (iShares MSCI ACWI ex US ETF); Emg Markets (iShares MSCI Emerging Markets ETF); and Real Estate (iShares US Real Estate ETF). The return displayed as “60/40 Allocation” is a weighted average of the ETF proxies shown as represented by: 40% U.S. Bonds, 12% International Stock, and 48% Large Blend.
https://centurawealth.com/wp-content/uploads/2024/11/iStock-1816227914.jpg12242448Cailyn Changhttps://centurawealth.com/wp-content/uploads/2024/07/Centura-Logo-White.pngCailyn Chang2026-03-06 11:47:282026-03-06 11:49:14Market Month in Review – February 2026
Macro Indicators: Inflation measures remain above the Fed’s long-term 2% target; however, there are greater concerns about the labor market, which is experiencing softening amid the “low hire, low fire” environment. GDP growth is surprising to the upside with third quarter data showing growth of 4.4%, driven by strong consumer spending and business investment, particularly within the technology sector.
Trump 2.0: The President made his nomination for the new Fed Chair, Kevin Warsh, who is expected to replace current Fed Chair Jerome Powell in mid-May. The Trump Administration also increased geopolitical pressures over the month, with the forced removal of Venezuelan President Maduro, threats to take over control of Greenland, and increased pressure on Iran. Tariffs remain in place unless the Supreme Court rules they are illegal.
Fed & Monetary Policy: The Federal Open Market Committee (FOMC) left interest rates unchanged in January. Current Fed Chair Powell’s term ends in mid-May and it is still undetermined whether he will stay on the Board after the fact. While concerns about Fed independence re-ignited over the month as the Department of Justice initiated a criminal probe into Chair Powell over the costly renovation of the Fed’s HQ, President Trump’s pick of Kevin Warsh as the next Chair quelled concerns.
Capital Markets: Geopolitical shocks and policy moves prompted volatility in commodity markets like gold and silver alongside continued weakness in the U.S. Dollar, but these trends reversed upon Warsh’s nomination. Early earnings releases point to another solid quarter, but elevated expectations in the tech sector fueled volatility across equity markets.
Asset Class Performance
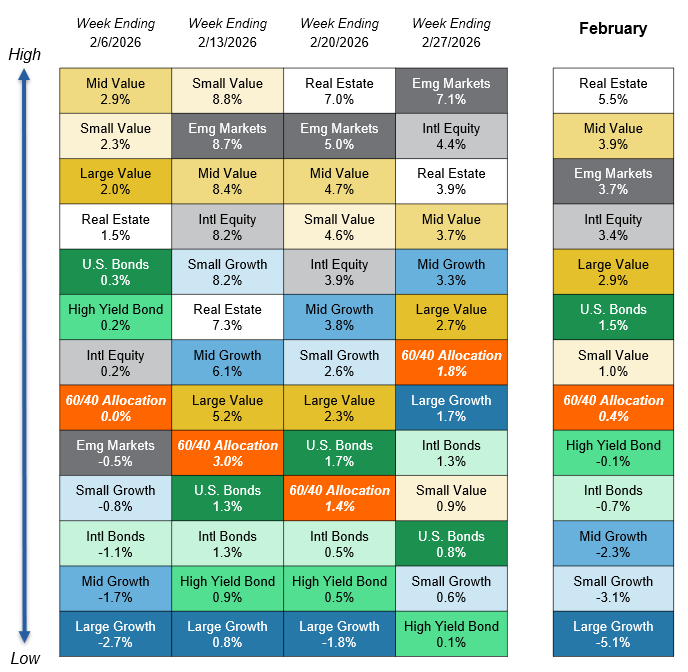
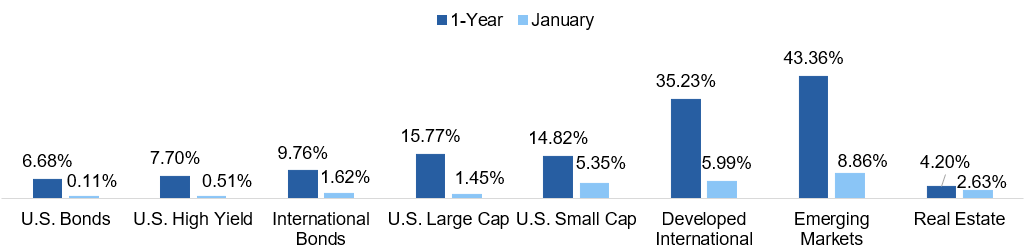
After a stand-out performance in 2025, international equities continued the momentum in January, outpacing domestic equity markets. Within the U.S., small cap stocks outperformed large cap stocks, and fixed income markets experienced relatively muted performance to kick-off the first month of the new year.
Source: YCharts. Asset class performance is presented using total returns for an index proxy that best represents the respective broad asset class. U.S. Bonds (Bloomberg U.S. Aggregate Bond TR), U.S. High Yield (Bloomberg U.S. Corporate High Yield TR), International Bonds (Bloomberg Global Aggregate ex-USD TR), U.S. Large Cap (S&P 500 TR), U.S. Small Cap (Russell 2000 TR), Developed International (MSCI ACWI ex US TR), Emerging Markets (MSCI EM TR), and Real Estate (Dow Jones U.S. Real Estate TR).
Markets & Macroeconomics
Does Interest in Gold & Silver Spell Trouble for the Dollar?
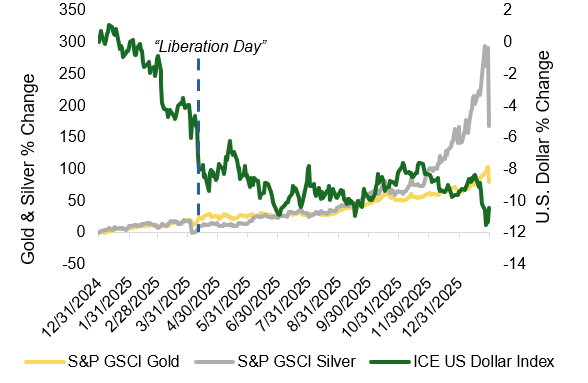
Ever since the Trump Administration’s “Liberation Day” in April 2025, markets have witnessed a broader diversification away from U.S. assets, prompting a decline in the global reserve currency. President Trump’s policies, in addition to concerns over persistent federal deficits, have popularized a “debasement trade,” a trade centered around a fall in value of a currency, in this case, the U.S. dollar. This trade has manifested itself in metal markets, which can be used as a hedge against a falling dollar, prompting greater interest and precipitous rises in the prices of gold and silver over the past year, illustrated in Exhibit 1.
Exhibit 1: Gold, Silver & U.S. Dollar Returns
Sources: YCharts
Geopolitical concerns are likely also driving commodity prices to start the year as global tensions have risen in place like Venezuela, Greenland, and Iran, most of which have been precipitated by the U.S. This combination of factors caused gold and silver to hit record highs in January, with gold prices topping $5,500/oz, nearly doubling in price since the beginning of 2025. Silver has experienced a more speculative run-up, surging to over $121/troy oz in January. While both metals offer intrinsic value that is attractive during currency downtrends, silver’s role as an industrial component, specifically for AI hardware, has helped fuel its growth. This dual purpose is likely responsible for silver’s parabolic rise that began last fall, but it can also lead to greater volatility than its gold counterpart.
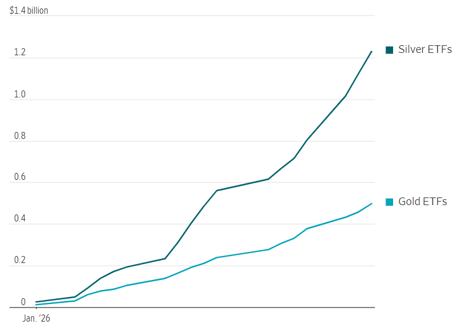
The U.S. dollar index is trading at lows not seen since 2022, and this depreciation is a concern for markets, with retail participants driving the surge in gold and silver, illustrated by the rise in ETF flows in Exhibit 2.
Exhibit 2: Cumulative Net Retail Flows
Source: Vanda Research (via Wall Street Journal)
President Trump acknowledged the dollar’s depreciation this month and, unlike markets, demonstrated a lack of concern. There are reasons why a falling dollar could be a good thing, including increasing the global competitiveness of domestic producers and domestically-manufactured goods abroad; however, there are some perils to a depreciating currency, like potential inflationary effects of higher import costs and a general erosion of confidence in the nation. Amid the current uncertain policy backdrop, investors are looking for reassurance that U.S. assets are a “safe” investment. The announcement of new Federal Reserve Chair Kevin Warsh offered much-needed comfort about Fed independence to markets to end January, prompting a rise in the dollar and a subsequently volatile fall in gold and silver. Time will tell on whether the debasement traders are correct, but, for now, the U.S. dollar remains the world’s most utilized currency.
The Bottom Line: President Trump’s policies, rising federal deficits, and geopolitical concerns have driven gold and silver prices to new highs, fueling the “debasement trade;” however, the recent appointment of new Fed Chair Kevin Warsh prompted a reassuring reversal in this trade to end January, illustrating how much markets are focused on policy decisions in the U.S.
Looking Ahead
Policy Remains at the Forefront
The month ended with monetary policy headlines: interest rates were held steady at the January FOMC meeting and President Trump nominated former Fed Governor Kevin Warsh as the new Fed Chair. This nomination came after intense speculation over who would replace current Chair Powell amid threats to central bank independence from the Trump Administration. The choice of Warsh, once a self-proclaimed “hawk” or a governor who supports higher interest rates, brought initial reassurance to independence concerns to close out the month.
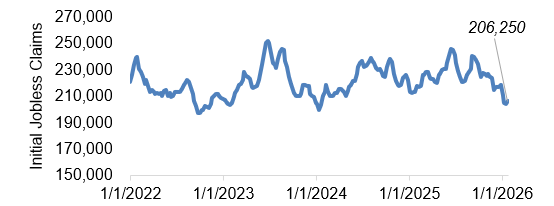
Now that markets have clarity on the next Fed Chair, attention can turn back to what matters most: the health of the economy. According to CME FedWatch, markets are currently expecting one to two 25-bps interest rate cuts in 2026 as inflation remains above-target, the labor market cools, and economic growth remains robust. The labor market remains the key concern for policymakers: major layoffs were announced by Nike, Amazon, UPS, and Home Depot in January, and the post-college graduate working cohort is experiencing the highest rates of unemployment, even as broader federal unemployment remains steady around 4.4%.
Exhibit 3: 4-Week Moving Average of Initial Jobless Claims
Source: FRED
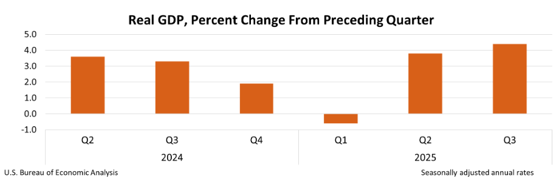
Part of why the unemployment rate has not ticked higher is due to stricter immigration policies from the Trump Administration, which has contracted the amount of labor supply in the market, which, when met with more muted labor demand, has kept the unemployment rate moderate by historical standards. While labor softening trends are evident, other metrics support a relatively stable labor market, like the 4-week moving average of initial jobless claims, illustrated in Exhibit 3 with levels above 250,000 typically signaling greater labor market weakness. Should the labor market begin deteriorating across numerous metrics, the Fed is likely to cut interest rates more aggressively. One reason holding the Fed back from cutting interest rates further in 2026 is robust GDP growth, illustrated in Exhibit 4. While tariffs have skewed some of the GDP data, the key driver of economic growth has been consumer spending, followed by business investment, which has been fueled by AI capex.
Exhibit 4: GDP Growth
Source: FRED
Despite gloomy survey data, the American consumer continues to spend, and the Trump Administration is hoping this trend continues in the lead-up to midterm elections in November. As we look ahead to the next 11 months of 2026, there are a few key policy matters to keep on the radar: 1) the “One Big Beautiful Bill” Act is expected to deliver a bumper crop of income tax refunds this spring, padding consumers’ wallets and supporting economic growth; 2) the Supreme Court will rule on the legality of the majority of President Trump’s tariffs, which could usher in a reversal of existing tariffs in their current form as well as add further uncertainty about how to unwind the tariffs; 3) rhetoric from the new Fed Chair about how he plans to manage the central bank’s dual mandate differently than his predecessor; and 4) the all-important midterm elections. All in all, the U.S. economy remains in solid condition, but with a changing of the guard at the Fed occurring in mid-May and an unpredictable fiscal policy agenda with major elections late this year, volatility is expected. Investors should understand the policy backdrop, but, at the end of the day, valuations should drive investment decision-making, not who is in charge at the Fed or whether the government is shut down.
The Bottom Line: Both fiscal and monetary policies are expected to be a driving force in 2026 as the Trump Administration focuses on spurring growth and the Fed manages its dual mandate under new leadership, with all eyes on the midterm elections later this year.
Capital Markets Themes
What Worked, What Didn’t
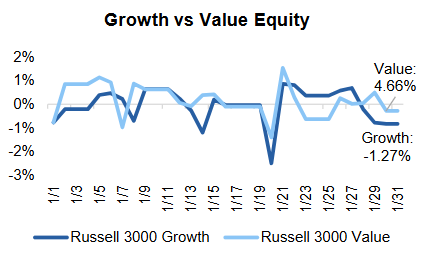
•Value Outperforms: Value stocks outperformed their growth counterparts as tech valuations continued to come under pressure, following a trend set at the end of 2025.
•International Run Continues: International equity markets continued their run-up in January after a banner 2025, with emerging markets outperforming developed international equities, boasting cheaper valuations and a boost from a depreciating U.S. dollar.
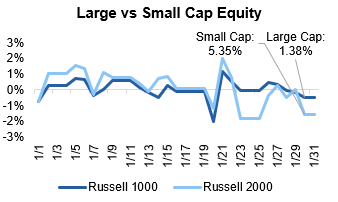
•Is this the year for small caps?: Small cap stocks outperformed their large counterparts in January, and the asset class’s outlook involves a positive earnings growth picture and a supportive environment as interest rates expect to decline further.
Source: YCharts. Data call-out figures represent total monthly returns.
On Alternatives
How IPOs and M&A Activity Shapes Private Equity Returns
Private equity value creation is driven by several factors, but investor returns ultimately depend on successful exits. IPO (Initial Public Offering) and M&A (Mergers & Acquisition) activity are the primary pathways that allow private equity firms to realize gains and return capital to investors. To understand why these exit channels are so critical, it helps to first look at how private equity (PE) firms generate value. While not all private equity firms operate identically, most follow a similar model: acquiring companies they believe are undervalued or can be operationally improved, with the goal of selling them later at a higher price. However, these strategies only translate into investor returns if firms are able to access viable exit opportunities. There are three main channels that PE firms use for exits: 1) IPO – the gold standard, typically offering the highest upside potential 2) Strategic – the sale of a portfolio company to another company looking to grow or strengthen its business (often through M&A) 3) Secondary Market – the sale of a portfolio company to another PE firm that believes it can create additional upside. These three exit channels work in harmony to ultimately drive returns for PE funds and their investors.
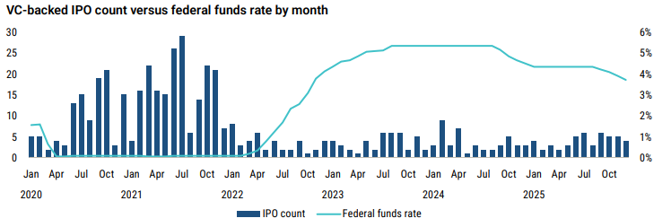
Exhibit 5: IPO Count vs Federal Funds Rate
Source: PitchBook
As with many sensitive ecosystems, when a new variable is introduced, it has the capacity to disrupt the entire system. Enter the Federal Funds Rate. For years following the GFC (Global Financial Crisis), interest rates hovered near zero.
After the pandemic and subsequent government stimulus, inflation ran rampant, forcing the Fed to raise rates and disrupt the homeostasis of these markets. As interest rates rose, the cost of borrowing increased, causing growth to become more challenging. During this time, IPO activity faced a steep decline, illustrated in Exhibit 5.
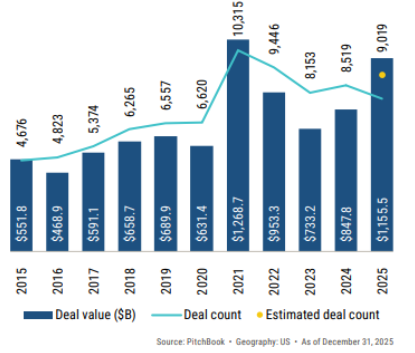
Exhibit 6: PE Deal Activity
Knock-on effects included a reduction in M&A activity and a general slowing of PE deal flow. This slump has resulted in fewer exits for PE, which in turn has delayed capital returning to investors and made the fundraising environment more challenging for new funds looking to raise capital. While activity remained challenging, 2025 was expected to mark a resurgence and reopening in the market. Tariff-related volatility in the first half of ’25 delayed that recovery, but once markets adjusted, the second half of the year began moving in the right direction. As shown in Exhibit 6, 2025 trended positively, with deal activity in both count and value reaching the highest levels since ’21 peaks. Looking forward to ’26, we expect this trend to continue, bolstered by AI-driven efficiency improvements and continued investment, additional rate cuts under new Fed leadership, and an administration focused on positive economic sentiment heading into the November midterm elections.
The Bottom Line: Manager selection is increasingly critical as challenging exit and fundraising conditions are likely to drive greater dispersion across sponsors, with some managers potentially raising their final fund. This environment reinforces the importance of rigorous due diligence and may create opportunities for investors to capitalize on market dislocations.
Asset Class Performance Quilt
Markets are ever-changing, making diversification across asset classes and sectors a critical component to portfolio construction. As illustrated below, a Balanced 60/40 portfolio provides greater consistency of returns and less volatility over time.
Source: YCharts. Asset class performance is presented using market returns from an exchange-traded fund (ETF) proxy that best represents its respective broad asset class. Returns shown are net of fund fees for and do not necessarily represent performance of specific mutual funds and/or exchange-traded funds recommended by Centura Wealth Advisory. The performance of those funds may be substantially different than the performance of broad asset classes and to proxy ETFs represented here. U.S. Bonds (iShares Core U.S. Aggregate Bond ETF); High Yield Bonds (iShares iBoxx $ High Yield Corp Bond ETF); Intl Bonds (Invesco International Corporate Bond ETF); Large Growth (iShares Russell 1000 Growth ETF); Large Value (iShares Russell 1000 Value ETF); Mid Growth (iShares Russell Mid-Cap Growth ETF); Mid Value (iShares Russell Mid-Cap Value ETF); Small Growth (iShares Russell 2000 Growth ETF); Small Value (iShares Russell 2000 Value ETF); Intl Equity (iShares MSCI ACWI ex US ETF); Emg Markets (iShares MSCI Emerging Markets ETF); and Real Estate (iShares US Real Estate ETF). The return displayed as “60/40 Allocation” is a weighted average of the ETF proxies shown as represented by: 40% U.S. Bonds, 12% International Stock, and 48% Large Blend.
https://centurawealth.com/wp-content/uploads/2024/11/iStock-1816227914.jpg12242448Cailyn Changhttps://centurawealth.com/wp-content/uploads/2024/07/Centura-Logo-White.pngCailyn Chang2026-02-04 09:21:152026-02-04 09:22:55Market Month in Review – January 2026
2025 was a year marked by key policy decisions, the explosion of artificial intelligence (AI), and a resurgence in private markets. The introduction of China’s DeepSeek AI model kick-started the year, fueling a competition amongst the technology “hyperscalers” competing in the AI arms race. This year also witnessed major policy decisions and consequences, including tariffs, a new tax bill, a record-breaking government shutdown, and three interest rate cuts from the Fed.
Arguably the most notable policy conundrum was created by President Trump’s “Liberation Day” tariffs. Announced in April and broadly implemented in August, these tariffs and their chaotic roll-out added uncertainty to markets and put the Federal Reserve in a significant bind with how to best manage their ‘dual’ mandate of combating inflation and maintaining full employment. Throughout the year, the Fed found themselves torn between the potential inflationary impact of rising goods prices due to tariffs and the potential economic slowdown caused by dropping trade levels and delayed corporate investment due to supply chain uncertainty.
As it turned out, inflation has remained stubbornly above the Fed’s 2% target, while the labor market is showing early signs of weakness (compounded by a very fast uptake in AI), continuing to complicate the Fed’s ultimate monetary policy response. The Fed’s approach, viewed as overly cautious by the administration, has been one of “wait and see,” a stance that is expected to continue in 2026. The strong Q3 2025 GDP report slowed the expected pace of rate cuts, with the 2026 median Fed Funds rate projected at 3.4%, only about 30 basis points below current levels. While a new Fed Chair may influence the future path of interest rates, we do not expect the pace of cuts to accelerate dramatically, regardless of who helms the Board. Another consequence of this policy uncertainty was the shift away from U.S. assets, with international equity markets outperforming U.S. markets by over 16% and the U.S. dollar posting a sharp decline.
The other defining event of 2025 was the rapid adoption of AI. Regardless of where you turned, AI was the topic of discussion. From doomsayers to evangelists, everyone had a view; however, AI has undeniably become part of our daily lives. Adoption rates have been head-spinning: 99% of Fortune 500 companies report using AI in some capacity, and anecdotes suggest small- and medium-sized companies are not far behind. This rapid adoption led to a massive boom in capex for data centers and their surrounding ecosystems.
Source: JPM Guide to the Markets.
*Hyperscalers are the large cloud computing companies that own and operate data centers with horizontally linked servers that, along with cooling and data storage capabilities, enable them to house and operate AI workloads.
This spending was so significant that it accounted for an estimated 30% of total U.S. capex in 2025 and contributed nearly 1% to total U.S. GDP – much of it ($121 billion) funded by debt issuance. This AI boom has driven up index valuations and maintained the concentration of growth in the “Magnificent Seven,” who currently represent roughly one-third of the S&P 500’s total market capitalization and continue to trade at stretched valuations relative to the remaining constituents, despite a modest reduction in concentration from previous peaks. AI capex is expected to expand further in 2026, with some estimates exceeding $1 trillion. Whether these valuations are warranted will likely be determined in 2026 and 2027, as investors demand a clearer path to returns and lenders increase credit spreads to compensate for higher risk.
Lastly, 2025 saw the outlook for private assets improve after a difficult 2024. Private asset fundraising has skyrocketed over the last decade, with private equity (PE) reaching roughly $6 trillion in AUM and private credit on course to hit $3 trillion by 2028. This represents a near-doubling of private asset AUM over ten years. We initially saw signs that general partners (GPs) were struggling to deploy cash, as valuation mismatches and a moribund IPO market made investor distributions difficult to generate. However, conditions improved in the latter half of 2025: Q3 saw a record number of PE deals and a reopening in IPO market. Additionally, regulatory changes allowing 401(k) plans to invest in PE could unlock $500–$600 billion in new inflows.
Private credit markets have been bolstered by increased standardization and the surge in data center construction. Risk-adjusted returns remain solid, typically delivering high single-digit returns with relatively low volatility. Conversely, private real estate continues to struggle compared to other private assets and public markets. Offices remain the weakest sector, delivering negative returns through Q4 2024 (the most recent data available), while other sectors saw only modest returns as income just barely outpaced price depreciation.
All in all, 2025 was a year marked by transformation – whether transformative technologies like AI or policies like tariffs that threaten the current world order. The events of 2025 laid the foundation for what could be an interesting 2026, with broadly positive economic and market trends expected, but a need for prudent decision-making and risk management.
We expect much of these trends to continue albeit with the potential for higher volatility as the market focuses on AI profits and clarity on interest rate policy from the Fed, further described in our 2026 outlook below.
2026 Outlook: Climbing a Wall of Worry…
There is a phrase coined in the 1950s that markets “climb a wall of worry,” a phenomenon where prices rise amid uncertainty and pessimism. There are always lots of things to be worried about, and the markets rarely seem without pressing risks and downsides. Our job as investors is to rationally weigh the pros and cons and to be brave when others get fearful.
The outlook for markets in 2026 is constructive despite a range of headwinds – including labor market weakness, elevated valuations, and geopolitical uncertainty – that are likely to generate periods of heightened volatility. The U.S. economy is expected to deliver solid growth supported by an AI-driven productivity surge, while consumer price inflation should continue to moderate, providing the Federal Reserve with flexibility to respond should growth weaken more than expected.
The counterbalance to rising productivity is reduced demand for labor. Labor market softness remains a concern, particularly as unemployment among college graduates is expected to continue rising. We also expect the U.S. dollar to remain under pressure as foreign investors and central banks continue efforts to diversify away from U.S. dollar–denominated assets due to U.S. policy uncertainty. Debt markets may emerge as an additional source of volatility in 2026, as the rapid expansion of debt-financed investment in data centers has yet to be fully supported by corresponding revenue generation.
Outside the U.S., the global economy is expected to weaken only modestly as the effects of tariffs on trade flows stabilize. The global economy appears to be adjusting to the “new normal” in trade with greater resilience than initially anticipated. While concerns surrounding Chinese growth persist, a sharp deterioration in global growth is not expected over the next twelve months.
U.S. equity market fundamentals remain intact, with double-digit earnings growth projected for fiscal year 2026 (approximately 14–15%). Although valuations remain elevated and could be a source of volatility, particularly in the first half of 2026, they do not appear extreme enough to warrant more than a market correction. Small-cap stocks should finally benefit from a supportive backdrop of lower interest rates, solid domestic growth, and more attractive valuations.
International markets should continue to be supported by a broadly accommodative global monetary policy environment, with Japan as a notable exception. U.S.-based investors are also likely to benefit from continued U.S. dollar weakness.
Bond markets are expected to remain relatively stable, with limited movement in yields or credit spreads unless triggered by equity market volatility. One area of focus will be the potential for stress in private credit markets to spill over into public credit, making credit spreads a key indicator to monitor.
Private assets are likely to deliver an “average” year. Returns may be constrained by a substantial overhang of undeployed capital in private equity and private debt, as well as a real estate market still recovering from excess capacity in office and multifamily segments.
The Bottom Line: We encourage investors to remain invested but to expect increased volatility given elevated valuations and leadership changes at the Federal Reserve, particularly in the first half of the year. Investors should view periods of market dislocation as opportunities to selectively deploy capital or rebalance portfolios.
Below you can enjoy deeper dives on the macro economy and each of the major asset classes.
As we enter 2026, our team is excited to continue bringing you market updates and managing your portfolios. Thank you for your continued trust and support. If you have questions or concerns, please contact your Centura Wealth advisor.
Economy & Asset Class Summaries
The Macro Economy
The U.S. economy appears to be in relatively robust shape: inflation has moderated, GDP growth remains solid, and the Federal Reserve has steadily, albeit cautiously, cut borrowing costs. Consumer spending and capital expenditures propelled the U.S. economy to a strong 4.3% GDP growth rate in Q3 2025 even as concerns about the lower-income consumer emerged. Inflation remained elevated above the Federal Reserve’s 2% target but does not appear to be on the brink of major reacceleration.
More recently, the labor market has shown signs of weakening, drawing concerns from both consumers and policymakers alike. Additionally, the emergence of a “K-shaped” economy has amplified the divergence in outlook between high- and low-income consumers – a theme that is likely to persist in 2026, particularly as returns to capital continue to outpace returns to labor thanks to the ongoing AI boom.
Economic growth in the rest of the world is also expected to slow modestly as economies move further away from pandemic-era stimulus and adapt to declining global trade volumes associated with tariffs. The IMF expects GDP growth in China, Japan, and India to slow in 2026 by roughly 0.4 percentage points relative to 2025 baseline levels, while the Eurozone is expected to continue to underperform with growth of approximately 1.1%.
Key Macro Indicators
Notes:
Trailing 1-year GDP reflects strong late-2025 growth offset by weaker early-year quarters.
Core PCE remains above target but has materially decelerated from the 2022–2023 period.
Capex growth reflects AI- and infrastructure-related investment strength.
Outlook
The U.S. economy should post respectable real growth of approximately 2.2% in 2026. The consumer sector, while leveraged, remains in relatively solid financial condition, particularly in the higher-income cohort. Employment markets are softening modestly but remain healthy relative to long-term historical norms.
AI-enhanced productivity gains should be a defining feature of 2026. Provided inflation remains contained, further labor market weakness can likely be offset through additional monetary easing.
Risks
Tariff-related price pressures emerge later and more forcefully than expected.
The AI boom displaces workers faster than anticipated, leading to a sharper-than-expected decline in consumer demand.
Credit markets push back against rising U.S. government debt levels or an AI-driven investment bust triggers instability across public and private debt markets.
The Bottom Line: The U.S. economy is expected to remain “K-shaped,” with a widening bifurcation between workers who benefit from and those threatened by the AI boom. Interest rates should continue to decline modestly, providing support to housing activity and capital investment.
U.S. Listed Equities
U.S. equity markets were driven primarily by investor expectations surrounding the AI investment cycle and anticipated Federal Reserve rate accommodation. Valuations for the S&P 500 remained elevated, though still below the extremes reached during the 1999–2000 Dot-Com boom. Valuations also remained clearly bifurcated between large-cap growth stocks and the rest of the market.
Market breadth improved over the course of the year; however, index-level returns continued to be disproportionately driven by the “Magnificent 7” and other AI hyperscalers.
Source: Research Affiliates
Equity Market Performance & Valuation
Notes:
CAPE are cyclically adjusted Price Earnings (PE) ratios and are less sensitive to cyclical fluctuations than traditional PE measures.
The S&P 500 ex-493 calculation is done using EOY index weights for each calendar year.
Outlook
Equity market fundamentals remain solid, with earnings growth expected to be approximately 14% for the S&P 500 and 35% for the Russell 2000. While valuations for the broad large-cap market remain elevated – largely driven by enthusiasm surrounding hyperscalers and AI-related capital investment – any valuation-driven pullback is more likely to take the form of a correction (<20%) rather than a full bear market (>20%).
Modest rate cuts should continue to support equity valuations, and tariff-related disruptions are expected to have largely worked through the system. Additionally, there is a record amount of money sitting in money market funds – suggesting any dip in markets may have plenty of buyers. A lower valuation hurdle combined with declining borrowing costs should disproportionately benefit small- and mid-sized companies relative to their larger peers.
Risks
AI adoption proves real, but profitability fails to materialize at levels sufficient to justify current valuations.
The K-shaped economy becomes more pronounced, with labor markets weakening faster than the Federal Reserve can ease policy.
Rising U.S. public and private debt levels trigger concerns in credit markets, leading to higher yields and widening spreads.
The Bottom Line: We expect the S&P 500 to deliver solid but unremarkable returns in 2026 – high single-digit to low double-digit gains – with year-end results likely masking a volatile first half of the year. Small-cap equities should outperform in this environment, provided labor market conditions do not deteriorate more sharply than anticipated.
International (Ex-U.S.) Equities
With the global economy firmly in a “not too hot, not too cold” environment and a weaker U.S. dollar, overseas equity markets shook off tariff-related concerns and posted strong gains across the board. Emerging markets outperformed developed ex-U.S. markets, with several countries delivering returns in excess of 50% beginning shortly after the “Liberation Day” announcement by the Trump Administration.
This performance suggests that the ultimate impact of tariffs proved less severe than initially feared and, when combined with lower valuation hurdles, allowed international markets to outperform.
International Equity Performance
Outlook
The economic outlook outside the U.S. is weaker than domestic conditions, with the IMF forecasting modestly slower growth in 2026 relative to 2025 across most regions. However, the drivers of U.S. dollar weakness remain intact and should continue to bolster returns for U.S.-based investors holding international assets.
While valuation gaps have narrowed somewhat following the overseas equity rally, U.S. equities remain expensive relative to their international peers. In addition, sector composition outside the U.S. remains attractive, offering diversification benefits. Finally, although the AI investment boom has been concentrated primarily in the U.S., AI-related technologies are expected to diffuse globally over time, delivering similar productivity gains across international markets.
Risks
The Trump Administration has made strategic ambiguity a hallmark of its trade negotiations, and any renewed trade hostilities could destabilize markets.
The global economy is expected to weaken modestly; a more pronounced slowdown would likely weigh disproportionately on international markets.
Geopolitical tensions in Europe (Russia/Ukraine) and Asia (China/Taiwan) could lead to periods of heightened volatility as markets reassess risk.
The Bottom Line: With U.S. equity valuations remaining elevated and U.S. dollar weakness expected to persist, international equities should remain a relatively attractive and defensive allocation for the next 12 months.
The Bond Market
The bond market entered 2024 with expectations of two 25-basis-point rate cuts by the Federal Reserve but ultimately received three, allowing the yield curve to steepen over the course of the year. Longer-term interest rates have declined less than short-term rates due to lingering concerns over inflation. Credit spreads – the premium investors demand over U.S. Treasuries – remained at historically tight levels, supported by the generally robust health of U.S. corporate balance sheets.
Fixed Income Market Snapshot
Outlook
Inflationary pressures stemming from tariff implementation are expected to continue moderating, and the Federal Reserve has indicated the potential for an additional 25–50 basis points of rate cuts in 2026, although there remains an unusually wide range of views among committee members. Credit spreads are expected to remain near the tighter end of their historical range.
Source: Palmer Square Capital Management. Data as of 9/30/2025.
Risks
Underwriting standards in the below investment grade credit market continue to weaken, increasing the risk of future defaults.
Commercial real estate remains a persistent area of concern for the banking sector.
Stress among regional banks could become more systemic if economic conditions deteriorate.
The Bottom Line: The traditionally “boring” bond market is likely to remain so, characterized by a positively sloped yield curve and relatively narrow credit spreads. That said, credit markets could experience periods of volatility, particularly if equity market turbulence increases.
Private Markets
Private Equity
After a difficult period for exits in 2023 and 2024, the private equity market showed improvement in 2025, marked by increased deal flow, a reopening of the IPO market, and a narrowing of valuation gaps. Strong demand for liquidity and distributions to limited partners also drove a surge in the secondary market, which recorded historically high transaction volumes. Capital deployment remained disciplined, with managers favoring technology-enabled services, healthcare, infrastructure adjacencies, and niche industrials, while weaker consumer-facing businesses continued to face headwinds. Overall, performance dispersion widened materially, reinforcing the premium placed on manager selection, underwriting rigor, and portfolio operating capabilities.
Private Credit
Private credit markets in 2025 remained resilient despite elevated credit differentiation and ongoing stress among cyclical and consumer-exposed borrowers. Market activity was supported by refinancing demand, sponsor-backed deal flow, and continued disintermediation from traditional banks, while spreads and covenant protections stayed favorable for borrowers relative to pre-2022 conditions.
Following strong performance in 2024, issuance was further bolstered by sustained demand for floating-rate structures and an AI-driven surge in financing for data centers, a trend expected to carry into 2026. Distress and amendment activity increased in select portfolios, leading to higher loss recognition among weaker managers, but top-tier lenders benefited from conservative capital structures, tighter documentation, and disciplined sector exposure. Overall, yield profiles remained attractive on a risk-adjusted basis, and investors continued to view the asset class as a strategic income allocation characterized by meaningful manager-to-manager performance dispersion.
Private Real Estate
Private real estate continued to face headwinds, particularly from weakness in the commercial office segment and oversupply in the multifamily sector, which depressed returns across the asset class. Capital rotated toward credit-oriented real estate strategies, single-family rental, specialized logistics, and select Sunbelt markets with stronger demographic tailwinds. Toward the latter part of the year, supply-and-demand dynamics began to show signs of stabilization, improving the outlook for 2026.
Private Market Performance Snapshot*
*Please note: all private asset index returns typically are subject to reporting lags and revisions. Additionally, different indexes have different compositions.
Outlook
2025 was a lackluster year for real estate but there are positive trends worth monitoring: the cost of owning a home continues to be at all-time highs, strengthening demand in the multifamily sector, and multifamily starts have decreased dramatically since 2022 highs, showing signs of an improving supply-demand imbalance.
Source: JPM Guide to the Markets.
As a whole, private assets are likely to generate returns broadly comparable to public markets when adjusted for differences in leverage. While each asset class is influenced by distinct drivers and idiosyncratic factors, the recent influx of capital into private markets, combined with higher borrowing costs, is expected to compress returns relative to the post-GFC era, making manager selection increasingly important.
Risks
A significant overhang of undeployed capital in private equity may pressure returns if capital is forced into lower-quality opportunities.
Continued growth in private debt markets, alongside weakening covenant protections, increases the risk of contagion in the event of credit stress.
Ongoing weakness in the office real estate sector, coupled with any additional deterioration in labor markets, could further weigh on multifamily performance.
The Bottom Line: There remains a compelling case for private assets, both for their potential to enhance returns and to reduce portfolio volatility. However, many of the same macroeconomic forces influencing public markets are also impacting private markets. As a result, while private assets have historically delivered excess returns as compensation for illiquidity, we expect this illiquidity premium to compress in 2026, with private market returns approximating those of public markets overall. In this environment, return outcomes are likely to become increasingly manager-dependent, with higher-quality managers continuing to generate alpha while weaker managers risk lagging even public market alternatives, making manager selection more critical than ever.
The information provided is for educational and informational purposes only and does not constitute investment advice and it should not be relied on as such. It should not be considered a solicitation to buy or an offer to sell a security. It does not take into account any investor’s particular investment objectives, strategies, tax status or investment horizon. You should consult your attorney or tax advisor.
The views expressed in this commentary are subject to change based on the market and other conditions. These documents may contain certain statements that may be deemed forward-looking statements. Please note that any such statements are not guarantees of any future performance and actual results or developments may differ materially from those projected. Any projections, market outlooks, or estimates are based upon certain assumptions and should not be construed as indicative of actual events that will occur. All information has been obtained from sources believed to be reliable, but its accuracy is not guaranteed. There is no representation or warranty as to the current accuracy, reliability, or completeness of, nor liability for, decisions based on such information and it should not be relied on as such.
Centura Wealth Advisory is a registered investment advisor. Advisory services are only offered to clients or prospective clients where Centura Wealth Advisory and its representatives are properly licensed or exempt from licensure. 12255 El Camino Real, St. 125, San Diego, CA 92130.
https://centurawealth.com/wp-content/uploads/2024/10/iStock-1699822168-scaled-1.jpg11592560Cailyn Changhttps://centurawealth.com/wp-content/uploads/2024/07/Centura-Logo-White.pngCailyn Chang2026-01-05 16:44:322026-01-06 11:18:55Q4 2025 Market Wrap: The Year of Transition: Navigating the Intersection of Policy, AI, and Private Markets
Macro Indicators: The October jobs report will not be published in its full form due to the government shutdown, creating a lapse in the crucial data driving current monetary policy decision-making. The unemployment rate is 4.4% and inflation remains elevated above the Fed’s long-term target, with delayed September PCE inflation data to be published in early December. GDP growth for 3Q is projected to be 3.9% as of month-end according to the Atlanta Fed’s GDPNow tool.
Trump 2.0: The record-breaking, 43-day government shutdown ended on November 12 after a short-term funding bill was ultimately passed after 14 previously failed votes, funding the government through January 30, 2026. While the Trump Administration’s tariffs are coming under pressure from the Supreme Court, there are alternate means to keep tariffs in place should the ruling not be in President Trump’s favor.
Fed & Monetary Policy: All eyes are on the December Federal Open Market Committee (FOMC) meeting for a “Dot Plot” update and a potential 25-bps rate cut. Markets are predicting an 86% probability of an interest rate cut in December as of month-end. With clouded data from the government shutdown, the Fed continues to balance their dual mandate, weighing future inflationary concerns against current labor market softness.
Capital Markets: The AI trade came under pressure in November over concerns of lofty tech valuations, creating a rotation into more defensive parts of the market. The bond market continued to see increased debt issuance to fund AI capex spending. Treasury yields broadly fell over the month in anticipation of further Fed easing to end the year.
Asset Class Performance
Returns across asset classes in November were relatively muted, with both U.S. equity and fixed markets outperforming international markets over the month. On a year-to-date basis, international equities remain the clear winners.
Source: YCharts. Asset class performance is presented using total returns for an index proxy that best represents the respective broad asset class. U.S. Bonds (Bloomberg U.S. Aggregate Bond TR), U.S. High Yield (Bloomberg U.S. Corporate High Yield TR), International Bonds (Bloomberg Global Aggregate ex-USD TR), U.S. Large Cap (S&P 500 TR), U.S. Small Cap (Russell 2000 TR), Developed International (MSCI ACWI ex US TR), Emerging Markets (MSCI EM TR), and Real Estate (Dow Jones U.S. Real Estate TR).
Markets & Macroeconomics
On Bubble Watch?
Artificial intelligence (AI) has been the dominant theme driving equity market performance this year, causing stocks within the “Magnificent Seven” group to account for nearly half of the returns in the S&P 500 on a year-to-date basis. Major hyperscalers in the public AI space, including Amazon, Google, Meta, and Microsoft, are spending astronomical amounts of money – collectively, close to $400B in 2025 alone – to invest in this new technology. These companies have also communicated to the market that the risk is spending too little, rather than too much, on AI, supporting the arms race narrative. 3Q earnings season showed few signs of a slowdown in spending, with capital expenditures (capex) expected to broadly increase in 2026, and the use of so-called “circular financing” across key players has investors drawing comparisons to the Dot-Com Bubble. These trends, coupled with a frothy market, has investors raising their eyebrows, begging the question of whether we are in an AI bubble.
The mania surrounding AI has caused the forward P/E ratio of the S&P 500 index to increase above its 10-year average of 18.7x to 21.5x. While tech valuations are driving this broader market froth, when compared to 10-year historical averages, valuations of the Magnificent Six (ex-Tesla) look high, but not lofty, illustrated in Exhibit 1. It is also important to note that unlike the Dot-Com Bubble, today’s tech companies are profitable, with the tech sector posting double-digit earnings growth in 7 out of the last 8 quarters. 3Q earnings growth for tech companies, however, is shaping up to be the lowest growth figure since 1Q 2023, indicating that this trend may be starting to slow, albeit still at a double-digit pace.
Exhibit 1: Forward P/E vs. 10-Year Average
Sources: YCharts, FactSet
Historical and forward-looking earnings growth estimates are supportive of today’s valuations in the key hyperscaler companies, but investors have become more wary about capex. The majority of hyperscaler capex is going towards the buildout of data centers, which are needed to house cloud computing and other AI technologies but will likely take years to build given power generation constraints. This means investors (and the hyperscalers) may have to wait years before seeing a return on their investment, supporting the argument that markets have gotten ahead of themselves with the AI trade. While markets are seeing more debt issuance to fund the AI infrastructure build-out in both public and private markets, the hyperscaler companies continue to sit on high levels of cash, illustrated in Exhibit 2. While these trends support non-bubble territory, it does not mean that caution isn’t warranted. For instance, smaller or unprofitable tech companies may experience more strain if they are forced to use leverage to fund AI investments. Accounting practices are also being scrutinized by investors as it relates to estimating the useful lives of chips, evidenced most recently by Nvidia, creating further skepticism. The hyper-competition among the hyperscalers is expected to continue, but given the run-up already seen in the past two years, the risk to the downside has emerged as a growing concern, supporting diversification outside of AI, but not necessarily for bubble reasons.
Exhibit 2: Hyperscaler Capex & Cash Flow
Source: JPMorgan Guide to the Markets
The Bottom Line: Equity markets in 2025 have been fueled by AI mania, prompting investor concern about bubble territory. Valuations of today’s large tech companies are supported by earnings growth, but moving forward, investors should be wary of lofty capex projections that carry no guarantee of investment return.
Looking Ahead
Testing U.S. Resilience
If 2025 taught investors anything, it is that the U.S. economy is resilient; however, multiple factors will test this resilience heading into 2026. Tariffs continue to be an outstanding threat despite Supreme Court scrutiny, with the potential to roil U.S. businesses who, thus far, have managed tariffs relatively well by shifting supply chains and absorbing higher costs. Net profit margins across equity sectors are similar if not better to where they were a year ago, illustrated in Exhibit 3, demonstrating the resilience of the corporate market. However, the longer these tariffs remain in place, the higher the probability of margin erosion, which could potentially induce companies to pass these higher costs onto an already-hurting consumer.
Exhibit 3: S&P 500 Net Profit Margins
The presence of this tariff threat is why economists continue to worry about inflation in the short-term, which has remained sticky around 3%, above the Federal Reserve’s longer-term 2% target. While markets are currently projecting three 25-bps rate cuts by the Fed over the next year, central bank policymakers will have to carefully weigh potential inflationary concerns against a slowing labor market, a difficult balance to strike. Recent private and federal jobs data (despite a lapse due to the government shutdown) has supported a slowdown in labor demand, which is occurring alongside a slowdown in labor supply as a result of the Trump Administration’s immigration policies. These projected trends in inflation and the labor market are contributing to a souring consumer, particularly in the lower-income cohorts. Years of inflation and higher borrowing costs have depleted consumer savings, and consumer confidence is trending lower, illustrated in Exhibit 4, with consumers expecting worsening inflationary and labor market conditions looking ahead. These expectations matter because they ultimately drive spending decisions or consumption, which represents roughly 70% of overall U.S. GDP growth.
Exhibit 4: Consumer Confidence Index®
Source: FactSet
Sour consumer expectations can become self-fulfilling prophecies and have the potential to weigh on the broader economy. All of these factors combined – persistent inflation, a cooling labor market, and slowing economic growth from a weakening consumer – set the stage for potential stagflation, a policymaker’s nightmare and a critical threat to economic resilience. Finally, a wealth effect from equity market gains, driven by the AI trade, has led to the emergence of a K-shaped economy, whereby lower-income cohorts are in a weaker position than their higher-income counterparts. Should the AI trade fall apart, this could weaken the resilience in the higher-income consumer cohort. As the year draws to a close, these risks warrant monitoring, and time will tell whether the U.S. will continue to display resilience in 2026.
The Bottom Line: As 2025 wraps up, multiple factors will test the resilience of the U.S. economy, including potential additional inflationary pressures due to tariffs, softening in the labor market, and deteriorating consumer economic expectations, particularly in the lower-income cohort, calling for caution and prudence.
Capital Markets Themes
What Worked, What Didn’t
•Growth Stocks Struggle: After outperforming their value counterparts in October, growth stocks underperformed in November as a result of increased investor skepticism over lofty tech company valuations.
•Negative Returns for EM: Emerging markets also experienced negative returns from the rotation away from tech with underperformance coming most prominently from countries like Taiwan and Korea.
•Muted Month for Fixed Income: Returns across fixed income securities were relatively muted in November as yields stayed relatively stable, focused on the Fed and their interest rate decision in December.
Large vs Small Cap Equity
Growth vs Value Equity
Developed vs Emerging Equity
Short vs Long Duration Bonds
Taxable vs Municipal Bonds
Investment Grade vs High Yield Bonds
Source: YCharts. Data call-out figures represent total monthly returns.
On Alternatives
Private Credit Concerns
In recent months, the private credit market has experienced a string of high-profile defaults, notably from firms First Brands, Tricolor, and Renovo, raising concerns of a broader deterioration in the asset class. The first thing to note is that “private credit” is a very broad term and all three of these bankruptcies occurred in different pockets of the market – the broadly syndicated loan market for First Brands, the asset-backed financing market for Tricolor, and the private debt market for Renovo, and all three companies defaulted for unique reasons. Importantly, the defaults of First Brands and Tricolor centered around fraud allegations whereas the Renovo collapse involved a write-down of the loan from par to $0 in a matter of weeks, raising concerns over underwriting standards.
There are a few important lessons investors should takeaway from these credit events. The first is that defaults happen and they do not automatically signal systemic weakness. The private credit market has grown rapidly to a size of around $2 trillion – nearly 10x the size it was in 2009, according to data from Preqin – offering some perspective on the size impact of these defaulting loans.
Exhibit 5: Private Credit Deal Activity
Additionally, like with any growing market, strong demand in private credit has attracted a broader range of lenders, including some who are more willing to accept looser underwriting standards. Driving this loosening is the lack of deal activity seen in recent years, illustrated in Exhibit 5. The high demand from investors coupled with lower deal activity has caused some lenders to be more willing to accept lighter covenants. Covenants are an important risk management mechanism in the private credit market – stricter covenants equate to stricter obligations for borrowers and thereby stronger protection for lenders. With the Fed continuing its rate cutting campaign, economic conditions are expected to further ease, which can coincide with loosening underwriting standards, but it may also re-ignite dealmaking activity. Lastly, while these three defaults have garnered much attention in the headlines, default rates across both private credit and the leveraged loan market remain below 2%, illustrated in Exhibit 6. The CDLI Index, the industry’s benchmark for the direct lending market, which is the largest asset class within private credit, is continuing to show earnings and EBITDA growth in the double-digits, a healthy signal. As always, it important to be selective in markets and work with managers who take a more conservative and quality-focused approach, which can help reduce exposure when defaults like the ones seen recently inevitably occur.
Exhibit 6: Default Rates
Chart Sources: JPMorgan Guide to Alternatives. Data through 2Q25.
The Bottom Line: The private credit market has come under scrutiny in recent weeks after a string of defaults across the ecosystem. While defaults are normal and do not automatically signal systemic risk, they heighten the importance of understanding the underlying structures of the debt, particularly as the Fed looks to further ease economic conditions.
Asset Class Performance Quilt
Markets are ever-changing, making diversification across asset classes and sectors a critical component to portfolio construction. As illustrated below, a Balanced 60/40 portfolio provides greater consistency of returns and less volatility over time.
Source: YCharts. Asset class performance is presented using market returns from an exchange-traded fund (ETF) proxy that best represents its respective broad asset class. Returns shown are net of fund fees for and do not necessarily represent performance of specific mutual funds and/or exchange-traded funds recommended by Centura Wealth Advisory. The performance of those funds may be substantially different than the performance of broad asset classes and to proxy ETFs represented here. U.S. Bonds (iShares Core U.S. Aggregate Bond ETF); High Yield Bonds (iShares iBoxx $ High Yield Corp Bond ETF); Intl Bonds (Invesco International Corporate Bond ETF); Large Growth (iShares Russell 1000 Growth ETF); Large Value (iShares Russell 1000 Value ETF); Mid Growth (iShares Russell Mid-Cap Growth ETF); Mid Value (iShares Russell Mid-Cap Value ETF); Small Growth (iShares Russell 2000 Growth ETF); Small Value (iShares Russell 2000 Value ETF); Intl Equity (iShares MSCI ACWI ex US ETF); Emg Markets (iShares MSCI Emerging Markets ETF); and Real Estate (iShares US Real Estate ETF). The return displayed as “60/40 Allocation” is a weighted average of the ETF proxies shown as represented by: 40% U.S. Bonds, 12% International Stock, and 48% Large Blend.
https://centurawealth.com/wp-content/uploads/2024/11/iStock-1816227914.jpg12242448Cailyn Changhttps://centurawealth.com/wp-content/uploads/2024/07/Centura-Logo-White.pngCailyn Chang2025-12-04 11:52:212025-12-04 11:52:21Market Month in Review – November 2025
Macro Indicators: Federal data was hampered by the government shutdown, with September labor market and PCE inflation data not published, clouding the economic picture. The September CPI report was published and showed both headline and core CPI increased 3.0% on a YoY basis. Private jobs data supported continued softening in the labor market in September. After two quarters of tariff-skewed data, estimates for 3Q GDP growth are currently 3.9%, driven by consumer spending and despite trends supporting slowing.
Trump 2.0: Tariff rhetoric was heightened over the month, particularly between the U.S. and China, contributing to market volatility. While no additional tariffs were implemented, the tensions illustrated the Trump Administration’s ongoing strategy of using tariff threats as leverage in trade negotiations.
Fed & Monetary Policy: The Federal Reserve cut interest rates by 25-bps at the October FOMC meeting, citing labor market weakness but alluded to “driving in fog” without crucial federal data due to the government shutdown. Chairman Powell voiced strongly that a December rate cut is not a foregone conclusion despite market expectations for one. The Fed also announced they will be ending their Quantitative Tightening (QT) program on December 1, underscoring their focus on easing economic conditions to support the labor market.
Capital Markets: Isolated regional bank volatility prompted a brief sell-off mid-month, but U.S. equity markets ended the month higher, marking the sixth-straight positive month for large cap stocks. Yields remained relatively unchanged, with the short-end of the curve declining in tandem with the 25-bps interest rate cut.
Asset Class Performance
Historically thought of as the most volatile month, asset class performance in October was relatively muted, with gains across the board on a year-to-date basis. Emerging markets outperformed the most in October and continue to be supported by a weaker U.S. dollar.
Source: YCharts. Asset class performance is presented using total returns for an index proxy that best represents the respective broad asset class. U.S. Bonds (Bloomberg U.S. Aggregate Bond TR), U.S. High Yield (Bloomberg U.S. Corporate High Yield TR), International Bonds (Bloomberg Global Aggregate ex-USD TR), U.S. Large Cap (S&P 500 TR), U.S. Small Cap (Russell 2000 TR), Developed International (MSCI ACWI ex US TR), Emerging Markets (MSCI EM TR), and Real Estate (Dow Jones U.S. Real Estate TR).
Markets & Macroeconomics
What Government Shutdown?
On October 1, the U.S. government shut down after the Senate failed to pass a House-approved bill to keep funding measures in place. The government was closed the entire month of October, making it the second-longest shutdown in U.S. history as of month-end, threatening to surpass the record 35-day shutdown during President Trump’s first term. Over the month, the Senate tried and failed multiple times to re-open the government, but financial markets paid little attention, focused instead on interest rates, tariff rhetoric, and earnings announcements, illustrated in Exhibit 1.
Exhibit 1: Equity Market Returns vs. October Milestones
Despite markets’ relative nonchalance, the current shutdown is on pace to be the longest in history and the latest estimates from the Congressional Budget Office (CBO) call for a reduction in annualized GDP growth of approximately 1-2% as a result. While this hit to GDP is expected to partially reverse once the government does eventually re-open, the CBO estimates that $7-14 billion will not be recovered. While the true economic impact of the latest government shutdown is difficult to estimate, it is occurring at a time when the health of the U.S. economy is already starting to show softening, particularly in the labor market.
The government shutdown prevented the publication of crucial economic reports during the month, including the September jobs report, which was scheduled for release on October 3. The pause in federal jobs data has made it harder for the Federal Reserve to steer monetary policy to combat labor market softness, with Chair Powell likening it to “driving in fog.” Despite the lack of federal data, the Fed proceeded with another 25-bps cut in October. Markets reacted negatively when Powell indicated that a rate cut in December was not guaranteed, underscoring investors’ expectations for continued monetary easing. PCE inflation, the Fed’s preferred inflation measure, was also not published in October, as tariffs continue to create pressures in the economy and threaten to eat away at margins should they remain in place. CPI inflation, on the other hand, was published, and it showed muted increases in prices, but many expect that the impact of tariffs has not been fully realized.
After China announced new export controls on rare earth elements, the Trump Administration threatened an additional 100% tariff on Chinese imports, escalating tensions and spooking markets in October. By the end of the month, the two leaders met and announced a truce, suspending escalations for the time being. Tariffs continue to be a sore spot for markets, largely due to fears over their ultimate impact on margins. While earnings announcements for the third quarter have been relatively strong, there have been pockets of margin compression, and the outsized capital expenditures by major tech companies paired with above-average valuations has markets worrying whether tariffs will be the catalyst to end the run-up.
Historically, government shutdowns don’t last long enough for markets to care; however, should the current one continue to persist, it could create more lasting impacts. Perhaps markets should be paying more attention.
The Bottom Line: Equity market complacency with the U.S. government shutdown is revealing what matters most: tariffs, interest rates, and their ultimate impact on company bottom lines.
Looking Ahead
Can the Equity Run-Up Continue?
The S&P 500 is trading at a forward price-to-earnings (P/E) ratio of nearly 23x, and other valuation metrics, like the cyclically adjusted price-to-earnings (CAPE) ratio, are approaching historical peaks, illustrated in Exhibit 2. Much of this expansion has been driven by excitement around the artificial intelligence (AI) trade, leading to a surge in technology stocks, which has pushed the “P” in valuation ratios like P/E higher. This trend is causing investors to draw comparisons to the Dot-Com Bubble in 1999, and with both forward- and backward-looking valuation metrics at or near all-time highs, it begs the question: can the run-up in equity markets continue?
Earnings can help provide insight into whether today’s valuations are justified. Looking at the third quarter, earnings growth continues to be supported by the technology sector, which has produced quarterly double-digit earnings growth since 2023. The explosive demand for AI has enabled tech companies to invest heavily in building out these technologies, illustrated by massive capital expenditures from the major “hyperscalers” (Alphabet, Meta, Microsoft, and Amazon), who are expected to collectively spend in excess of $380 billion in capex this year.
Exhibit 2: S&P 500 Forward P/E Ratio
While these substantial capital investments underscore strong long-term potential for tech companies, realizing AI-driven revenues will depend on building out the infrastructure and power systems required to run advanced models – a process that could lag current market expectations and warrants caution from investors.
Exhibit 3: Global Equity Performance
Sources: JPMorgan Guide to the Markets
Muddying the picture for equity markets today are tariffs and whether they will create additional inflationary pressures in the economy. Inflation is bad for stocks as it typically coincides with tightening economic conditions from the Fed. Should tariffs continue to remain in place, it could potentially start weighing more heavily on company margins, which could be a catalyst for volatility. The risk of a monetary policy misstep is also heightened in the current environment as the Fed monitors inflation while contending with labor market softening, yet another volatility catalyst.
Investors should be skeptical that markets will continue to march higher, even after the historic run-up seen in recent years. With valuations at or near historic highs, there is a heavier probability weighted toward prices falling. Without the historic rise in tech companies, like Nvidia, in recent years, international markets, including broad equity markets in Europe and Japan, would have actually outperformed the S&P 500, illustrated in Exhibit 3. Markets cannot go up forever, and while it doesn’t mean investors should exit the market, it does call for prudent asset allocation and risk management to protect for if (and more likely when) valuations come back down to earth.
The Bottom Line: Looking at valuations, today’s equity market appears frothy, driven by the AI trade. Given tariffs remain a real threat to price increases and supply chains, coupled with the time needed to translate tech capex into revenues, the AI trade warrants skepticism from investors, with the run-up continuing not a foregone conclusion.
Capital Markets Themes
What Worked, What Didn’t
•Large Cap Tech Back in Spotlight: Large cap stocks outpaced small cap counterparts over the month, and growth stocks outperformed their value counterparts by around 300 bps due to continued exuberance in big tech names. Valuations in the large cap tech space continue to be high, warranting diversification across market cap sizes and style boxes.
•Municipal Bonds Post Strong Month: Confronted with an influx of supply in 2025, the supply/demand picture in the municipal market improved in October, contributing to positive total returns in the asset class. From a relative value perspective, the long-end of the muni yield curve remains an attractive part of the market given the steepness of the curve.
Large vs Small Cap Equity
Growth vs Value Equity
Developed vs Emerging Equity
Short vs Long Duration Bonds
Taxable vs Municipal Bonds
Investment Grade vs High Yield Bonds
Source: YCharts. Data call-out figures represent total monthly returns.
On Alternatives
Cap Rates and the Real Estate Recovery
Real estate exuberance peaked in late 2022, following a period of historically low interest rates set by the Federal Open Market Committee (FOMC). Since early 2023, the effective federal funds rate has risen by more than 500 basis points, contributing to a broad decline in real estate values and erasing billions of dollars in estimated market capitalization.
This repricing stems in part from the recalibration of a key valuation metric: the capitalization rate (cap rate). The cap rate is the sum of the net cash flow for a property and is also know as net operating income (NOI) divided by the property value. Cap rates represent how much a property will cash flow in comparison to the amount that it is worth, making it a very useful tool for real estate investors to compare properties of vastly different sizes, types, or geographical areas. As interest rates rise, investors demand higher returns to compensate for increased borrowing costs. This in turn drives cap rates higher and, mathematically, compresses property values, assuming a constant NOI. These dynamics have been especially challenging for developments and projects that came to market in 2023 and early 2024, as the cap rates underwritten during the pre-2023, low-rate era are no longer viable in today’s environment.
However, capital appreciation, which is directly tied to a property’s valuation, is only one component of a real estate investment’s return. A significant driver of real estate returns remains the income yield generated from rents, illustrated in Exhibit 4. As the illustration shows, a steady source of income can help offset drawdowns during periods of volatility, like what was experienced between 2023-2024, and can potentially enhance returns during expansions.
Exhibit 4: Sources of Global Private Real Estate Returns
Source: JPMorgan Guide to the Markets
In recent months, the Fed has cut interest rates by 50-bps, bringing the short-end of the yield curve down and creating more favorable conditions for both real estate developers and investors. While additional cuts may provide near-term tailwinds for the real estate market, valuations are more closely correlated with the 10-year U.S. Treasury yield, which reflects longer-term economic expectations. A full recovery to peak-2022 valuations is expected to be a more gradual process; however, the market is already starting to see signs of life.
There is industry consensus that real estate values appear to have bottomed out in the second half of 2024, and institutional capital that had been sitting on the sidelines is now cautiously re-entering the market, narrowing the bid-ask spread and acting as a catalyst for renewed transaction activity. The current macroeconomic environment is also presenting attractive entry points in distressed or repriced assets originally acquired during the 2022 market froth, providing investors not just with compelling investment opportunities but also with encouraging signs of market recovery.
The Bottom Line: Real estate remains a reliable source of income and opportunity as the market regains its footing. With values stabilizing, cap rates becoming more attractive, and new opportunities appearing in repriced assets, the real estate market presents a favorable environment for investors focused on long-term growth, consistent cash flow, and tax-efficient strategies.
Asset Class Performance Quilt
Markets are ever-changing, making diversification across asset classes and sectors a critical component to portfolio construction. As illustrated below, a Balanced 60/40 portfolio provides greater consistency of returns and less volatility over time.
Source: YCharts. Asset class performance is presented using market returns from an exchange-traded fund (ETF) proxy that best represents its respective broad asset class. Returns shown are net of fund fees for and do not necessarily represent performance of specific mutual funds and/or exchange-traded funds recommended by Centura Wealth Advisory. The performance of those funds may be substantially different than the performance of broad asset classes and to proxy ETFs represented here. U.S. Bonds (iShares Core U.S. Aggregate Bond ETF); High Yield Bonds (iShares iBoxx $ High Yield Corp Bond ETF); Intl Bonds (Invesco International Corporate Bond ETF); Large Growth (iShares Russell 1000 Growth ETF); Large Value (iShares Russell 1000 Value ETF); Mid Growth (iShares Russell Mid-Cap Growth ETF); Mid Value (iShares Russell Mid-Cap Value ETF); Small Growth (iShares Russell 2000 Growth ETF); Small Value (iShares Russell 2000 Value ETF); Intl Equity (iShares MSCI ACWI ex US ETF); Emg Markets (iShares MSCI Emerging Markets ETF); and Real Estate (iShares US Real Estate ETF). The return displayed as “60/40 Allocation” is a weighted average of the ETF proxies shown as represented by: 40% U.S. Bonds, 12% International Stock, and 48% Large Blend.
https://centurawealth.com/wp-content/uploads/2024/11/iStock-1816227914.jpg12242448Cailyn Changhttps://centurawealth.com/wp-content/uploads/2024/07/Centura-Logo-White.pngCailyn Chang2025-11-06 09:54:352025-11-06 09:55:26Market Month in Review – October 2025
The third quarter of 2025 began with President Trump signing a sweeping reconciliation bill into law on Independence Day, fondly known as the “One Big Beautiful Bill Act.” The bill included an amalgamation of provisions and most notably extended the tax changes implemented under Trump’s first term. The quarter ended with a looming government shutdown. Fiscal policy aside, the third quarter also brought a renewed focus on monetary policy, fresh off the first interest rate cut since December 2024. Barring a disruption from a government shutdown, markets have sights set on the September jobs report, which will contain crucial data that will inform the Federal Reserve on the health of the labor market as they consider how quickly to unwind their restrictive policy stance. Yet again, the third quarter was one dominated by policy and its many complexities and uncertainties.
While policy played a key role in shaping market dynamics, the quarter was rounded out by numerous other developments:
Equity markets continued their resilience and run-up from the previous quarter, hitting fresh records along the way with the S&P 500 closing above 6,600 for the first time in September. Importantly, equities witnessed a broadening out, with small cap and international companies continuing to perform well with help from domestic interest rate cuts and more favorable valuations, respectively.
Reciprocal tariffs were finally implemented in early August; however, additional duty announcements were made at the end of the quarter on pharmaceuticals, trucks, and certain pieces of furniture, illustrating that tariffs continue to be a pillar of President Trump’s agenda. Threatening this pillar was a federal appeals court finding at the end of August that Trump overstepped his authority in implementing his tariffs, a decision that the Supreme Court will opine on in early November, adding further uncertainty to trade policy.
Economic growth was one of the many macroeconomic data points impacted by tariffs, with the final reading of Q2 2025 GDP printing at 3.8%, driven by a significant decrease in imports and reversing the first quarter’s surge. While muddied by tariffs, economic growth continues to be an important data point in assessing the health of the U.S. economy as expectations, including from the Fed’s Summary of Economic Projections or “Dot Plot,” call for slowing annual growth, below 2%.
Interest rate cuts were supported by the Federal Open Market Committee, who cut rates by 25-bps in September after months of pressure from the Trump Administration, who continues to undermine the Fed’s independence as a central banking authority. Fed Chairman Jerome Powell termed the most recent cut as a “risk management” decision, citing the difficulties in managing their dual mandate, with future cuts signifying that the pendulum may now be shifting from the inflation to the growth part of their mandate.
Labor market drama ensued over the quarter not just as a result of downward revisions to annual and monthly jobs-added data, but also through the Trump Administration’s firing of the commissioner of the Bureau of Labor Statistics (BLS). Data reporting challenges aside, the labor market is showing signs of slowing, and future jobs reports remain crucial yet threatened by funding cuts and a looming government shutdown.
A historicpartnership with Intel was announced by the Trump Administration, including a multi-billion dollar, 10% equity stake in Intel by the U.S. government, adding fuel to the artificial intelligence (AI) fire, including the potential for greater chip manufacturing in the U.S.
The themes of the quarter underscore the importance of finding balance in today’s complex and uncertain environment – whether between potentially conflicting fiscal and monetary policies, between the Federal Reserve’s dual mandate, between bullish forces like AI and bearish signals like a cooling labor market, between the dueling parties of the American government, or even within investment portfolios – as markets navigate an economy poised for a variety of outcomes.
Below, this market wrap will provide a high level overview of key trends in capital markets and the economy over the quarter, concluded by a brief commentary of Centura’s outlook as we enter the final three months of 2025.
Markets
Equities – Despite the historically slow summer months, U.S. equity markets performed strongly over the quarter and were buoyed by the Fed’s interest rate cut in September, which prompted major indices – including the Nasdaq-100, Dow, S&P 500, and Russell 2000 – to notch fresh all-time highs in the last month of the quarter. Small cap stocks quietly outperformed their large cap counterparts, supported by the tailwinds of imminent interest rate cuts, investor sentiment shifting away from more expensive parts of the market, and stronger than expected GDP growth. International equities also continued to perform well, with emerging markets outperforming developed markets over the quarter, illustrating growing market breadth, which is overall supportive of the broader equity asset class.
Earnings season offered numerous insights, including a relatively cautious stance from businesses over policy uncertainty, macroeconomic data softening, and tariffs. Despite this more cautious stance, earnings grew around 12%, more than doubling initial projections. This growth was driven once again by the Magnificent Seven companies who reaffirmed their AI capex commitments and contributed 52% to overall year-over-year earnings growth. However, valuations in this part of the market remain rich and markets concentrated, with the Mag Seven representing around 32% of the S&P 500’s total market capitalization.
Bonds – Similar to recent quarters, fixed income markets continued to exhibit tight spreads, with high yield spreads currently around 280 bps, well below the 10-year average of 420 bps, making this asset class less attractive for investors. The Treasury yield curve experienced a flattening in the short-end of the curve, thanks to the Fed and their interest rate cut, and longer-term yields remained similar to where they started the quarter, with the 10-year hovering around 4.20%. Steeper than the Treasury yield curve was the municipal yield curve, and while absolute returns in this asset class were meager over the quarter, the slope of the municipal curve has not been this steep since 2015, offering investors attractive yields, particularly in the medium- to longer-end of the curve. Importantly, the bond market continues to be a sounding board for the Trump Administration, i.e., any policy change that causes an aggressive reaction from fixed income markets is unlikely to stick around for long.
Source:YCharts. The Bloomberg US Aggregate Index was used as a proxy for Bonds; the Bloomberg US High Yield 2% Issuer Capped Index was used as a proxy for High Yield Bonds; the Russell 2000 Index was used as a proxy for Small Cap Equities; and the MSCI ACWI Ex USA Index was used as a proxy for International Equities. All returns are based on total return levels as of 9/30/2025.
Currencies – The U.S. dollar continued its decline over the quarter, after posting its worst first half performance since 1973 to end the second quarter. It is expected that pressures will continue to weigh on the dollar, including U.S. debt concerns, expectations for further interest rate cuts, and macro data softness. While the dollar is experiencing weakness, its status as the reserve currency remains intact. Over the quarter, stablecoins saw important developments related to regulation with the passage of the GENIUS Act in July, which provided additional clarity surrounding a regulatory framework for digital assets.
Commodities – With the decline in the U.S. dollar and the Fed shifting to interest rate cuts, safe haven assets experienced renewed interest from investors, including gold, which reached yet another record-high price to close out September and extended its bull market run. Other precious metals, including silver and platinum, also hit record highs over the quarter. Oil prices marginally declined over the quarter as supply increased in the market, putting pressure on profits of major oil companies.
The Economy
While markets demonstrated resilience, the macroeconomic data exhibited softness over the quarter, ultimately prompting the Federal Reserve to cut interest rates in September. The main culprit behind the interest rate cut was cooling in the labor market data, which occurred alongside still-elevated inflation and robust GDP growth, illustrating how the Fed’s dual mandate – stable prices and maximum employment – came at odds with one another over the quarter. This confluence of macroeconomic trends created challenges for the Fed over how quickly it should unwind its restrictive monetary policy stance, and these conditions are expected to persist moving forward.
Labor Market – Looking at the labor market, the July jobs reports, published in early August, stunned investors when nonfarm payrolls (73,000) fell well below expectations (100,000) and data for May and June was significantly revised downward. The revised figures showed nonfarm payrolls declined in June, marking the first negative change since 2020. Annual revisions to nonfarm payrolls were also published in September for the year ending in March 2025, with jobs added adjusted downward from initial estimates by 911,000. These trends point to a weaker labor market than initially thought and contributed to volatility over the quarter as markets began to price in interest rate cuts.
Importantly, the unemployment rate remained steady over the quarter, hovering around 4.2%, and layoffs have not picked up substantially, implying that companies have been slow to both hire and fire. Additionally, changing immigration policies are likely contributing to the slowing data as the Trump Administration cracks down on unauthorized immigrants. These factors support the notion that while the labor market is weakening, it is not deteriorating. Given some of the softness already seen and felt in the labor market, however, the conditions are ripe for the scales to tip should additional weakness emerge. This heightened risk makes the Fed’s job in supporting the economy and the growth side of their mandate an even more important balancing act in the current environment.
Muddying the labor market data is increased skepticism surrounding the BLS’s reporting of jobs data, which prompted President Trump to controversially fire the commissioner of the BLS after the July jobs report. Challenges in the reporting of labor market data are valid – budget constraints with agencies like the BLS as well as longer response times from companies reporting payroll data can lead to greater revisions in the jobs data, like what occurred with the July report. Surveying other labor market reports, including from sources like ADP, can help paint a more holistic picture of the labor market.
Any disruptions to the publication of labor market reports, whether due to data reporting issues or even a government shutdown, is likely to spur market volatility, given the significance of this data in assessing the health of the economy and driving monetary policy decisions.
Inflation – Inflation increased marginally over the quarter and remains above the Fed’s 2% target as tariffs wreak havoc on supply chains and shelter inflation remains problematic. The latest data in August shows headline CPI and PCE inflation measures at 2.9% and 2.7%, respectively. Core CPI and PCE inflation is marginally higher at 3.1% and 2.9%, respectively. These increases have been in-line with expectations and have not prompted major market reactions; however, the full impact of tariffs has likely not been felt, meaning inflation could tick higher in the coming months as these tariff-induced price increases continue to trickle through the system.
With the Fed cutting interest rates to stimulate the labor market and with tariffs still at play, worries are mounting that inflation could stick around for longer, highlighting the importance for the Fed to strike the right balance.
Economic Growth – GDP growth did a 180 in Q2, growing 3.8% after contracting 0.6% in Q1, but both quarters were muddled by tariffs. After seeing a surge in imports in the first quarter to get ahead of impending tariffs, the second quarter saw a major drop in imports, the largest contributor to the overall GDP figure in Q2. Consumer spending was relatively strong but was offset by a decline in investment in the second quarter print.
While the stronger-than-expected Q2 GDP print signals continued economic growth, markets know this data was skewed by tariffs, putting greater emphasis on future quarterly growth data for a more accurate assessment of economic health. As of quarter-end, the Atlanta Fed is projecting Q3 2025 GDP growth of 3.8%, with more accurate readings expected as the quarter progresses.
Robust GDP growth makes the Fed’s job more difficult as interest rate cuts are typically carried out to help stimulate a struggling economy. With the U.S. economy continuing to hum along, it may make the Fed hard-pressed to cut rates unless the labor market experiences further weakness.
The Fed – All of these macroeconomic factors are causing the Fed to walk a tightrope as they attempt to balance their dual mandate. With trends in GDP growth and inflation conflicting with those in the labor market, the Fed must manage the path forward carefully, meaning every data point will be a crucial input to their decision-making.
If the Fed’s job was not hard enough over the quarter, they also sustained immense pressure from the Trump Administration to cut interest rates. The success of the Fed and their monetary policy lies in their independent decision-making, which can only occur when it is removed from politics.
Centura’s Outlook
Across our portfolios, we continue to maintain balanced allocations in line with our long-term targets. We are favoring high quality parts of the market and diversification across asset classes, both public and private. Moving into year-end, there are a multitude of scenarios that could play out, demonstrating the importance of carefully balancing today’s set of opportunities against their respective risks and further supporting our current positioning.
On the risk front, the labor market remains a crucial factor not only for the health of the American economy, but also for prospects of further rate cuts. As of quarter-end, markets are currently expecting two more 25-bps cuts, and this will be highly dependent on not just jobs data, but inflation and GDP growth data as well. Whether or not this data can be published remains a separate issue as markets digest an impending government shutdown at the end of the quarter, which could cause publication delays and consequently force a pause in interest rate reductions. The Fed meets twice through year-end, in October and December, and volatility is expected to surround these meetings.
Under the hood of the economy, weakness in the consumer, particularly the lower end consumer, remains a concern. Consumer confidence has plummeted in recent months and inflation expectations could be re-anchoring higher. Expectations can become self-fulfilling prophecies, and the Fed will want to manage inflation expectations carefully to prevent these additional inflationary pressures from filtering through the economy.
Fixed income markets remain an important indicator for potential weakness in the consumer, which has started to crop up in places like the auto loan industry, which saw two bankruptcies in September – an auto-parts maker and a subprime auto lender. While the higher-end consumer drives the economy, the lower-end consumer can disrupt the economy in more indirect ways, making the risk of an exogeneous credit event an important factor to consider in the current environment.
On the opportunities front, corporate earnings remain solid and market breadth is returning, with the Magnificent Seven stocks contributing to 45% of the overall returns in the S&P 500, compared to 55% and 63% in 2024 and 2023, respectively. This presents an opportunity for more unloved parts of the market to shine alongside tech names, like what was witnessed with small caps during the third quarter. And while the AI trade continues to prop equity markets up and is likely far from over, concentration risks remain prevalent, supporting the need for a more balanced allocation.
Overall, policy remains a key tenet driving markets, and the Fed must manage a balancing act if they are to successfully support the labor market while combating inflation. The famous adage “don’t fight the Fed” can serve as an important reminder – if the Fed must balance their decision-making, so too should investors.
Now is not the time to make major bets but rather maintain a highly diversified portfolio that can weather a variety of storms. This reminder is even more important today as markets enter October, historically the month with the highest amount of volatility.
Looking ahead, we remain committed to helping you navigate these challenging market conditions. Our team continues to monitor developments closely and stands ready to provide guidance tailored to your specific financial objectives. As always, thank you for your continued confidence and support. If you have questions or concerns, please contact your Centura Wealth advisor.
The information provided is for educational and informational purposes only and does not constitute investment advice and it should not be relied on as such. It should not be considered a solicitation to buy or an offer to sell a security. It does not take into account any investor’s particular investment objectives, strategies, tax status or investment horizon. You should consult your attorney or tax advisor.
The views expressed in this commentary are subject to change based on the market and other conditions. These documents may contain certain statements that may be deemed forward-looking statements. Please note that any such statements are not guarantees of any future performance and actual results or developments may differ materially from those projected. Any projections, market outlooks, or estimates are based upon certain assumptions and should not be construed as indicative of actual events that will occur. All information has been obtained from sources believed to be reliable, but its accuracy is not guaranteed. There is no representation or warranty as to the current accuracy, reliability, or completeness of, nor liability for, decisions based on such information and it should not be relied on as such.
Centura Wealth Advisory is a registered investment advisor. Advisory services are only offered to clients or prospective clients where Centura Wealth Advisory and its representatives are properly licensed or exempt from licensure. 12255 El Camino Real, St. 125, San Diego, CA 92130.
Macro Indicators: Headline and core PCE inflation rose by 2.6% and 2.9%, respectively, in July, in line with expectations and demonstrating the beginnings of tariff-induced price increases. July’s labor market report shocked markets with significant downward revisions to jobs added in prior months, highlighting softness that could warrant interest rate cuts. The second estimate of 2Q GDP growth was revised higher from 3.0% to 3.3%, demonstrating a strong U.S. economy despite tariff impacts and policy uncertainty.
Trump 2.0: Tariffs were implemented at the start of the month and remain a cornerstone of Trump’s agenda, however a federal court ruled that most of the global tariffs are illegal, adding to the uncertainty surrounding trade policy. Meanwhile, the Trump Administration increased pressure on the Federal Reserve to lower interest rates.
Fed & Monetary Policy: At the Jackson Hole Economic Symposium, Fed Chairman Powell signaled to markets that the “balance of risks” has shifted, potentially warranting interest rate cuts, as soon as September at their next FOMC meeting, which will also see an update to the Fed’s Summary of Economic Projections or “Dot Plot,” outlining the Fed’s trajectory for interest rates and the economy. Despite mounting pressures from the Trump Administration to cut interest rates, the Fed remains squarely focused on the data.
Capital Markets: U.S. equity markets continued their run-up in August, with the S&P 500 notching its fourth positive month in a row after April’s tariff-induced lows. Q2 earnings seasons exceeded initially benign expectations for growth. Fixed income markets remained volatile and saw a steepening of the yield curve as investors priced in potential rate cuts after Powell’s Jackson Hole speech.
Asset Class Performance
In what is typically a sleepy trading month, August showed positive returns across all asset classes, with U.S. small caps outperforming the most on news of potentially imminent rate cuts. International equity markets continue to outperform on a year-to-date basis, and bonds posted stronger returns as yields fell over the month.
Source: YCharts. Asset class performance is presented using total returns for an index proxy that best represents the respective broad asset class. U.S. Bonds (Bloomberg U.S. Aggregate Bond TR), U.S. High Yield (Bloomberg U.S. Corporate High Yield TR), International Bonds (Bloomberg Global Aggregate ex-USD TR), U.S. Large Cap (S&P 500 TR), U.S. Small Cap (Russell 2000 TR), Developed International (MSCI ACWI ex US TR), Emerging Markets (MSCI EM TR), and Real Estate (Dow Jones U.S. Real Estate TR).
Markets & Macroeconomics
Labor Market – Finding Balance or Budding Deterioration?
On August 1 the Bureau of Labor Statistics (BLS) released initial employment statistics from July. Data showed the U.S. labor market cooling in July, as job growth remained muted and unemployment held steady. Nonfarm payroll employment increased by just 73,000, extending a period of slowing growth that has persisted since April. The unemployment rate stayed at 4.2%, with 7.2 million people unemployed. While July figures were sluggish, they were not the primary source of the market’s strong reaction following the release. The devil was in the details of the print – specifically, with revisions to May and June figures. Collectively, May and June nonfarm payroll numbers were revised down by 258,000 jobs, underscoring weaker hiring momentum than initially reported. After revisions, the jobs added for May and June stand at a paltry 19,000 and 14,000, respectively. This release created a few sources of unease for investors – each with their own implications.
Exhibit 1: Historic Payroll Revisions
Source: Bureau of Labor Statistics | Dan Burns
Data Integrity
While initial numbers often grab headlines, the BLS actually revises monthly payroll data for the two months following the initial data release and again on an annual basis to re-anchor figures with state employment records. The issue at hand was the magnitude of the revisions (Exhibit 1). The published standard error for monthly figures is +/- 82,554, well below revisions from the two preceding months. Just hours after the release, President Trump fired BLS commissioner Erika McEntarfer, contributing to market volatility. While the revisions alone highlighted an ongoing issue of data quality, the firing of the BLS head raised additional concerns around political motivations surrounding U.S. economic data.
Bright Spots in the Data
Personal consumption drives approximately 68% of GPD in the U.S. The knock-on effects of a contraction in the labor market may have a material impact on the growth outlook for the country. While jobs data painted a less rosy picture over the last few months, there are some bright spots in the data that signal balance. Average hourly earnings grew 0.3% in the month and are up 3.9% over the last year, and the average workweek increased slightly to 34.3 hours. While the hiring rate has marginally slowed, both services and manufacturing PMI’s recorded readings above 50 in August, indicating positive change in business sentiment over the last month. Lastly, while the ratio of unemployed persons to job openings has edged up from its low in December 2022, it has remained relatively unchanged over the year and stable over the month. While job numbers alone point to slowing, the collection of data could suggest some level of balance or normalization in the system.
Fed Action
Even though the data in aggregate does not scream an incoming labor contraction, Fed Chair Powell acknowledged a “shift in the balance of risks” during his speech at the Jackson Hole Economic Symposium. This statement seems to indicate that the risks of continuing to hold rates at a restrictive level to stave-off inflation may be detracting from the other side of the Fed’s mandate: maximum employment. Traders immediately began to price this risk, with chances for a September rate cute going from 40% before the report to 80% following the report, depicted in Exhibit 2. Futures labor reports will continue to be a focus as markets try to determine whether the data represents a recalibration or deterioration.
Exhibit 2: Fed Funds Rate Expectations
Source:CME FedWatch Tool | Morningstar
The Bottom Line: Payroll data from the previous three months has both surprised and disappointed investors. Expect future data on the labor market health to drive markets as the Fed appears poised to act in the face of economic softening.
Looking Ahead
The Fed’s Important Job
The Federal Reserve has a dual mandate to achieve maximum employment and stable prices. There are numerous tools the Fed can implement to achieve this mandate, but the single-most important tool is setting the interest rate that banks utilize for overnight borrowing, otherwise known as the federal funds rate. This short-term rate influences other interest rates in the market, including those rates that consumers use for home or auto loans, illustrating its far-reaching impacts on the overall economy. The Fed sets a target range for the federal funds rate whereby raising the target range can help slow down an overheating economy and combat inflation, and lowering the target range can help stimulate growth in a weakening economy. Markets obsess over this rate because of its influence on the economy, so much so that they are able to trade on expectations of where the Fed will move the federal funds rate target range, which is what the CME FedWatch tool visualizes, offering important insights into what markets believe and how those expectations are similar (or different) than actual federal funds rate changes.
As of month-end, CME FedWatch is predicting an 86% probability of a 25-bps rate cut at the Fed’s September Federal Open Markets Committee (FOMC) meeting, with current expectations for 1-2 additional 25-bps rate cuts through year-end. This would be the first interest rate cut since December 2024 and would mark a shift in the Fed’s positioning – where since 2022 the primary focus has been inflation to now growing concern about the labor market and a slowing economy. In July, the Fed’s preferred inflation measure, the Personal Consumer Expenditures (PCE) index, was up 2.6% for all prices, and 2.9% for core prices, which exclude volatile food and energy prices. While inflation has declined meaningfully from its highs in 2022, it has proven to be sticky around the 3% level, illustrated in Exhibit 3, and is expected to remain elevated above the Fed’s 2% inflation target as tariffs continue to filter their way through the economy. Despite these trends in inflation, there is growing evidence of a softer labor market, including slowing of both labor supply and demand, which is causing the Fed to finally consider changing their policy stance from more restrictive to expansionary, which Chair Powell discussed during the Jackson Hole Economic Symposium earlier in the month. As the Fed attempts to strike the right balance between their dual mandate, they are also facing intense scrutiny from the Trump Administration, who continues to argue for lower interest rates and is finding ways to interfere with the Fed’s independence.
Exhibit 3: PCE Inflation vs. Fed Target
Source: YCharts
The current environment is creating challenges for the Fed and the potential for a “stagflationary” environment, which last occurred in the 1970s, and represents an economy characterized by rising inflation, slowing growth, and high unemployment, a scenario that is extremely difficult for policymakers to address. Looking ahead to the September FOMC meeting, markets will be bracing for an interest rate cut, updated projections from the Fed about measures including inflation, GDP growth, unemployment, and interest rates through the publication of their quarterly Summary of Economic Projections, and mounting pressures from the Trump Administration. In an environment where the consumer is showing signs of weakness, whether through survey data or evidence like rising delinquencies by lower-income consumers, the Fed’s job is ever-important today and the stakes are high, giving investors more reason to obsess over the direction of monetary policy.
The Bottom Line: The Fed’s job of setting monetary policy and influencing the direction of the federal funds rate is an important one, with far-reaching consequences for the U.S. economy and American consumers, and the current environment is posing challenges that warrant monitoring for potentially adverse economic implications.
Capital Markets Themes
What Worked, What Didn’t
•Small Caps Post Stellar Month: Returning over 7% in August, small cap stocks were buoyed by Fed Chair Powell’s remarks in Jackson Hole, which opened the door to interest rate cuts at their September FOMC meeting. More domestically focused, small cap stocks will likely feel the relief of lower interest rates more drastically than their large cap counterparts.
•Value Beats Growth: •After lagging growth since after February, value stocks outperformed in August, with current valuations much more in-line with long-term averages than their growth counterparts today.
•Better Month for Bonds: After producing negative total returns in July, both corporate and high yield bonds posted returns 1% or better, as yields fell over softer economic data and potentially imminent rate cuts.
Large vs Small Cap Equity
Growth vs Value Equity
Developed vs Emerging Equity
Short vs Long Duration Bonds
Taxable vs Municipal Bonds
Investment Grade vs High Yield Bonds
Source: YCharts. Data call-out figures represent total monthly returns.
On Alternatives
How Interest Rates Impact Private Markets
Changes to short-term interest rates are driven by the Fed and monetary policy, whereas longer term interest rates are impacted by the market and trends in the economy. The potential for short-term interest rate cuts by the Federal Reserve in the near future emphasizes the importance of understanding how changes in interest rates have different impacts on different private asset classes, including private equity, credit, and real estate.
Generally, a decline in short-term interest rates corresponds to an increase in transaction activity within the private equity market. Lower short-term interest rates reduce the cost of borrowing, incentivizing deal-making as financing becomes cheaper. Lower interest rates also serve to stimulate economic growth, creating the potential for a more supportive IPO market, which has been stagnant since 2022 during the most recent period of higher interest rates. This point is further illustrated in Exhibit 4, where the median age of firms at IPO has risen to highs not seen since the post-Dot Com Bubble and post-GFC periods. The sharp increase in the median age since 2022 could indicate that higher interest rates have challenged the exit environment. On the other hand, lower interest rates could not only encourage private companies to pursue exits through IPOs or other strategies, but it could also prompt investors to shift away from public assets, like money market funds whose assets have ballooned to over $7 trillion, and into private markets, like private equity, in search of higher returns.
Exhibit 4: Median Age and Average Market Value at IPO
Source: JPM Guide to Alternatives. Data as of May 31, 2025.
In contrast to private equity, lower short-term rates are largely a detractor to returns in private credit markets due to the fact that the majority of private credit assets are floating rate loans. However, lower interest rates can reduce the risk of default by borrowers, potentially increasing credit quality across the private credit spectrum. In a declining rate environment, assessing the relative spread level of private credit versus public market equivalents remains a crucial factor in determining allocation to the asset class. Even in the current environment where spreads are tight, value can be found in the private credit market relative to public bonds.
Unlike the private equity and private credit markets, the private real estate market is more heavily influenced by the 10-year Treasury rate, which impacts other real estate metrics like cap rates and mortgage rates, which tend to be longer-term. While short-term interest rates still matter for borrowing costs related to project financing, for example, the 10-year Treasury yield has a more direct impact on mortgage rates, illustrated in Exhibit 5. This relationship calls into question the Trump Administration’s argument calling for lower short-term interest rates to improve mortgage rates, when in fact, it is the state of the fiscal budget, which is tied to government debt like Treasury bonds, that could help improve mortgage rates. Understanding the nuances of interest rate impacts on private markets can help drive decision-making in a changing rate environment, like what the market is anticipating today.
Exhibit 5: Mortgage Rates vs 10-Year Treasury and Effective Fed Funds Rates
The Bottom Line: Declines in short-term interest rates could benefit private equity markets through increased dealmaking activity but will reduce yields in the private credit market. Private real estate markets are tied more closely to the 10-year Treasury yield, causing future Fed interest rate cuts to have potentially less of an impact on property values.
Asset Class Performance Quilt
Markets are ever-changing, making diversification across asset classes and sectors a critical component to portfolio construction. As illustrated below, a Balanced 60/40 portfolio provides greater consistency of returns and less volatility over time.
Source: YCharts. Asset class performance is presented using market returns from an exchange-traded fund (ETF) proxy that best represents its respective broad asset class. Returns shown are net of fund fees for and do not necessarily represent performance of specific mutual funds and/or exchange-traded funds recommended by Centura Wealth Advisory. The performance of those funds may be substantially different than the performance of broad asset classes and to proxy ETFs represented here. U.S. Bonds (iShares Core U.S. Aggregate Bond ETF); High Yield Bonds (iShares iBoxx $ High Yield Corp Bond ETF); Intl Bonds (Invesco International Corporate Bond ETF); Large Growth (iShares Russell 1000 Growth ETF); Large Value (iShares Russell 1000 Value ETF); Mid Growth (iShares Russell Mid-Cap Growth ETF); Mid Value (iShares Russell Mid-Cap Value ETF); Small Growth (iShares Russell 2000 Growth ETF); Small Value (iShares Russell 2000 Value ETF); Intl Equity (iShares MSCI ACWI ex US ETF); Emg Markets (iShares MSCI Emerging Markets ETF); and Real Estate (iShares US Real Estate ETF). The return displayed as “60/40 Allocation” is a weighted average of the ETF proxies shown as represented by: 40% U.S. Bonds, 12% International Stock, and 48% Large Blend.
https://centurawealth.com/wp-content/uploads/2024/11/iStock-1816227914.jpg12242448Cailyn Changhttps://centurawealth.com/wp-content/uploads/2024/07/Centura-Logo-White.pngCailyn Chang2025-09-04 10:10:042025-09-04 10:10:04Market Month in Review – August 2025
Macro Indicators: Headline and core PCE inflation rose by 2.6% and 2.8%, respectively, in June, slightly above expectations and potentially demonstrating the beginnings of tariff-induced price increases. The labor market remains a concern for markets and economists, especially as tariffs threaten margins and Trump’s immigration policies take hold. The advance estimate of 2Q GDP growth printed at 3.0%, a rebound from 1Q’s print of -0.5%, with both data points muddied by the impact of tariffs.
Trump 2.0: The “One Big Beautiful Bill” (OBBB) was signed into law on July 4, extending most of the tax policies from Trump’s first administration, raising the debt ceiling, and much more. Tariffs continue to be top of mind for Trump, who implemented additional levies hours before they were set to take effect on August 1 after the initial 90-day “Liberation Day” pause.
Fed & Monetary Policy: The Fed held rates steady at the July FOMC meeting, citing a lack of evidence supporting interest rate cuts. Two Fed governors dissented with the decision in July; the first time two governors have dissented since 1993. Scrutiny is increasing on the Fed and its decision-making by both markets and the Trump Administration, with increasing pressure to cut rates. Fed officials remain squarely focused on inflation and employment data related to their dual mandate.
Capital Markets: U.S. equity markets hit multiple record-highs over July but ended the month on a sour note as the August 1 tariff deadline loomed. Fixed income markets remained volatile with muted to negative total returns over the month as macroeconomic data continued to give mixed signals about the economy.
Asset Class Performance
U.S. large cap equities posted the strongest returns in July but continue to lag international markets on a year-to-date basis by over 9%, signaling recovery but not a complete return to the “U.S. Exceptionalism” theme. Investment grade bonds had negative total returns over the month with high yield markets generating the greatest returns within the fixed income asset class, albeit at a paltry 0.45%.
Source: YCharts. Asset class performance is presented using total returns for an index proxy that best represents the respective broad asset class. U.S. Bonds (Bloomberg U.S. Aggregate Bond TR), U.S. High Yield (Bloomberg U.S. Corporate High Yield TR), International Bonds (Bloomberg Global Aggregate ex-USD TR), U.S. Large Cap (S&P 500 TR), U.S. Small Cap (Russell 2000 TR), Developed International (MSCI ACWI ex US TR), Emerging Markets (MSCI EM TR), and Real Estate (Dow Jones U.S. Real Estate TR).
Markets & Macroeconomics
More Policy Implications
On July 4, President Trump signed the One Big Beautiful Bill Act (OBBB) after weeks of deliberation in Congress. The passage of this bill was a milestone for the administration who has been talking about certain provisions, particularly extending the 2017 Tax Cuts and Jobs Act (TCJA), since the campaign trail. In addition to the extension of the TCJA, the OBBB includes provisions surrounding spending cuts on Medicaid, increased taxes on college endowments, an increase in the debt ceiling, and much more. The passage of the OBBB has important implications for consumers and the economy, with the most glaring impact on the federal deficit. The Congressional Budget Office estimates that the OBBB will add $3.3 trillion to deficits over the next 10 years, increasing the federal net debt as a percent of GDP from around 100% today to over 120%, illustrated in Exhibit 1. While the market contends with the long-term effect of increasing federal deficits, the passage of OBBB means that tax policy is largely in the rearview mirror for the Trump Administration, allowing the focus to shift to other items on his policy agenda, with tariffs and international trade policy continuing to be a key initiative.
Exhibit 1: Federal Net Debt
Source: JPM Guide to the Markets
The Trump Administration continued to make progress on trade negotiations over the month after extending the initial 90-day pause of “Liberation Day” tariffs to August 1, the day the tariffs are set to take effect on those countries without trade deals. It is clear that tariffs will remain in place, particularly as President Trump announced a flurry of tariffs to end the month. Tariffs are another policy initiative whose effects are only just starting to be felt, particularly in GDP and earnings data, and they are a phenomenon that continues to perplex the Federal Reserve on how to approach its own policy decisions.
Over the month, the Fed continued to debate the macroeconomic impacts of the Trump Administration’s policy initiatives. At their July FOMC meeting, the Fed opted to hold interest rates steady – a decision that drew dissent from two Fed governors, marking the first time since 1993 that two governors opposed a policy move. The Fed remains data dependent, focused on inflation, labor market, and GDP data. The first (advance) estimate of 2Q GDP printed at 3%, demonstrating a bounce back after slowing in 1Q to -0.5%. However, tariffs once again muddied the GDP print as 2Q’s growth was largely driven by a plunge in imports, creating a positive impact on overall GDP, illustrated in Exhibit 2. This GDP print also saw a positive contribution from consumer spending despite consumer sentiment indicators exhibiting weakness in recent months, which was offset by a decline in investment expenditures, demonstrating a hesitancy from U.S. businesses to spend.
Other items on the policy docket that have not garnered a lot of attention is President Trump’s promise to de-regulate, which could be a boon to U.S. businesses. Coupled with potential interest rate cuts later this year, it is likely that the back-half of 2025 will continue to be dominated by policy. While markets may have gained greater policy certainty, including on tariff outcomes, the economicimplications of those policies remains unclear.
Exhibit 2: Contributions to Percent Change in 2Q 2025 GDP
The Bottom Line: Policy decisions, whether coming from the Trump Administration or the Federal Reserve, continue to dominate headlines and major initiatives, like tax policy, tariffs, and interest rates have important economic implications, both in the short- and long-term and are likely to continue driving volatility in markets.
Looking Ahead
Is Market Breadth Coming Back?
U.S equity markets have largely been dominated by seven stocks since 2023, and while those Magnificent Seven continue to defy expectations in the current environment, market breadth has shown signs of life. A measure of market participation, market breadth can provide signals on whether movements in an index like the S&P 500 are more broad-based or concentrated in nature. While concentration continues to plague U.S. equity markets, with the Magnificent Seven representing ~33% of the S&P 500 as of month-end, there are signs that the concentration between these seven stocks is breaking up, and the other 493 stocks in the index may be starting to pull their own weight.
There are numerous measures of market breadth, and one such measure is the percentage of stocks in the S&P 500 that are closing above their 50-day moving average, which has moved higher since April’s market sell-off, starting July at an intra-month high of nearly 80%, illustrated in Exhibit 3, before moving lower to end the month. Typically, in technical analysis, a 50-day moving average above 70% signals broad market strength. For comparison, this figure was 17% to start the year, providing an indication for how far market breadth has come just in the first half of 2025.
Exhibit 3: Percentage of Stocks in S&P 500 Closing Above 50-day Moving Average
While Q2 earnings look muted for the rest of the 493 stocks in the S&P 500, with estimates calling for growth of 3.4% (versus 14.1% for the Magnificent Seven), expectations point to a reacceleration of growth through year end and into Q1 2026, which will coincide with moderating earnings growth for the Magnificent Seven stocks, illustrated in Exhibit 4. Valuations also point to potentially better opportunities in the S&P 500 ex-Magnificent Seven with the top 10 stocks in the index currently boasting a 28.7x forward P/E ratio, compared to 22.5x for the entire index and 21.0x for the remaining 493 stocks.
Another potential sign of market breadth is the fact that, through July of this year, the Magnificent Seven have only contributed ~39% to the overall returns of the S&P 500, compared to 55% and 63% in 2024 and 2023, respectively. Couple this fact with the latest all-time record high for the S&P 500 set on July 28, implying that there are potentially more companies driving the index higher. While the market breadth story is encouraging, there are still numerous factors at play, including lingering policy decisions surrounding tariffs and interest rates. A particularly important factor moving forward for equity markets will be the ability of companies to effectively manage the impact of tariffs, making future earnings seasons and management commentary even more important to follow, and diversification across and within equity markets an important consideration.
Exhibit 4:Share of Magnificent Seven Returns in S&P 500
The Bottom Line: While it may be too early to tell, market breadth in U.S. equity markets is showing signs of life, with various indicators, including 50-day moving averages and forecasted earnings growth, pointing to more broad-based strength in comparison to the heavily concentrated markets seen in recent years. Monitoring these indicators will provide important clues to whether we will finally see a break in the Magnificent Seven’s reign.
Capital Markets Themes
What Worked, What Didn’t
•Growth Comes Back in Favor: Growth and tech names performed well over the month with markets seeing a return to the “risk on” environment after April’s lows.
•Short Duration More Favorable: While producing lackluster total return results, short duration securities outperformed longer duration bonds over the month with yields continuing to support the income-generation story.
•Munis Edge Out Taxable Bonds: Municipal bonds eked out a slightly better total return than taxable counterparts but remain negative on a total return basis. The Muni/Treasury ratio is above 90% at the longer-end of the curve, providing attractive relative value opportunities.
Large vs Small Cap Equity
Growth vs Value Equity
Developed vs Emerging Equity
Short vs Long Duration Bonds
Taxable vs Municipal Bonds
Investment Grade vs High Yield Bonds
Source: YCharts. Data call-out figures represent total monthly returns.
On Alternatives
Gaining Exposure to AI with Infrastructure
The infrastructure asset class encompasses those physical or real assets that are essential to the everyday functioning of our society, including assets tied to transportation, utilities, communication, and energy. More specifically, this includes essentials like power and water utilities, renewable energy generators, and data centers whose demand is increasing to power artificial intelligence (AI) needs.
Similar to real estate and particularly for those investors with a longer time horizon, infrastructure investments can serve as an inflation hedge, offer diversification benefits, and provide a stable income stream. Demand for infrastructure is inelastic, or less impacted by changes in prices, causing these types of investments to be potentially more resilient during economic downturns or recessions.
Exhibit 5: Global Infrastructure Returns
Source: JPM Guide to Alternatives
This feature is well illustrated by the gray bars in Exhibit 5, which shows that even during periods of market turmoil, like in the aftermath of the Great Financial Crisis (GFC) in 2009 and the COVID-19 global pandemic in 2020, infrastructure investments maintained a stable income stream. In today’s environment, there are many relevant use cases for infrastructure, but one such use case that is garnering significant attention is the demand for data centers to help power AI. Large-scale AI models are highly complex, operate on vast datasets, and demand immense processing power at extremely high speeds. To function effectively, they rely on large-scale data centers capable of meeting these intense computational requirements.
This has led to a surge in demand for data center infrastructure among major technology companies or “hyperscalers” competing in the AI space, such as Microsoft, Google, and Meta. The substantial growth in capex of major tech companies is illustrated in Exhibit 6, with expectations of continued and hyperbolic growth in coming years. Importantly, these data centers typically have longer-term contracts with high switching costs for tenants, like the Metas of the world, making them more defensive from an investment perspective. Investors can gain diversified and stable exposure to transformative market themes like artificial intelligence, not by trying to pick winners and losers in the equity markets, but by investing in the critical infrastructure that supports the entire ecosystem. Much like selling picks and shovels during the gold rush, investing in the physical backbone of AI – such as data centers – offers a way to participate in the long-term growth while avoiding the volatility and uncertainty of choosing individual tech leaders.
Exhibit 6: Capex at major tech companies
Source: JPM Guide to the Markets
The Bottom Line: Infrastructure can be an attractive asset class to include in a portfolio for those investors looking to diversify, hedge inflation, and receive a stable income stream, all while providing exposure to emerging themes, like AI.
Asset Class Performance Quilt
Markets are ever-changing, making diversification across asset classes and sectors a critical component to portfolio construction. As illustrated below, a Balanced 60/40 portfolio provides greater consistency of returns and less volatility over time.
Source: YCharts. Asset class performance is presented using market returns from an exchange-traded fund (ETF) proxy that best represents its respective broad asset class. Returns shown are net of fund fees for and do not necessarily represent performance of specific mutual funds and/or exchange-traded funds recommended by Centura Wealth Advisory. The performance of those funds may be substantially different than the performance of broad asset classes and to proxy ETFs represented here. U.S. Bonds (iShares Core U.S. Aggregate Bond ETF); High Yield Bonds (iShares iBoxx $ High Yield Corp Bond ETF); Intl Bonds (Invesco International Corporate Bond ETF); Large Growth (iShares Russell 1000 Growth ETF); Large Value (iShares Russell 1000 Value ETF); Mid Growth (iShares Russell Mid-Cap Growth ETF); Mid Value (iShares Russell Mid-Cap Value ETF); Small Growth (iShares Russell 2000 Growth ETF); Small Value (iShares Russell 2000 Value ETF); Intl Equity (iShares MSCI ACWI ex US ETF); Emg Markets (iShares MSCI Emerging Markets ETF); and Real Estate (iShares US Real Estate ETF). The return displayed as “60/40 Allocation” is a weighted average of the ETF proxies shown as represented by: 40% U.S. Bonds, 12% International Stock, and 48% Large Blend.
https://centurawealth.com/wp-content/uploads/2024/11/iStock-1816227914.jpg12242448Cailyn Changhttps://centurawealth.com/wp-content/uploads/2024/07/Centura-Logo-White.pngCailyn Chang2025-08-05 21:53:222025-08-05 22:04:22Market Month in Review – July 2025