Market Month in Review – August 2025

At a Glance
Macro Indicators: Headline and core PCE inflation rose by 2.6% and 2.9%, respectively, in July, in line with expectations and demonstrating the beginnings of tariff-induced price increases. July’s labor market report shocked markets with significant downward revisions to jobs added in prior months, highlighting softness that could warrant interest rate cuts. The second estimate of 2Q GDP growth was revised higher from 3.0% to 3.3%, demonstrating a strong U.S. economy despite tariff impacts and policy uncertainty.
Trump 2.0: Tariffs were implemented at the start of the month and remain a cornerstone of Trump’s agenda, however a federal court ruled that most of the global tariffs are illegal, adding to the uncertainty surrounding trade policy. Meanwhile, the Trump Administration increased pressure on the Federal Reserve to lower interest rates.
Fed & Monetary Policy: At the Jackson Hole Economic Symposium, Fed Chairman Powell signaled to markets that the “balance of risks” has shifted, potentially warranting interest rate cuts, as soon as September at their next FOMC meeting, which will also see an update to the Fed’s Summary of Economic Projections or “Dot Plot,” outlining the Fed’s trajectory for interest rates and the economy. Despite mounting pressures from the Trump Administration to cut interest rates, the Fed remains squarely focused on the data.
Capital Markets: U.S. equity markets continued their run-up in August, with the S&P 500 notching its fourth positive month in a row after April’s tariff-induced lows. Q2 earnings seasons exceeded initially benign expectations for growth. Fixed income markets remained volatile and saw a steepening of the yield curve as investors priced in potential rate cuts after Powell’s Jackson Hole speech.
Asset Class Performance
In what is typically a sleepy trading month, August showed positive returns across all asset classes, with U.S. small caps outperforming the most on news of potentially imminent rate cuts. International equity markets continue to outperform on a year-to-date basis, and bonds posted stronger returns as yields fell over the month.
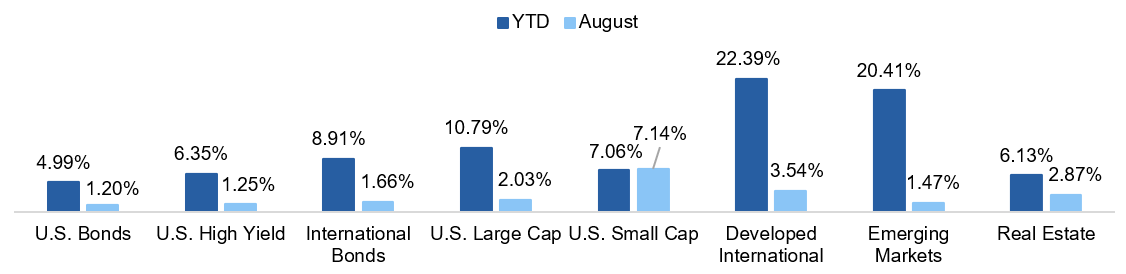
Source: YCharts. Asset class performance is presented using total returns for an index proxy that best represents the respective broad asset class. U.S. Bonds (Bloomberg U.S. Aggregate Bond TR), U.S. High Yield (Bloomberg U.S. Corporate High Yield TR), International Bonds (Bloomberg Global Aggregate ex-USD TR), U.S. Large Cap (S&P 500 TR), U.S. Small Cap (Russell 2000 TR), Developed International (MSCI ACWI ex US TR), Emerging Markets (MSCI EM TR), and Real Estate (Dow Jones U.S. Real Estate TR).
Markets & Macroeconomics
Labor Market – Finding Balance or Budding Deterioration?
On August 1 the Bureau of Labor Statistics (BLS) released initial employment statistics from July. Data showed the U.S. labor market cooling in July, as job growth remained muted and unemployment held steady. Nonfarm payroll employment increased by just 73,000, extending a period of slowing growth that has persisted since April. The unemployment rate stayed at 4.2%, with 7.2 million people unemployed. While July figures were sluggish, they were not the primary source of the market’s strong reaction following the release. The devil was in the details of the print – specifically, with revisions to May and June figures. Collectively, May and June nonfarm payroll numbers were revised down by 258,000 jobs, underscoring weaker hiring momentum than initially reported. After revisions, the jobs added for May and June stand at a paltry 19,000 and 14,000, respectively. This release created a few sources of unease for investors – each with their own implications.
Exhibit 1: Historic Payroll Revisions
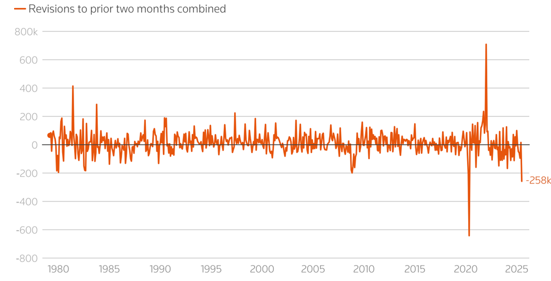
Source: Bureau of Labor Statistics | Dan Burns
Data Integrity
While initial numbers often grab headlines, the BLS actually revises monthly payroll data for the two months following the initial data release and again on an annual basis to re-anchor figures with state employment records. The issue at hand was the magnitude of the revisions (Exhibit 1). The published standard error for monthly figures is +/- 82,554, well below revisions from the two preceding months. Just hours after the release, President Trump fired BLS commissioner Erika McEntarfer, contributing to market volatility. While the revisions alone highlighted an ongoing issue of data quality, the firing of the BLS head raised additional concerns around political motivations surrounding U.S. economic data.
Bright Spots in the Data
Personal consumption drives approximately 68% of GPD in the U.S. The knock-on effects of a contraction in the labor market may have a material impact on the growth outlook for the country. While jobs data painted a less rosy picture over the last few months, there are some bright spots in the data that signal balance. Average hourly earnings grew 0.3% in the month and are up 3.9% over the last year, and the average workweek increased slightly to 34.3 hours. While the hiring rate has marginally slowed, both services and manufacturing PMI’s recorded readings above 50 in August, indicating positive change in business sentiment over the last month. Lastly, while the ratio of unemployed persons to job openings has edged up from its low in December 2022, it has remained relatively unchanged over the year and stable over the month. While job numbers alone point to slowing, the collection of data could suggest some level of balance or normalization in the system.
Fed Action
Even though the data in aggregate does not scream an incoming labor contraction, Fed Chair Powell acknowledged a “shift in the balance of risks” during his speech at the Jackson Hole Economic Symposium. This statement seems to indicate that the risks of continuing to hold rates at a restrictive level to stave-off inflation may be detracting from the other side of the Fed’s mandate: maximum employment. Traders immediately began to price this risk, with chances for a September rate cute going from 40% before the report to 80% following the report, depicted in Exhibit 2. Futures labor reports will continue to be a focus as markets try to determine whether the data represents a recalibration or deterioration.
Exhibit 2: Fed Funds Rate Expectations
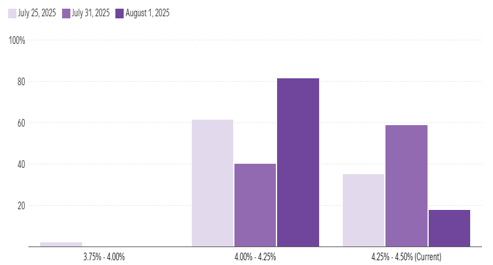
Source: CME FedWatch Tool | Morningstar
The Bottom Line: Payroll data from the previous three months has both surprised and disappointed investors. Expect future data on the labor market health to drive markets as the Fed appears poised to act in the face of economic softening.
Looking Ahead
The Fed’s Important Job
The Federal Reserve has a dual mandate to achieve maximum employment and stable prices. There are numerous tools the Fed can implement to achieve this mandate, but the single-most important tool is setting the interest rate that banks utilize for overnight borrowing, otherwise known as the federal funds rate. This short-term rate influences other interest rates in the market, including those rates that consumers use for home or auto loans, illustrating its far-reaching impacts on the overall economy. The Fed sets a target range for the federal funds rate whereby raising the target range can help slow down an overheating economy and combat inflation, and lowering the target range can help stimulate growth in a weakening economy. Markets obsess over this rate because of its influence on the economy, so much so that they are able to trade on expectations of where the Fed will move the federal funds rate target range, which is what the CME FedWatch tool visualizes, offering important insights into what markets believe and how those expectations are similar (or different) than actual federal funds rate changes.
As of month-end, CME FedWatch is predicting an 86% probability of a 25-bps rate cut at the Fed’s September Federal Open Markets Committee (FOMC) meeting, with current expectations for 1-2 additional 25-bps rate cuts through year-end. This would be the first interest rate cut since December 2024 and would mark a shift in the Fed’s positioning – where since 2022 the primary focus has been inflation to now growing concern about the labor market and a slowing economy. In July, the Fed’s preferred inflation measure, the Personal Consumer Expenditures (PCE) index, was up 2.6% for all prices, and 2.9% for core prices, which exclude volatile food and energy prices. While inflation has declined meaningfully from its highs in 2022, it has proven to be sticky around the 3% level, illustrated in Exhibit 3, and is expected to remain elevated above the Fed’s 2% inflation target as tariffs continue to filter their way through the economy. Despite these trends in inflation, there is growing evidence of a softer labor market, including slowing of both labor supply and demand, which is causing the Fed to finally consider changing their policy stance from more restrictive to expansionary, which Chair Powell discussed during the Jackson Hole Economic Symposium earlier in the month. As the Fed attempts to strike the right balance between their dual mandate, they are also facing intense scrutiny from the Trump Administration, who continues to argue for lower interest rates and is finding ways to interfere with the Fed’s independence.
Exhibit 3: PCE Inflation vs. Fed Target
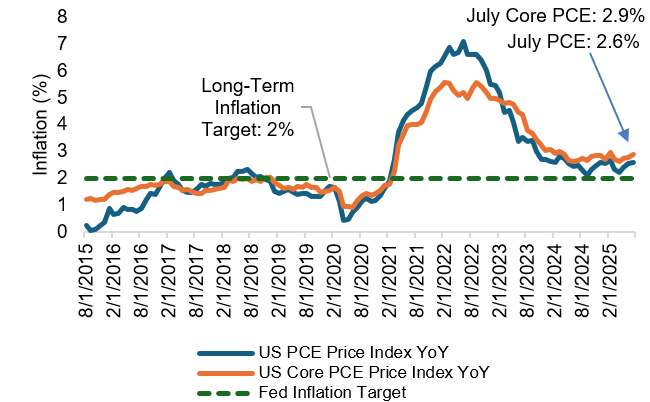
Source: YCharts
The current environment is creating challenges for the Fed and the potential for a “stagflationary” environment, which last occurred in the 1970s, and represents an economy characterized by rising inflation, slowing growth, and high unemployment, a scenario that is extremely difficult for policymakers to address. Looking ahead to the September FOMC meeting, markets will be bracing for an interest rate cut, updated projections from the Fed about measures including inflation, GDP growth, unemployment, and interest rates through the publication of their quarterly Summary of Economic Projections, and mounting pressures from the Trump Administration. In an environment where the consumer is showing signs of weakness, whether through survey data or evidence like rising delinquencies by lower-income consumers, the Fed’s job is ever-important today and the stakes are high, giving investors more reason to obsess over the direction of monetary policy.
The Bottom Line: The Fed’s job of setting monetary policy and influencing the direction of the federal funds rate is an important one, with far-reaching consequences for the U.S. economy and American consumers, and the current environment is posing challenges that warrant monitoring for potentially adverse economic implications.
Capital Markets Themes
What Worked, What Didn’t
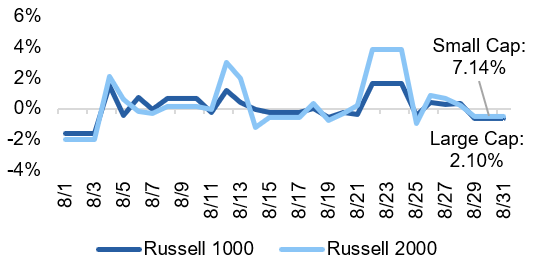
•Small Caps Post Stellar Month: Returning over 7% in August, small cap stocks were buoyed by Fed Chair Powell’s remarks in Jackson Hole, which opened the door to interest rate cuts at their September FOMC meeting. More domestically focused, small cap stocks will likely feel the relief of lower interest rates more drastically than their large cap counterparts.
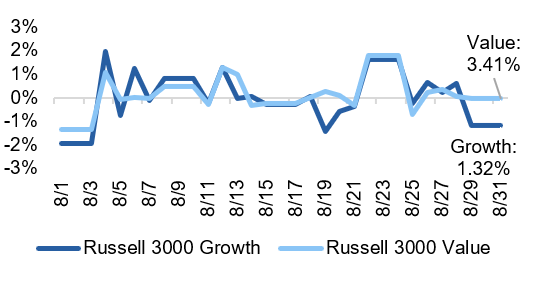
•Value Beats Growth: •After lagging growth since after February, value stocks outperformed in August, with current valuations much more in-line with long-term averages than their growth counterparts today.
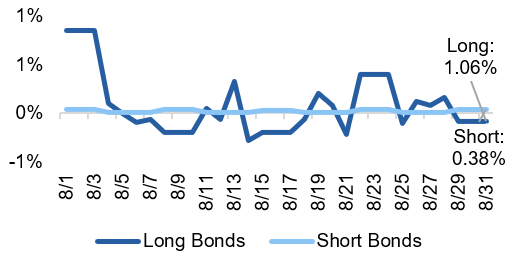
•Better Month for Bonds: After producing negative total returns in July, both corporate and high yield bonds posted returns 1% or better, as yields fell over softer economic data and potentially imminent rate cuts.
Large vs Small Cap Equity
Growth vs Value Equity
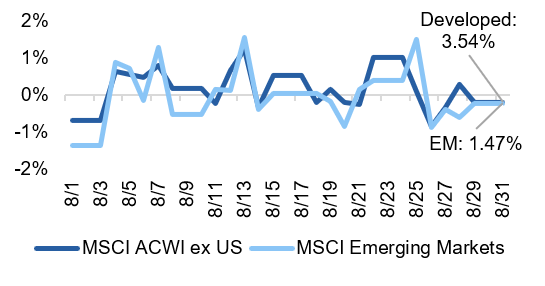
Developed vs Emerging Equity
Short vs Long Duration Bonds
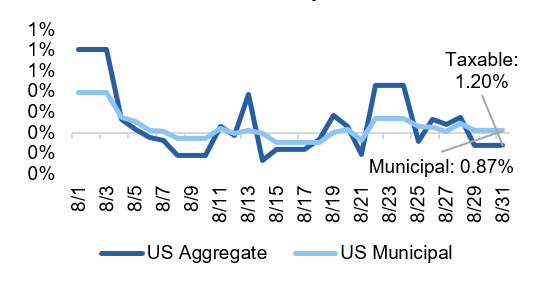
Taxable vs Municipal Bonds
Investment Grade vs High Yield Bonds
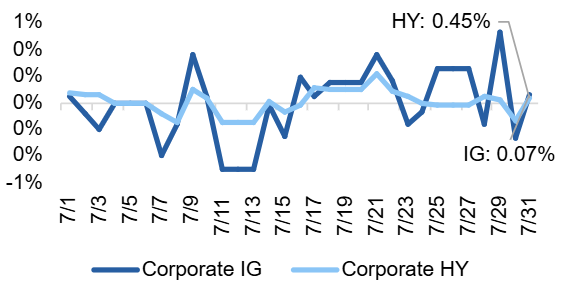
Source: YCharts. Data call-out figures represent total monthly returns.
On Alternatives
How Interest Rates Impact Private Markets
Changes to short-term interest rates are driven by the Fed and monetary policy, whereas longer term interest rates are impacted by the market and trends in the economy. The potential for short-term interest rate cuts by the Federal Reserve in the near future emphasizes the importance of understanding how changes in interest rates have different impacts on different private asset classes, including private equity, credit, and real estate.
Generally, a decline in short-term interest rates corresponds to an increase in transaction activity within the private equity market. Lower short-term interest rates reduce the cost of borrowing, incentivizing deal-making as financing becomes cheaper. Lower interest rates also serve to stimulate economic growth, creating the potential for a more supportive IPO market, which has been stagnant since 2022 during the most recent period of higher interest rates. This point is further illustrated in Exhibit 4, where the median age of firms at IPO has risen to highs not seen since the post-Dot Com Bubble and post-GFC periods. The sharp increase in the median age since 2022 could indicate that higher interest rates have challenged the exit environment. On the other hand, lower interest rates could not only encourage private companies to pursue exits through IPOs or other strategies, but it could also prompt investors to shift away from public assets, like money market funds whose assets have ballooned to over $7 trillion, and into private markets, like private equity, in search of higher returns.
Exhibit 4: Median Age and Average Market Value at IPO
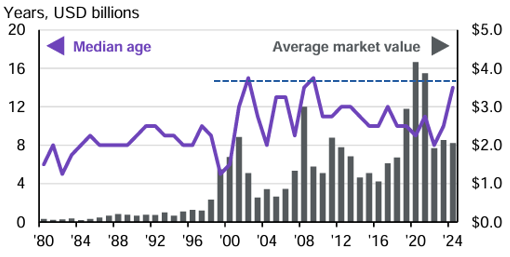
Source: JPM Guide to Alternatives. Data as of May 31, 2025.
In contrast to private equity, lower short-term rates are largely a detractor to returns in private credit markets due to the fact that the majority of private credit assets are floating rate loans. However, lower interest rates can reduce the risk of default by borrowers, potentially increasing credit quality across the private credit spectrum. In a declining rate environment, assessing the relative spread level of private credit versus public market equivalents remains a crucial factor in determining allocation to the asset class. Even in the current environment where spreads are tight, value can be found in the private credit market relative to public bonds.
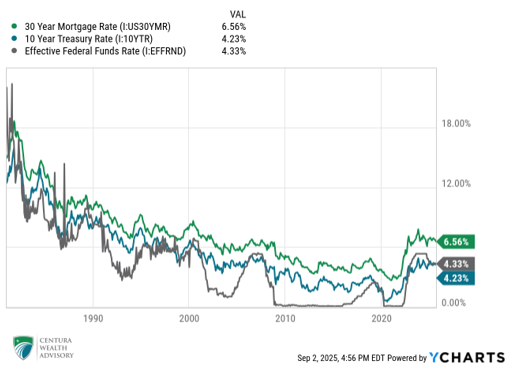
Unlike the private equity and private credit markets, the private real estate market is more heavily influenced by the 10-year Treasury rate, which impacts other real estate metrics like cap rates and mortgage rates, which tend to be longer-term. While short-term interest rates still matter for borrowing costs related to project financing, for example, the 10-year Treasury yield has a more direct impact on mortgage rates, illustrated in Exhibit 5. This relationship calls into question the Trump Administration’s argument calling for lower short-term interest rates to improve mortgage rates, when in fact, it is the state of the fiscal budget, which is tied to government debt like Treasury bonds, that could help improve mortgage rates. Understanding the nuances of interest rate impacts on private markets can help drive decision-making in a changing rate environment, like what the market is anticipating today.
Exhibit 5: Mortgage Rates vs 10-Year Treasury and Effective Fed Funds Rates
The Bottom Line: Declines in short-term interest rates could benefit private equity markets through increased dealmaking activity but will reduce yields in the private credit market. Private real estate markets are tied more closely to the 10-year Treasury yield, causing future Fed interest rate cuts to have potentially less of an impact on property values.
Asset Class Performance Quilt
Markets are ever-changing, making diversification across asset classes and sectors a critical component to portfolio construction. As illustrated below, a Balanced 60/40 portfolio provides greater consistency of returns and less volatility over time.
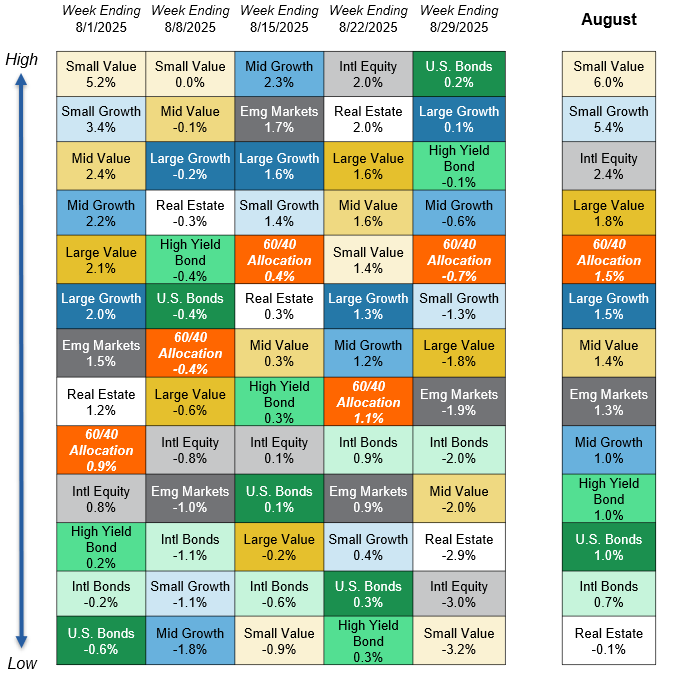
Source: YCharts. Asset class performance is presented using market returns from an exchange-traded fund (ETF) proxy that best represents its respective broad asset class. Returns shown are net of fund fees for and do not necessarily represent performance of specific mutual funds and/or exchange-traded funds recommended by Centura Wealth Advisory. The performance of those funds may be substantially different than the performance of broad asset classes and to proxy ETFs represented here. U.S. Bonds (iShares Core U.S. Aggregate Bond ETF); High Yield Bonds (iShares iBoxx $ High Yield Corp Bond ETF); Intl Bonds (Invesco International Corporate Bond ETF); Large Growth (iShares Russell 1000 Growth ETF); Large Value (iShares Russell 1000 Value ETF); Mid Growth (iShares Russell Mid-Cap Growth ETF); Mid Value (iShares Russell Mid-Cap Value ETF); Small Growth (iShares Russell 2000 Growth ETF); Small Value (iShares Russell 2000 Value ETF); Intl Equity (iShares MSCI ACWI ex US ETF); Emg Markets (iShares MSCI Emerging Markets ETF); and Real Estate (iShares US Real Estate ETF). The return displayed as “60/40 Allocation” is a weighted average of the ETF proxies shown as represented by: 40% U.S. Bonds, 12% International Stock, and 48% Large Blend.

