Market Month in Review – February 2025

At a Glance
Macro Indicators: Headline and core PCE inflation rose by 2.5% and 2.6%, respectively, in January. These increases matched expectations but, combined with higher CPI data, grew consumer worries that inflation may remain elevated. The January jobs report gave mixed signals, with only 143,000 jobs added in the labor market (vs. a 169,000 forecast), but another drop in the unemployment rate to 4.0%. Atlanta Fed GDPNow estimates for Q1 2025 GDP surprisingly turned sharply negative as of month-end.
Trump 2.0: Tariffs dominated headlines over the month, with a 10% tariff on China currently in place and possibly more tariffs coming on countries like Mexico, Canada, and the EU, in addition to reciprocal tariffs.
Fed & Monetary Policy: The Fed continues to reiterate its patient approach to interest rate cuts. The minutes from the January FOMC meeting revealed that tariffs are troubling the Fed, which could potentially result in fewer interest rate cuts than initially projected this year. As of the December “Dot Plot,” Fed officials have projected two 25-bps cuts in 2025.
Equity Markets: Major U.S. indices finished February in the red after a volatile month. The Q4 2024 earnings season is nearly wrapped up, with 97% of companies in the S&P 500 having already reported. The current quarterly earnings growth rate on a year-over-year basis is 18.2%, well above initial expectations.
Asset Class Performance
Somewhat surprisingly, Trump’s tariff announcements over the month hit U.S. equity markets hardest, whereas international equity markets posted modest growth. Real estate was the best performer over the month, a likely result of heightened inflation expectations, and bond markets saw positive growth, with investment grade outperforming high yield.
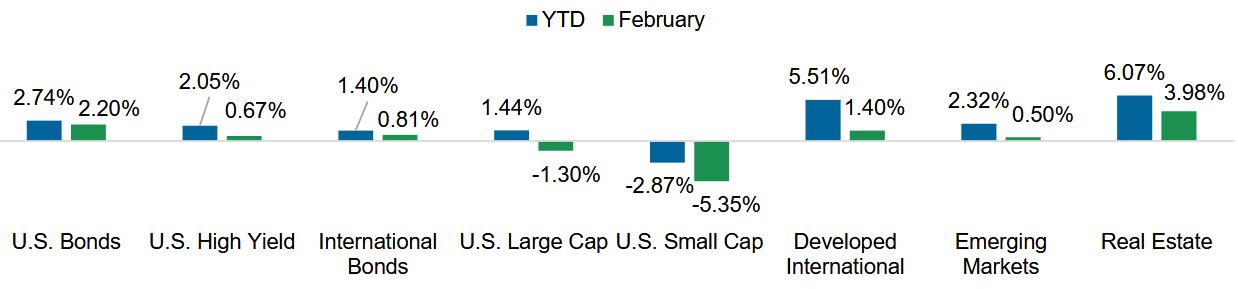
Source: YCharts. Asset class performance is presented using total returns for an index proxy that best represents the respective broad asset class. U.S. Bonds (Bloomberg U.S. Aggregate Bond TR), U.S. High Yield (Bloomberg U.S. Corporate High Yield TR), International Bonds (Bloomberg Global Aggregate ex-USD TR), U.S. Large Cap (S&P 500 TR), U.S. Small Cap (Russell 2000 TR), Developed International (MSCI ACWI ex US TR), Emerging Markets (MSCI EM TR), and Real Estate (Dow Jones U.S. Real Estate TR).
Markets & Macroeconomics
Trump’s Approach to Tariffs
February brought lots of action on the tariff front. President Trump applied tariffs on China (with possibly more to come) and threatened tariffs on neighboring countries Canada and Mexico, as well as commodities, like aluminum and steel. The administration also launched an investigation into the trading practices of copper, and in retaliation from impacted countries, Trump announced potential “reciprocal” tariffs, which could affect U.S. goods like electronics, motor vehicles, and pharmaceuticals. While most of these policies have not been implemented, taken in total, they could push tariff rates to their highest level since the 1930s, begging the questions: why higher tariffs now and should markets be concerned?
In answering the first question, it is important to remember that a tariff is a tax on imports, which typically raises prices for domestic consumers, but, theoretically, allows domestic producers to better compete globally – a stance that supports Trump’s “Make America Great Again” mantra. Higher tariffs should support domestic production of goods, making the U.S. less reliant on imports, hopefully to the dual benefit of promoting U.S. manufacturing and reducing the country’s trade deficit, which has been in deficit since the 1970s, illustrated in Exhibit 1. Trump’s tariffs are also meant to curb “national security” threats, including illegal immigration and drug trafficking, from places like China, Canada, and Mexico. When Trump focuses on “national security” measures, he is using tariffs as more of a negotiating tactic to end unfair trade practices and impose stricter border controls, all while producing government revenue to offset spending in other areas of his fiscal policy agenda. Whether or not all of Trump’s proposed tariffs will be implemented, there is no doubt that higher tariffs represent a departure from the low tariff environment that characterized much of the American 20th century, illustrated in Exhibit 2.
Exhibit 1: U.S. Goods Trade Balance to GDP
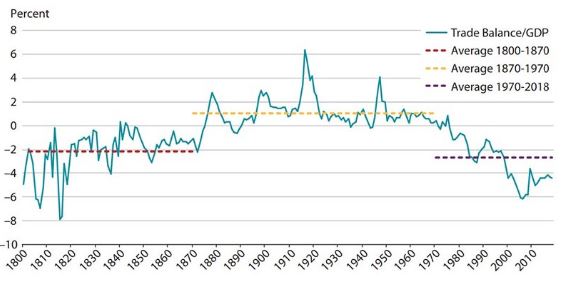
Source: Federal Reserve Bank of St. Louis
Tariffs in the context of 2025, however, have introduced concerns on their impact to inflation and economic expansion. So, should markets be concerned? The answer boils down to maybe. Tariffs can increase prices for the domestic consumer, and while this doesn’t always have a broader inflationary impact, they could threaten the progress the U.S. has made on inflation in the past two years, which investors worry could result in a potential slowdown in growth. If tariffs are indeed being used as a negotiating tactic, it could also spark trade wars with key trading partners (think China), which could have more lasting economic impacts. As with anything related to politics, uncertainty is perhaps the only thing that is certain, and investors should continue to focus on the potential economic impacts of tariffs while filtering through the political noise as best as possible. Tariffs are not the end of the world, but American consumers may feel some pain if (and when) implemented.
Exhibit 2: U.S. Average Effective Tariff Rate
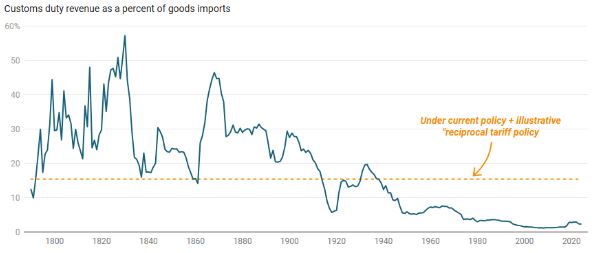
Source: The Budget Lab
The Bottom Line: Tariffs are being used by the Trump Administration as a negotiating tactic to promote his “Make America Great Again” agenda and generate additional revenue for the government, prompting concerns from investors on the economic impacts to inflation and growth. The actual impact of tariffs remains uncertain, particularly as Trump continues to add to the tariff pile, potentially sparking trade wars with unknown timing and outcomes.
Looking Ahead
The Consumer Turns Gloomy
The American consumer has endured a great deal over the past few years: higher interest rates, which have raised financing costs (including the cost of owning a home), as well as inflation, which has resulted in higher prices in almost every pocket of the economy. Despite these trends, the consumer has remained steadfast in their spending and stayed relatively positive about the state of the U.S. economy, but uncertainty related to both fiscal and monetary policy in 2025 is causing the consumer to re-evaluate everything. There are multiple surveys and indicators that measure consumer confidence and expectations, which can provide important insight into what consumers are thinking, which is ultimately what drives consumer behavior and subsequently market performance and economic growth
Exhibit 3: Consumer Inflation Expectations
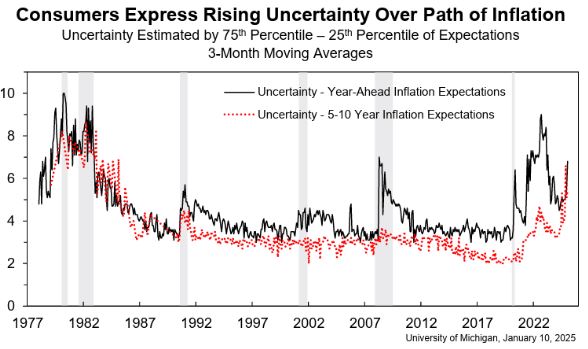
Source: The University of Michigan
The latest Consumer Confidence Index reading came in below forecasts, registering the largest decline since 2021. Similarly, the University of Michigan’s survey of consumer inflation expectations signified heightened uncertainty surrounding future inflation, illustrated in Exhibit 3. The results of these two surveys indicate that consumers have become more pessimistic about the future economy, and this is likely driven by multiple factors, including stubborn inflation that is causing the Fed to keep interest rates at current levels, in addition to a high degree of uncertainty coming from the White House, with policies that could negatively impact both inflation and growth.
Additionally, the yield curve, which normalized in August 2024 after being inverted for over 2 years, re-inverted in the 10-year to 3-month portion of the curve on February 26. Yield curve inversions are a well-known recession indicator, and the latest inversion added fuel to the consumer-gloom-fire. While the latest consumer data is concerning, the danger with measuring expectations is that they can sometimes become a self-fulfilling prophecy. Today, history can provide an important lesson and perhaps a potential opportunity: when consumer confidence bottoms, positive equity market returns have typically followed, illustrated in Exhibit 4.
Exhibit 4: Consumer Confidence vs. S&P 500
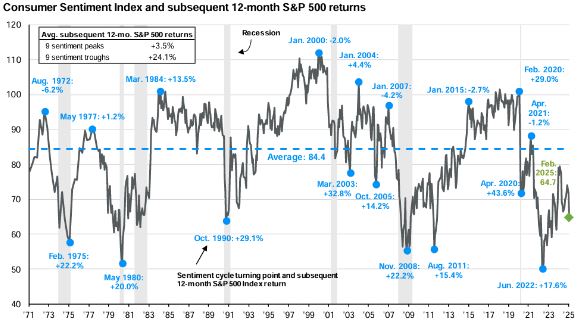
Source: J.P. Morgan Guide to the Markets
Even when consumer sentiment is negative, it remains critical to stay invested in markets because exiting the market could mean missing out on potential strong equity returns, like what was witnessed after the 2022 equity market bottom. Whether the U.S. is headed for a recession will depend on macroeconomic variables like inflation, the labor market, and GDP growth, not the results of consumer surveys, even though they can provide insights. Despite what consumers may believe, the U.S. economy is still faring relatively well, and while that doesn’t mean there aren’t risks, monitoring the incoming data and staying diversified will remain critical in both the current and future environments.
The Bottom Line: The most recent readings of consumer surveys indicate growing pessimism about the future state of the U.S. economy, but investors should remember that markets are subject to extremes, and it is better to stay prudently invested during these times of uncertainty to avoid missing out on the positive equity returns that can follow.
Capital Markets Themes
What Worked, What Didn’t
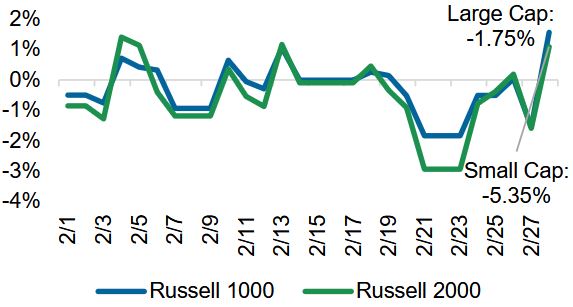
•Values Bests Growth (Again): Growth stocks continue to struggle in 2025, as AI and Mag 7 darlings couldn’t keep pace with high market expectations, continuing to support the story of equity market breadth, or broader participation.
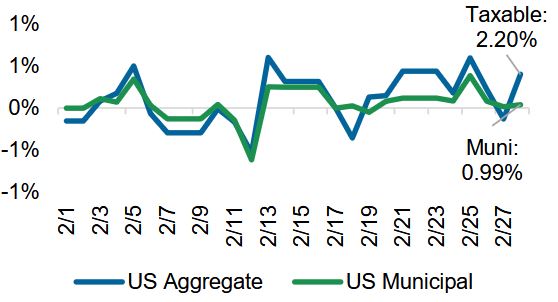
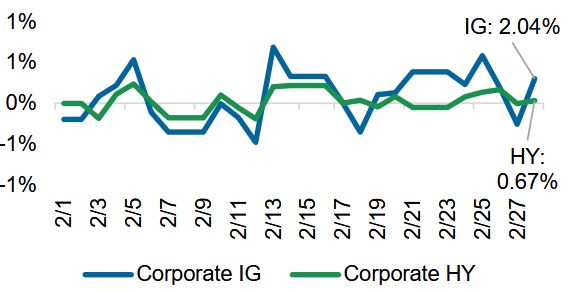
•Flight to Quality: Investment-grade bonds outperformed high-yield counterparts by about 130 bps over the month, emphasizing the importance of maintaining core exposure to bonds.
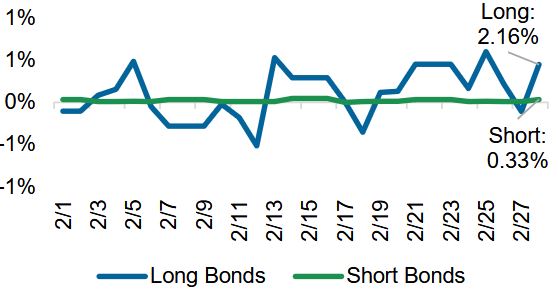
•Long Duration Looks Favorable: Longer-duration bonds performed well over the month, an important reminder that this positioning stands to benefit from an investor flight to safety and even interest rate cuts.
Large vs Small Cap Equity
Growth vs Value Equity

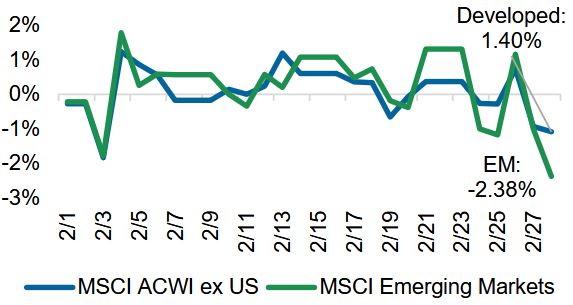
Developed vs Emerging Equity
Short vs Long Duration Bonds
Taxable vs Municipal Bonds
Investment Grade vs High Yield Bonds
Source: YCharts. Data call-out figures represent total monthly returns
On Alternatives
Private Versus Public Equities
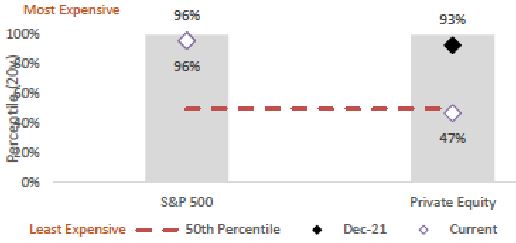
Public equity valuations remain rich, with the S&P 500 trading at 21.2x forward earnings as of month-end, above both the 5- and 10-year averages of 19.8x and 18.3x, respectively. Looking under the hood, the top 10 stocks in the index have a combined price-to-earnings ratio of 26.7x. The current state of public equity markets highlights the need for diversification in other, more favorably valued markets.
Looking at the broad private equity asset class, valuations are certainly more favorable, trading in the 47th percentile versus the 96th percentile for the S&P 500, illustrated in Exhibit 5. Looking only at valuations, private equity appears to be the more attractive choice, particularly when considering the level of concentration in technology stocks in public markets today. However, just as investors want to diversify concentration risk in the public tech sector, private equity markets are also dealing with their own concentration struggles as it relates to the limited partner (LP) secondary market.
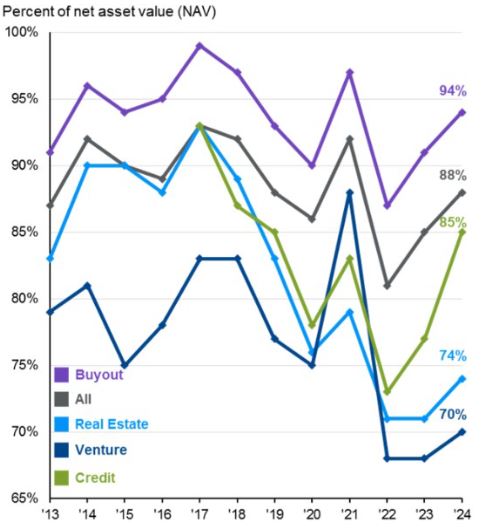
The secondary market facilitates the trading of stakes in private equity funds by LPs, or investors, in those funds. This market has witnessed a surge in demand, resulting in higher, and, in many cases, less favorable pricing, with all secondary-focused funds trading at 88% of net asset value as of the most recent data, illustrated in Exhibit 6.
Exhibit 5: Equity Valuation Percentiles
Source: Bow River Capital
This supply/demand imbalance in the secondary market is a direct result of the slow exit environment seen in recent years, which has forced LPs to source liquidity in other parts of the market, like secondaries, often at a discount. General partner (GP)-led secondary funds have also seen increased interest, illustrated by record fundraising for private equity behemoths Ardian and Lexington, who raised a combined $51 billion last year. This surge in fundraising has added to demand pressures in the secondary space, making the asset class less attractive than other parts of private equity.
On the macro front, elevated interest rates are not helping the current situation, but Trump’s potential deregulation policies could incentivize activity in the initial public offering (IPO) market, which may help accelerate exits and bring much-needed supply to the private equity market. Investors don’t want to wait indefinitely for interest rates to drop or for a more favorable regulatory environment, and while parts of both public and private equity markets are overvalued today, opportunities still exist.
When valuations are high and activity is concentrated in one sector of the market, selectivity and quality become even more important, as does managing concentration risks—regardless of whether an investor is looking at private or public markets.
Exhibit 6: LP Secondary Portfolio Pricing
Source: J.P. Morgan Guide to Alternatives
The Bottom Line: Whether investors are looking at public or private markets, valuations and concentrations remain a critical determinant in the investment decision-making process, with caution warranted in the overvalued parts of any market, like tech in public equity and secondaries in private equity markets today.
Asset Class Performance Quilt
Markets are ever-changing, making diversification across asset classes and sectors a critical component of portfolio construction. As illustrated below, a Balanced 60/40 portfolio provides greater consistency of returns and less volatility over time.
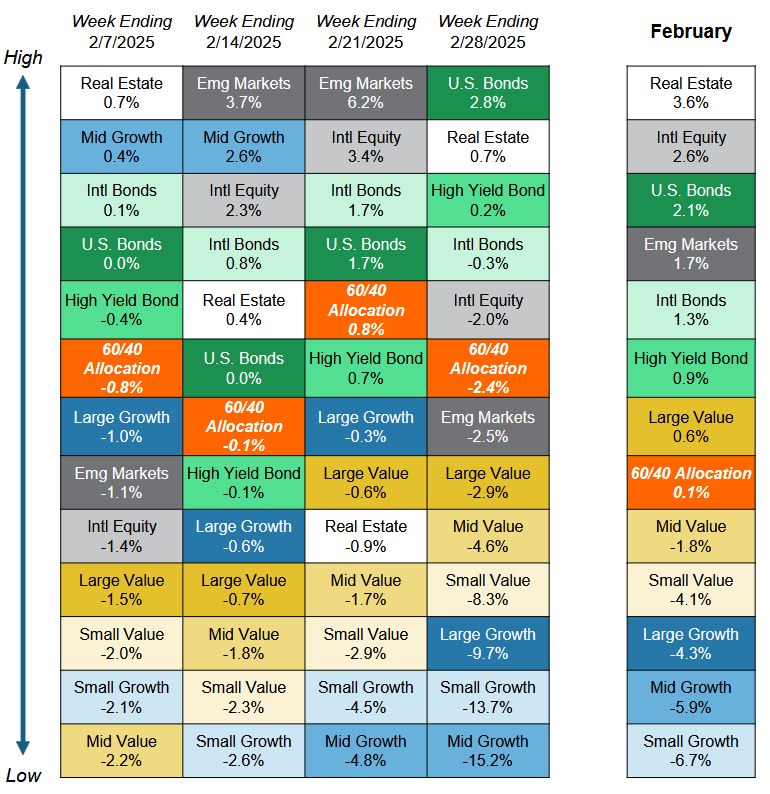
Source: YCharts. Asset class performance is presented using market returns from an exchange-traded fund (ETF) proxy that best represents its respective broad asset class. Returns shown are net of fund fees for and do not necessarily represent performance of specific mutual funds and/or exchange-traded funds recommended by Centura Wealth Advisory. The performance of those funds may be substantially different than the performance of broad asset classes and to proxy ETFs represented here. U.S. Bonds (iShares Core U.S. Aggregate Bond ETF); High Yield Bonds (iShares iBoxx $ High Yield Corp Bond ETF); Intl Bonds (Invesco International Corporate Bond ETF); Large Growth (iShares Russell 1000 Growth ETF); Large Value (iShares Russell 1000 Value ETF); Mid Growth (iShares Russell Mid-Cap Growth ETF); Mid Value (iShares Russell Mid-Cap Value ETF); Small Growth (iShares Russell 2000 Growth ETF); Small Value (iShares Russell 2000 Value ETF); Intl Equity (iShares MSCI ACWI ex US ETF); Emg Markets (iShares MSCI Emerging Markets ETF); and Real Estate (iShares US Real Estate ETF). The return displayed as “60/40 Allocation” is a weighted average of the ETF proxies shown as represented by: 40% U.S. Bonds, 12% International Stock, and 48% Large Blend.

