Market Month in Review – February 2026

At a Glance
Macro Indicators: The economic backdrop remains solid but is getting bumpier. Inflation remains stubbornly above the Fed’s 2% target and chaotic tariff policy is only adding fuel to that fire. Growth is slowing, with GDP decelerating from 2.8% in 2024 to 2.2% in 2025, and Q4 coming in at a soft 1.4%. Meanwhile, the labor market is quietly losing steam, with unemployment hitting 4.3% in January as AI-driven job cuts move from headline risk to reality.
Trump 2.0: The Supreme Court dealt the Administration a legal blow, ruling its IEEPA tariffs unconstitutional, but the White House pivoted fast, slapping a 10% tariff back on under a different law (Section 122 of the Trade Act of 1974). The clock is now ticking as Congress has 150 days to approve an extension of the tariffs, setting up a high-stakes vote in the middle of re-election season. On the geopolitical front, a joint U.S.-Israel military operation in Iran resulted in the assassination of Iran’s Supreme Leader, sending geopolitical risk sharply higher and putting global markets on edge to end the month.
Fed & Monetary Policy: Rates are expected to stay on hold through the end of Chair Powell’s tenure. His likely successor, Kevin Warsh, is expected to come in with a rate-cutting bias and a desire to slim down the Fed’s balance sheet, but the macro data may threaten these plans.
Capital Markets: February was a rough month for U.S. stocks, which saw broad declines, with investors quietly rotating out of last year’s darlings (tech and financials) and into energy and materials. Meanwhile, international equities kept outpacing domestic ones, with emerging markets standing out as a particularly attractive pocket of value. On the fixed income side, yields held relatively steady and credit spreads remain tight by historical standards.
Asset Class Performance
U.S. large cap equities posted negative returns in February as AI pressures prompted sell-offs in the technology and financials sectors. Longer-term Treasury yields declined over the month, contributing to positive total returns. International equities continued their run-up, driven by Asian markets.
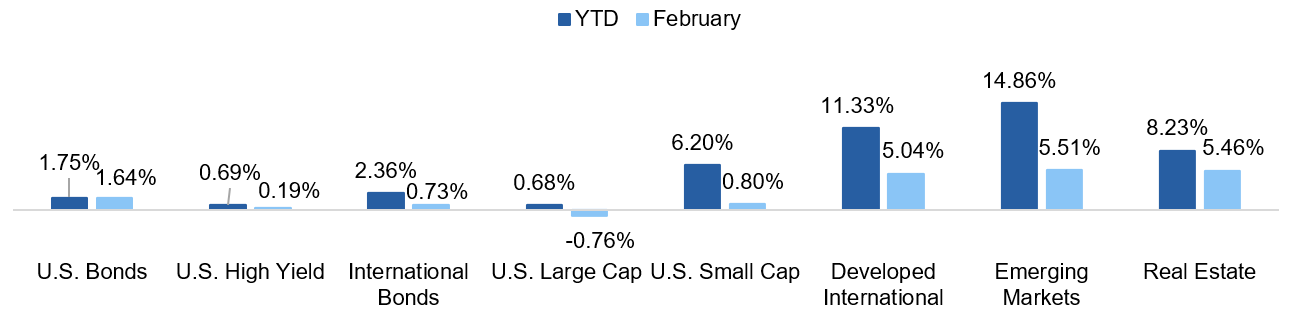
Source: YCharts. Asset class performance is presented using total returns for an index proxy that best represents the respective broad asset class. U.S. Bonds (Bloomberg U.S. Aggregate Bond TR), U.S. High Yield (Bloomberg U.S. Corporate High Yield TR), International Bonds (Bloomberg Global Aggregate ex-USD TR), U.S. Large Cap (S&P 500 TR), U.S. Small Cap (Russell 2000 TR), Developed International (MSCI ACWI ex US TR), Emerging Markets (MSCI EM TR), and Real Estate (Dow Jones U.S. Real Estate TR).
Markets & Macroeconomics
A Lot to Digest
One year into President Trump’s second term and markets have been taken on a wild ride, and February was no exception. The Supreme Court struck down IEEPA tariffs, but the White House didn’t skip a beat: a new 10% tariff was back in place almost immediately, this time under a different law (Section 122 of the Trade Act of 1974). The message? Tariffs aren’t going anywhere. The catch? Section 122 tariffs expire after 150 days unless Congress votes to extend them. That vote lands in mid-July – right in the middle of re-election season, with midterms in November. Expect politics to get very tangled with policy as we progress through the year.
Exhibit 1: Effective Federal Funds Rate
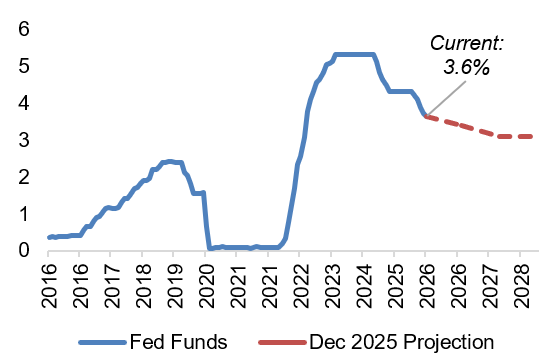
Sources: FRED, Federal Reserve Board
On the rates front, uncertainty continues to be the name of the game. Current Fed Chair Powell is on his way out, with Kevin Warsh set to take the helm in May. Fed officials expect interest rates to settle around 3.0% by the end of 2028, illustrated in Exhibit 1, but the road there is anything but clear. Normally, slowing growth and a softening job market would be a green light to cut rates. However, tariffs and fiscal policy continue to pose challenges for the Fed, meaning any hint of rising inflation could pump the brakes on cuts entirely. Warsh has also made no secret of wanting to shrink the Fed’s balance sheet, a move that would effectively tighten financial conditions even if rates are being cut. Per usual, the path forward for monetary policy remains unclear and highly dependent on macroeconomic data.
Exhibit 2: Year-to-Date Equity Sector Returns
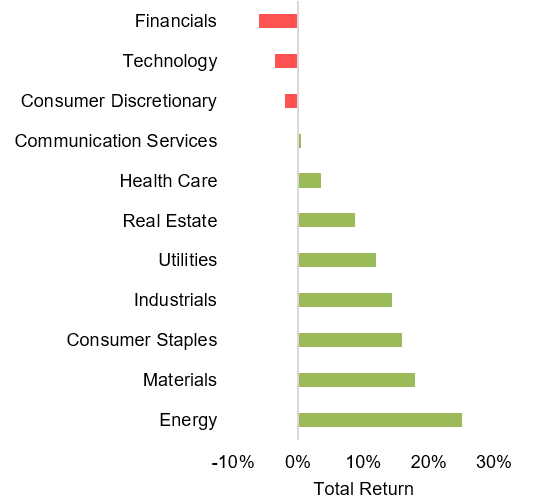
Source: YCharts. Data through 2/28/26.
AI is still the topic du jour, but lately it has become a source of turbulence, not just excitement. Some of last year’s biggest winners, like the financials and tech sectors, have flipped to become the worst performers this year, illustrated in Exhibit 2. And just when markets had enough to chew on, geopolitical turmoil reared its ugly head with fresh conflict in Iran to end the month. Middle East instability and oil prices have a long history together, and a prolonged conflict in the region could stoke domestic inflation just as these concerns had started to fade, reigniting not just the potential for further price increases, but the dreaded stagflationary environment. So how should investors make sense of all this? The short answer is stay diversified and look for value rather than just safety. One of the most important things to keep in mind is that markets don’t move on headlines, they move on surprises. The risks everyone is already talking about? They are largely priced in. The real wildcard is always the risk nobody is modeling yet.
The Bottom Line: The market continues to digest a lot – tariff turmoil, Fed leadership changes, midterm election build-up, geopolitical risk, and AI implications – but the real danger isn’t what’s making headlines; it’s what isn’t, making valuations and current market expectations the most important things for investors to keep in focus.
Looking Ahead
Where Are We in the Market Cycle?
The business cycle refers to the natural fluctuations in the economy over time, implying that the economy moves through periods of expansion and contraction. The business cycle is broadly comprised of four stages: recovery, expansion, late cycle, and recession. There is no set length of a business cycle, meaning the only way we can determine where we are in the cycle is by looking for clues. Right now, the clues are increasingly pointing to a late cycle environment.
What does late cycle look like? This cycle stage is broadly characterized by slowing economic growth, tighter monetary policy, pricey markets, and widening credit spreads. More anecdotally, this stage can also be characterized by excess – leverage, investor exuberance, and a “nothing can go wrong” attitude, characteristics we are seeing in today’s environment. On the valuation front, the numbers are hard to ignore. The Shiller Cyclically Adjusted P/E or “CAPE” ratio, widely considered the gold standard for measuring whether stocks are cheap or expensive, is at levels only seen once before in history: early 2000, right before the Dot-Com bubble burst, illustrated in Exhibit 3. While there is real earnings growth propping up these valuations, history suggests these stretched ratios are far more likely to come down than go higher moving forward.
Exhibit 3: Historical CAPE Ratio for the S&P 500
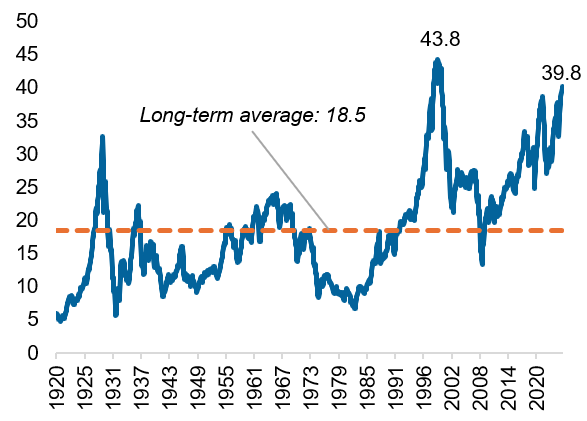
Source: YCharts
The credit markets are flashing similar signals of excess and late cycle behavior. The biggest AI players are spending at eye-watering levels to build out infrastructure, and they are increasingly borrowing to do it. These companies have historically had fortress balance sheets and ratcheting up debt issuance will naturally reduce the quality of their financial statements. Some hyperscalers, like Meta, are even using Special Purpose Vehicles to keep debt off their balance sheets – a type of financial engineering that is classic late cycle behavior. While some of these trends may raise eyebrows, including increasing investment grade spreads in the tech sector, illustrated in Exhibit 4, late cycle doesn’t mean sell everything. Stages of the business cycle can last longer than anyone expects, but it does warrant attention from investors with February’s market rotation serving as a preview. Investors are already quietly repositioning toward tomorrow’s opportunities, but the playbook here isn’t to chase what has been hot, but rather to stay anchored to valuations and think about where you want to be when the cycle turns.
Exhibit 4: Investment Grade (IG) Index vs. IG Tech Spreads
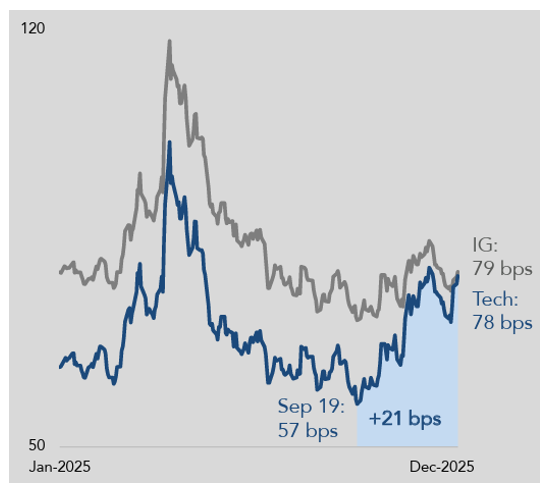
Source: MUFG
The Bottom Line: Today’s market is flashing a late cycle warning with stretched valuations and rising leverage. Rather than chase yesterday’s winners, investors should be thinking about valuations and where they want to be positioned when the music stops.
Capital Markets Themes
What Worked, What Didn’t
•Value Continues its Outperformance: Growth stocks had another rough month as lofty tech valuations continued to deflate, a trend that has been gaining steam since late 2025.
•Long Duration Looks Attractive: With uncertainty running high, investors fled to safety and pushed further out on the yield curve, rewarding long duration bonds with a 1.82% return in February.
•Large Cap Equities Falter: U.S. large cap equities slipped into the red as investors rotated away from risk assets. The culprits? A trifecta of fiscal policy uncertainty, geopolitical tensions, and AI-driven disruption. The trade that worked for years is showing cracks.
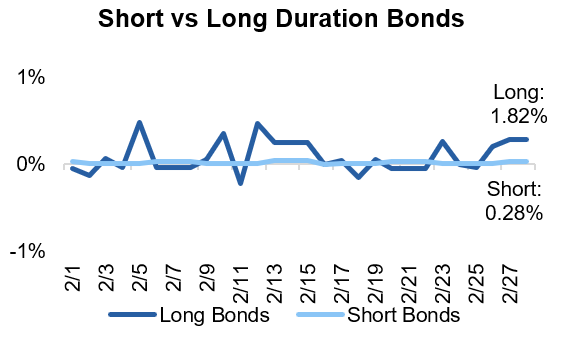
Source: YCharts. Data call-out figures represent total monthly returns.
On Alternatives
The Basics of BDCs
Business development companies or “BDCs” have been in the headlines recently, prompting an explainer on what they are, why investors like them, and why they have been coming under pressure. At their core, BDCs pool investor money and either lend it out or take equity stakes in small and mid-sized businesses that cannot easily do business with a big bank. They are required to pay out at least 90% of their taxable income as dividends, which makes them a natural fit for income-hungry investors. Some BDCs trade on public exchanges with a daily price, while others are non-traded and harder to access. The appeal for retail investors is high yields, but these yields typically come with a more concentrated portfolio. BDCs are not known to spread risk across hundreds of positions – instead, they are more concentrated in specific sectors and parts of the capital stack. This type of approach is fine in calm markets, but in choppy ones, there is no natural cushion when something goes wrong. Additionally, loans are typically more difficult to trade than stocks, creating additional difficulties when everyone heads for the exit at once.
Exhibit 5: Composition of BDC Exposure
Source: Financial Times
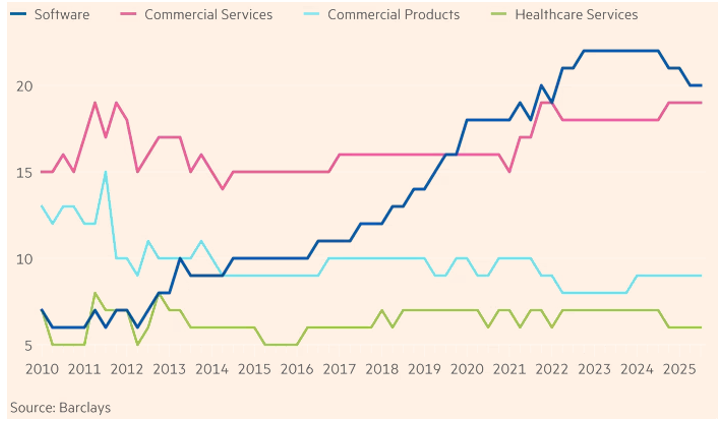
So why are BDCs in the news today? Over the past decade, they have steadily loaded up on software companies – and for good reason. Enterprise software historically has had low default rates thanks to sticky customers and a predictable, recurring revenue stream, prompting BDCs to increase their exposure, illustrated in Exhibit 5. With rapid advancements in AI in recent months, this thesis is starting to crack open, threatening not just the revenues of these software companies, but their existence as a whole. While the AI-driven sell-off in BDCs began in earnest in mid-2025, illustrated in Exhibit 6, it has accelerated in recent weeks, fueling headlines. Importantly, the structure of BDCs has played a role in this sell-off – the combination of daily pricing, a concentration in illiquid underlying holdings, and a roughly 20% exposure to software created the perfect storm. The lesson here is not that BDCs are bad investments, but that an investment’s vehicle is an important consideration. Put another way, investors should be reminded that it is not simply what you own that matters, but how you own it. When markets get jittery and everyone rushes for the door at once, structure matters just as much as substance.
Exhibit 6: BDC 1-Year Trailing Performance
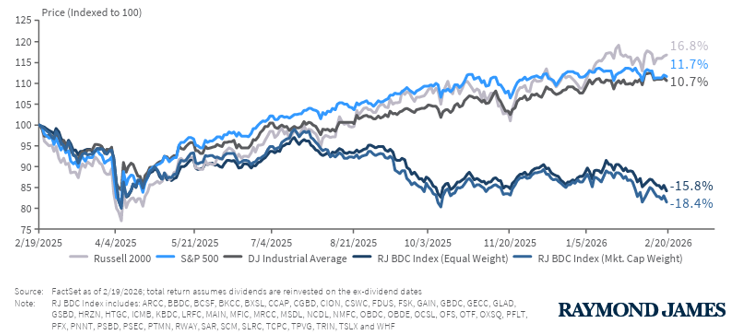
The Bottom Line: Publicly traded BDCs have experienced drawdowns recently thanks to their heavy concentration in software, a sector now squarely in AI’s crosshairs, and the resulting sell-off is a masterclass in why vehicle selection matters just as much as manager selection, especially in private markets.
Asset Class Performance Quilt
Markets are ever-changing, making diversification across asset classes and sectors a critical component to portfolio construction. As illustrated below, a Balanced 60/40 portfolio provides greater consistency of returns and less volatility over time.
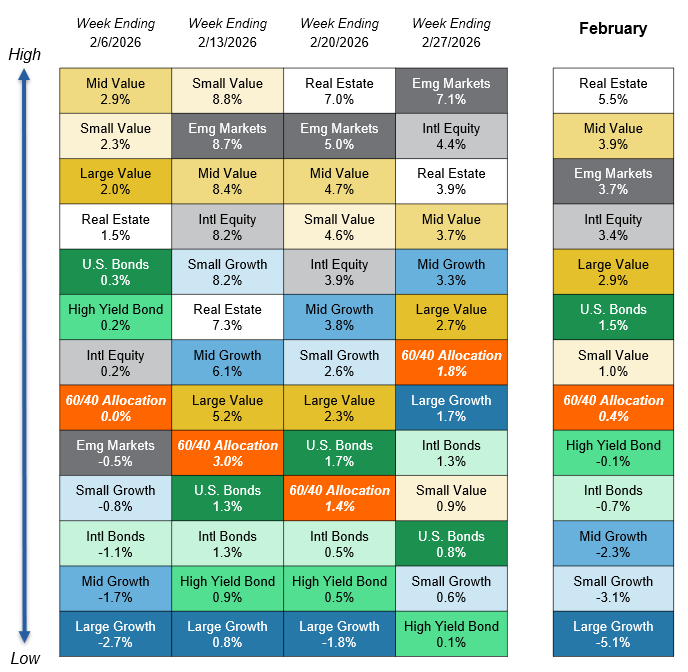
Source: YCharts. Asset class performance is presented using market returns from an exchange-traded fund (ETF) proxy that best represents its respective broad asset class. Returns shown are net of fund fees for and do not necessarily represent performance of specific mutual funds and/or exchange-traded funds recommended by Centura Wealth Advisory. The performance of those funds may be substantially different than the performance of broad asset classes and to proxy ETFs represented here. U.S. Bonds (iShares Core U.S. Aggregate Bond ETF); High Yield Bonds (iShares iBoxx $ High Yield Corp Bond ETF); Intl Bonds (Invesco International Corporate Bond ETF); Large Growth (iShares Russell 1000 Growth ETF); Large Value (iShares Russell 1000 Value ETF); Mid Growth (iShares Russell Mid-Cap Growth ETF); Mid Value (iShares Russell Mid-Cap Value ETF); Small Growth (iShares Russell 2000 Growth ETF); Small Value (iShares Russell 2000 Value ETF); Intl Equity (iShares MSCI ACWI ex US ETF); Emg Markets (iShares MSCI Emerging Markets ETF); and Real Estate (iShares US Real Estate ETF). The return displayed as “60/40 Allocation” is a weighted average of the ETF proxies shown as represented by: 40% U.S. Bonds, 12% International Stock, and 48% Large Blend.
