Market Month in Review – January 2025

At a Glance
Macro Indicators: Headline and core PCE inflation increased 2.6% and 2.8%, respectively, in December 2024. The increases were in line with expectations but strengthen concerns that inflation will remain sticky. The December jobs report showed continued strength in the labor market, with jobs added exceeding expectations by over 100,000. The unemployment rate fell slightly from the prior month from 4.2% to 4.1%. After expanding 2.3% in 4Q, GDP grew 2.8% in 2024, signaling a relatively strong economy despite higher interest rates. Trump & Geopolitics: As of month-end, tariffs are expected to be levied on Mexico, Canada, and China, fueling the start of a potential trade war with uncertain impacts.
Trump & Geopolitics: As of month-end, tariffs are expected to be levied on Mexico, Canada, and China, fueling the start of a potential trade war with uncertain impacts.
Fed & Monetary Policy: After cutting 100 bps between September and December 2024, the Fed held rates steady at their January Federal Open Markets Committee (FOMC) meeting, reiterating their “higher for longer” narrative and dependency on macro data like inflation and jobs.
Equity Markets: Tech stocks witnessed volatility in January with the publication of a report from DeepSeek, an emerging artificial intelligence (AI) technology out of China. Key players, like Nvidia, lost more than 17% from the report, an important reminder that competition will be rampant as companies look to develop and incorporate AI, making portfolio diversification imperative to help protect against potential downside risks.
Asset Class Performance
Despite volatility surrounding President Trump’s return to office in January, positive monthly returns were posted across all asset classes with the largest gains coming from equity markets. Developed international performed the best over the month largely due to strong company fundamentals, and U.S. markets were up over 2.5% across both large and small-cap stocks.
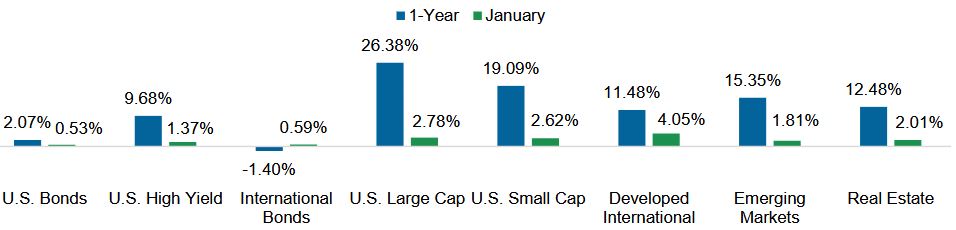
Source: YCharts. Asset class performance is presented using total returns for an index proxy that best represents the respective broad asset class. U.S. Bonds (Bloomberg U.S. Aggregate Bond TR), U.S. High Yield (Bloomberg U.S. Corporate High Yield TR), International Bonds (Bloomberg Global Aggregate ex-USD TR), U.S. Large Cap (S&P 500 TR), U.S. Small Cap (Russell 2000 TR), Developed International (MSCI ACWI ex US TR), Emerging Markets (MSCI EM TR), and Real Estate (Dow Jones U.S. Real Estate TR).
Markets & Macroeconomics
Data Dependency Strikes Again
In the current environment, the Fed continues to reiterate its “data dependent” mode, with their January Federal Open Markets Committee (FOMC) statement expressing, “the Committee will carefully assess incoming data, the evolving outlook, and the balance of risks” in determining the future path of monetary policy. The Fed is expected to keep interest rates at current levels until a catalyst emerges to support lower rates, which will likely come from inflation, the labor market, or GDP. Inflation data, including both PCE and CPI, increased relatively in line with market expectations in December 2024 but remains elevated above the Fed’s 2% inflation target. Core PCE, which excludes more volatile food and energy costs, increased 2.8% in December 2024 on a year-over-year basis, the third month in a row it has logged a 2.8% growth rate. Certainly, the “last mile of inflation” is proving difficult, supporting the Fed’s decision to hold interest rates steady.
This stickiness has ignited concerns that market inflation expectations are being re-anchored to a higher level long-term, which is illustrated by the rise in the 10-year Treasury yield, which partially reflects inflation expectations (among many other factors) and reached 4.8% earlier this month after falling back down to 4.5% by month-end, depicted in Exhibit 1. The Fed’s decision-making is also highly dependent on the health of the labor market, which remains strong. While this is a good thing, the market interprets this as bad news because it does not justify lower interest rates and ultimately keeps the Fed on pause.
Exhibit 1: 10-Year Treasury Yield
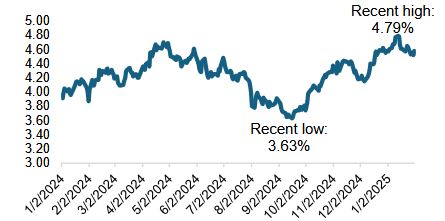
Source: YCharts
The Fed remains hyper-focused on the impact of inflation and the labor market on the U.S. economy, and, in turn, markets remain dependent on the Fed and its actions (or inactions) with interest rates. Complicating matters today, data dependencies have also arisen from the onslaught of data and news coming out of the White House, as well as data in equity markets related to earnings or market reports. On the latter, we recently witnessed the vulnerability of major U.S. indices, particularly the tech-heavy Nasdaq-100, when a report was published on a new artificial intelligence (AI) technology out of China, called DeepSeek, a competitor to AI giants in the U.S., like OpenAI, the creator of ChatGPT. The report, which was published on January 27, reverberated through markets, sending the Mag 7 darling and chipmaker, Nvidia, to close down nearly 17%, illustrated in Exhibit 2, resulting in nearly $600 billion of market cap lost – the largest single-day loss ever – due to the report’s claim that DeepSeek cost a fraction to build versus U.S. models, potentially threatening the future profitability of a chipmaker like Nvidia. The lesson learned from the DeepSeek drama is that competition will be rampant in the AI space, and this competition will continue to disrupt equity market performance as winners and losers are identified in the AI arms race, making diversification away from tech concentrations an important theme in 2025.
Exhibit 2: Impact of DeepSeek Report
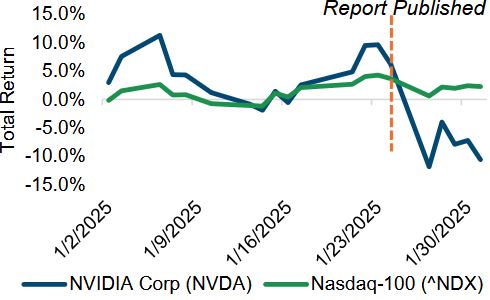
Source: YCharts
The Bottom Line: Markets today are highly dependent on data, whether it be from the Fed, macroeconomic indicators, the White House, or the latest in AI technologies. These dependencies create hyper-sensitive markets prone to volatility, which is expected to be a continuing theme in 2025
Looking Ahead
Trump 2.0 – Tariffs, Tax Policy & Uncertainty
As Trump entered office on January 20, he signed 24 executive orders, the most any President has signed on their first day in office, illustrated in Exhibit 3, setting an important precedent that he intends to fiercely pursue his policy agenda. Despite Republicans holding a slim majority in the House and Senate, Trump’s aggressive policies will likely face opposition, making the overall success of his agenda uncertain. As his policies take shape over the coming weeks and months, investors should stay informed and cautious about making portfolio changes based on speculation or promises made by the government, focusing instead on the known facts.
Exhibit 3: Executive Orders Signed First Day
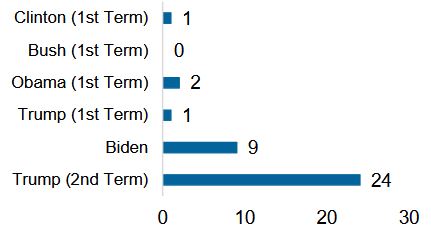
Source: Federal Register
What we do know is that Trump is proposing a comprehensive swath of changes, spanning stricter controls on immigration and border protection, greater government efficiency including the reduction of the federal workforce, tax policy reform and likely tax cuts, broader as well as tactical tariffs, expansion of cryptocurrency markets, and even more esoteric changes, like the renaming of landmarks, including the Gulf of Mexico, just to name a few. Clarity will emerge as his policies take physical shape, but, in the interim, there is much consternation in the investing community about the impact of some of these policies on federal finances, as well as on growth in the U.S. economy, which has already had to withstand years of restrictive monetary policy. One of the more significant pieces of legislation up for debate this year is the sunsetting of Trump’s 2017 Tax Cuts and Jobs Act (TCJA), which was passed during his first term and is set to expire at the end of 2025. There is a high probability that Trump will extend or even expand the TCJA, broadly reducing taxes and simultaneously putting further pressure on federal finances, which the Congressional Budget Office (CBO) has estimated would cost at least $4.6 trillion over the next 10 years. A ballooning federal debt could put strain on the demand for U.S. Treasuries, while changes to U.S. tax policy, particularly as it relates to alternative minimum tax (AMT) exemptions and the state and local tax (SALT) caps, could have implications for the municipal market.
Trump is hoping to fund part of these tax cuts through tariffs, which do not require congressional approval under the “national emergency” Trump is claiming for tariff enforcement. As of month-end, Trump was threatening tariffs on imports from key trading partners Canada, Mexico, and China, illustrated in Exhibit 4, who in turn, promised retaliation, introducing concrete concerns about a re-acceleration in inflation and even stagflation, which could trouble the Fed in their plight to reduce interest rates. As negotiations play out in the coming weeks, we could see changes to these initial tariffs and ensuing volatility in equity markets. The TCJA and tariffs are textbook examples of uncertainty surrounding Trump’s fiscal agenda. There are countless ways these policies could take shape with potential implications on federal finances, U.S. growth, inflation, labor market health, and both equity and bond markets that are difficult to predict, making uncertainty almost a guarantee.
Exhibit 4: U.S. Key Trading Partners
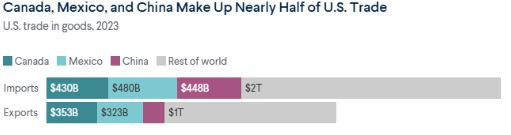
Source: Council on Foreign Relation
The Bottom Line: Trump is pursuing his policy agenda aggressively, focusing first on tariffs and tax policy. Investors should expect uncertain and likely volatile conditions in the weeks and months ahead and should remain cautious about making portfolio changes amidst this uncertainty.
Capital Markets Themes
What Worked, What Didn’t
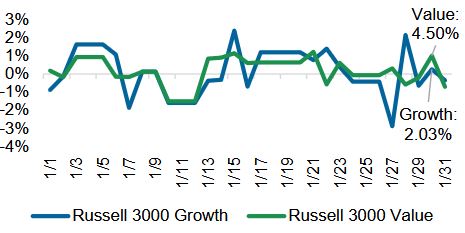
•Values Bests Growth: After a volatile month for growth and tech stocks, fueled primarily by the DeepSeek drama that routed artificial intelligence-based companies, value stocks outperformed growth by nearly 250 bps in January, supporting the story of equity market breadth.
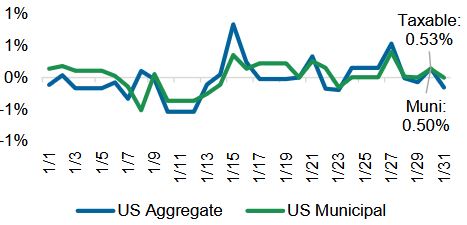
•Invest in Bonds for Income: Taxable and municipal bonds performed roughly in-line with one another in January, returning 50 bps for the month, but municipal markets continue to provide attractive tax equivalent yields for investors, particularly in the high yield muni sector, emphasizing the benefit of income when investing in bond markets.
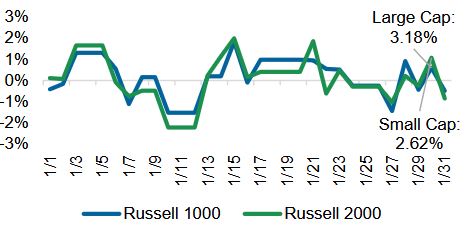
Large vs Small Cap Equity
Growth vs Value Equity
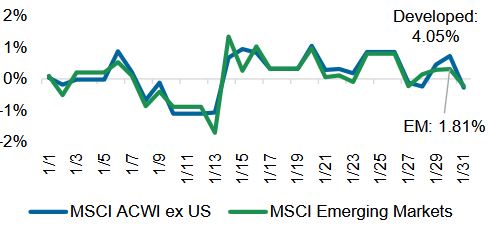
Developed vs Emerging Equity
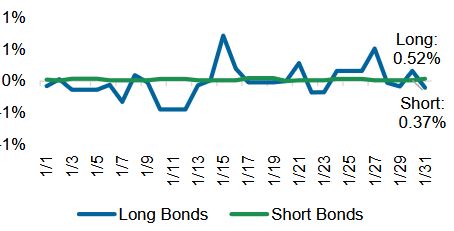
Short vs Long Duration Bonds
Taxable vs Municipal Bonds
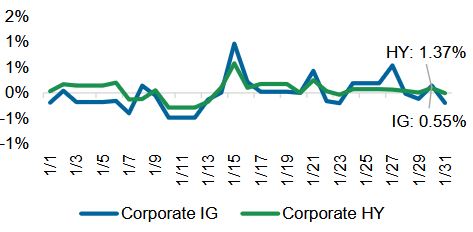
Investment Grade vs High Yield Bonds
Source: YCharts. Data call-out figures represent total monthly returns
On Alternatives
2025 Outlook for Private Markets
Private Equity – After a slow exit environment in recent years, the tide may be changing for the initial public offering (IPO) market in 2025. With a new political regime and the Fed cutting interest rates by 100-bps late last year, optimism is rebounding for the ability of firms to sell portfolio companies at more attractive valuations; however, expectations for further cuts this year are uncertain given the Fed’s “higher for longer” stance. Private equity is also sitting on high levels of dry powder – assets raised for investments but not yet deployed – strengthening the potential for a boost in deal flow activity in 2025, illustrated in purple in Exhibit 5, particularly against Trump’s “deregulation” backdrop.
Exhibit 5: Alternatives Dry Powder
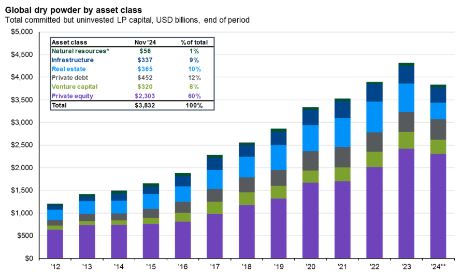
Source: Preqin, J.P. Morgan Asset Management. Data as of 11/30/2024.
Private Credit – The private credit asset class has seen more inflows in recent years than any other private market, largely due to its consistent return profile, high level of income production, and resilience against market volatility. This market-wide migration, however, caused spreads in the private credit market to compress, making the opportunity set potentially less appealing in the current environment, particularly as the Fed has cut rates 100-bps. Interest rates also play a critical role in the private credit market, and rates staying “higher for longer” could continue to put pressure on borrowers, testing the resilience of the asset class to deliver income during times of uncertainty, making the focus on high-quality lenders critical to success in 2025.
Private Real Estate – Interest rate volatility witnessed in the 10-Year Treasury yield in recent months has created a difficult environment for operators and valuations in the real estate market, a trend that is likely to continue in 2025 with a confluence of factors affecting the Treasury market. Zeroing in on multifamily real estate, perhaps the most significant factor affecting this sector in 2025 is the number of deliveries, a measurement of supply, falling off a cliff, as illustrated in Exhibit 6. Deliveries represent the completion of a property and lag starts, which have already seen a precipitous decline, meaning that 2025 could bring limited supply, which should help fuel rental demand and lead to robust rent growth in the multifamily sector this year and beyond.
Exhibit 6: Multifamily Real Estate Supply
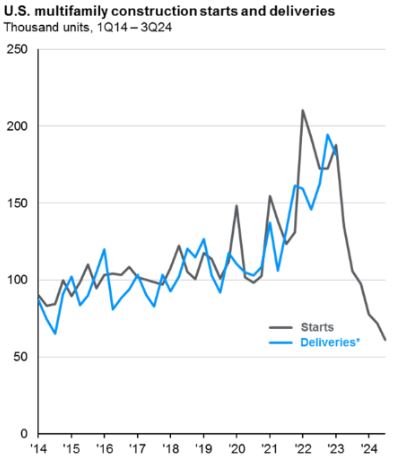
Source: CoStar, J.P. Morgan Asset Management. Data as of 11/30/2024.
The Bottom Line: The 2025 outlook for private investments remains solid but is largely dependent on the direction of interest rates, which, of course, is dependent on the U.S. macroeconomic picture. Amidst this uncertainty in the macro environment, a focus on quality and diversification across private investments remains crucial to defend against potential downside risks.
Asset Class Performance Quilt
Markets are ever-changing, making diversification across asset classes and sectors a critical component to portfolio construction. As illustrated below, a Balanced 60/40 portfolio provides greater consistency of returns and less volatility over time.
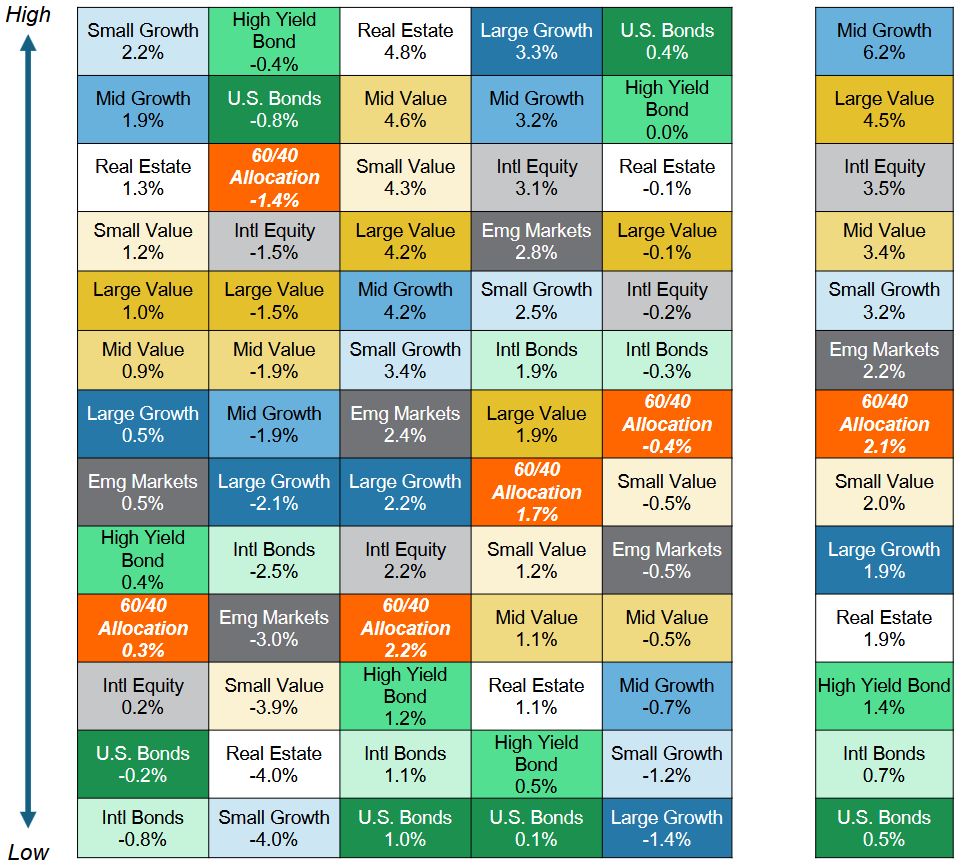
Source: YCharts. Asset class performance is presented using market returns from an exchange-traded fund (ETF) proxy that best represents its respective broad asset class. Returns shown are net of fund fees for and do not necessarily represent performance of specific mutual funds and/or exchange-traded funds recommended by Centura Wealth Advisory. The performance of those funds may be substantially different than the performance of broad asset classes and to proxy ETFs represented here. U.S. Bonds (iShares Core U.S. Aggregate Bond ETF); High Yield Bonds (iShares iBoxx $ High Yield Corp Bond ETF); Intl Bonds (Invesco International Corporate Bond ETF); Large Growth (iShares Russell 1000 Growth ETF); Large Value (iShares Russell 1000 Value ETF); Mid Growth (iShares Russell Mid-Cap Growth ETF); Mid Value (iShares Russell Mid-Cap Value ETF); Small Growth (iShares Russell 2000 Growth ETF); Small Value (iShares Russell 2000 Value ETF); Intl Equity (iShares MSCI ACWI ex US ETF); Emg Markets (iShares MSCI Emerging Markets ETF); and Real Estate (iShares US Real Estate ETF). The return displayed as “60/40 Allocation” is a weighted average of the ETF proxies shown as represented by: 40% U.S. Bonds, 12% International Stock, and 48% Large Blend.

