Market Month in Review – July 2025

At a Glance
Macro Indicators: Headline and core PCE inflation rose by 2.6% and 2.8%, respectively, in June, slightly above expectations and potentially demonstrating the beginnings of tariff-induced price increases. The labor market remains a concern for markets and economists, especially as tariffs threaten margins and Trump’s immigration policies take hold. The advance estimate of 2Q GDP growth printed at 3.0%, a rebound from 1Q’s print of -0.5%, with both data points muddied by the impact of tariffs.
Trump 2.0: The “One Big Beautiful Bill” (OBBB) was signed into law on July 4, extending most of the tax policies from Trump’s first administration, raising the debt ceiling, and much more. Tariffs continue to be top of mind for Trump, who implemented additional levies hours before they were set to take effect on August 1 after the initial 90-day “Liberation Day” pause.
Fed & Monetary Policy: The Fed held rates steady at the July FOMC meeting, citing a lack of evidence supporting interest rate cuts. Two Fed governors dissented with the decision in July; the first time two governors have dissented since 1993. Scrutiny is increasing on the Fed and its decision-making by both markets and the Trump Administration, with increasing pressure to cut rates. Fed officials remain squarely focused on inflation and employment data related to their dual mandate.
Capital Markets: U.S. equity markets hit multiple record-highs over July but ended the month on a sour note as the August 1 tariff deadline loomed. Fixed income markets remained volatile with muted to negative total returns over the month as macroeconomic data continued to give mixed signals about the economy.
Asset Class Performance
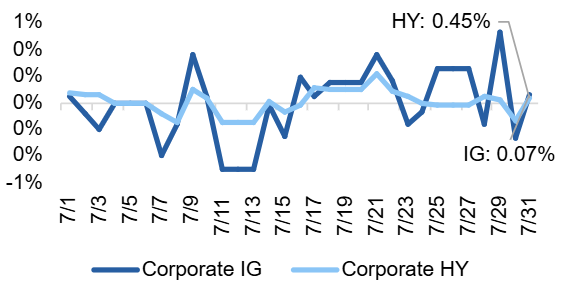
U.S. large cap equities posted the strongest returns in July but continue to lag international markets on a year-to-date basis by over 9%, signaling recovery but not a complete return to the “U.S. Exceptionalism” theme. Investment grade bonds had negative total returns over the month with high yield markets generating the greatest returns within the fixed income asset class, albeit at a paltry 0.45%.
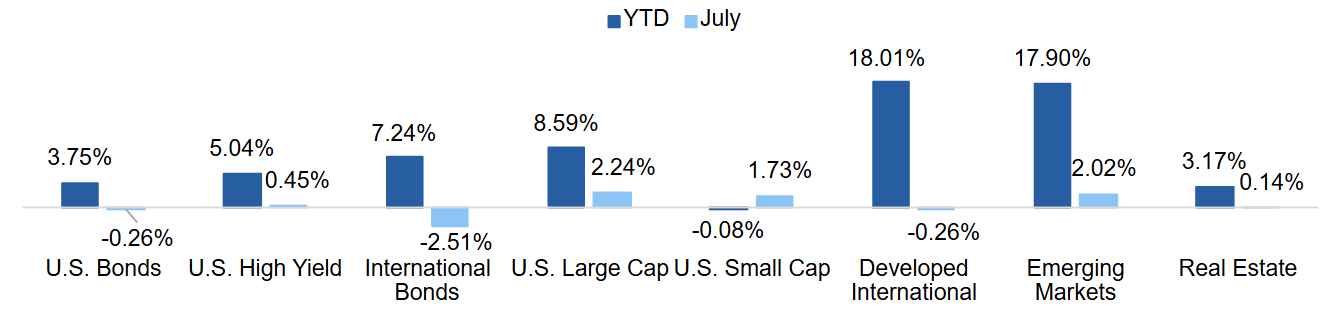
Source: YCharts. Asset class performance is presented using total returns for an index proxy that best represents the respective broad asset class. U.S. Bonds (Bloomberg U.S. Aggregate Bond TR), U.S. High Yield (Bloomberg U.S. Corporate High Yield TR), International Bonds (Bloomberg Global Aggregate ex-USD TR), U.S. Large Cap (S&P 500 TR), U.S. Small Cap (Russell 2000 TR), Developed International (MSCI ACWI ex US TR), Emerging Markets (MSCI EM TR), and Real Estate (Dow Jones U.S. Real Estate TR).
Markets & Macroeconomics
More Policy Implications
On July 4, President Trump signed the One Big Beautiful Bill Act (OBBB) after weeks of deliberation in Congress. The passage of this bill was a milestone for the administration who has been talking about certain provisions, particularly extending the 2017 Tax Cuts and Jobs Act (TCJA), since the campaign trail. In addition to the extension of the TCJA, the OBBB includes provisions surrounding spending cuts on Medicaid, increased taxes on college endowments, an increase in the debt ceiling, and much more. The passage of the OBBB has important implications for consumers and the economy, with the most glaring impact on the federal deficit. The Congressional Budget Office estimates that the OBBB will add $3.3 trillion to deficits over the next 10 years, increasing the federal net debt as a percent of GDP from around 100% today to over 120%, illustrated in Exhibit 1. While the market contends with the long-term effect of increasing federal deficits, the passage of OBBB means that tax policy is largely in the rearview mirror for the Trump Administration, allowing the focus to shift to other items on his policy agenda, with tariffs and international trade policy continuing to be a key initiative.
Exhibit 1: Federal Net Debt
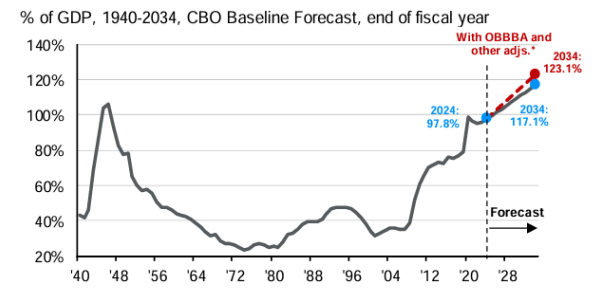
Source: JPM Guide to the Markets
The Trump Administration continued to make progress on trade negotiations over the month after extending the initial 90-day pause of “Liberation Day” tariffs to August 1, the day the tariffs are set to take effect on those countries without trade deals. It is clear that tariffs will remain in place, particularly as President Trump announced a flurry of tariffs to end the month. Tariffs are another policy initiative whose effects are only just starting to be felt, particularly in GDP and earnings data, and they are a phenomenon that continues to perplex the Federal Reserve on how to approach its own policy decisions.
Over the month, the Fed continued to debate the macroeconomic impacts of the Trump Administration’s policy initiatives. At their July FOMC meeting, the Fed opted to hold interest rates steady – a decision that drew dissent from two Fed governors, marking the first time since 1993 that two governors opposed a policy move. The Fed remains data dependent, focused on inflation, labor market, and GDP data. The first (advance) estimate of 2Q GDP printed at 3%, demonstrating a bounce back after slowing in 1Q to -0.5%. However, tariffs once again muddied the GDP print as 2Q’s growth was largely driven by a plunge in imports, creating a positive impact on overall GDP, illustrated in Exhibit 2. This GDP print also saw a positive contribution from consumer spending despite consumer sentiment indicators exhibiting weakness in recent months, which was offset by a decline in investment expenditures, demonstrating a hesitancy from U.S. businesses to spend.
Other items on the policy docket that have not garnered a lot of attention is President Trump’s promise to de-regulate, which could be a boon to U.S. businesses. Coupled with potential interest rate cuts later this year, it is likely that the back-half of 2025 will continue to be dominated by policy. While markets may have gained greater policy certainty, including on tariff outcomes, the economic implications of those policies remains unclear.
Exhibit 2: Contributions to Percent Change in 2Q 2025 GDP
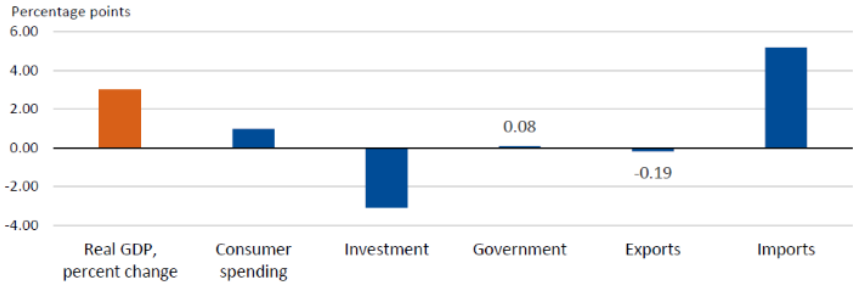
Source: BEA
The Bottom Line: Policy decisions, whether coming from the Trump Administration or the Federal Reserve, continue to dominate headlines and major initiatives, like tax policy, tariffs, and interest rates have important economic implications, both in the short- and long-term and are likely to continue driving volatility in markets.
Looking Ahead
Is Market Breadth Coming Back?
U.S equity markets have largely been dominated by seven stocks since 2023, and while those Magnificent Seven continue to defy expectations in the current environment, market breadth has shown signs of life. A measure of market participation, market breadth can provide signals on whether movements in an index like the S&P 500 are more broad-based or concentrated in nature. While concentration continues to plague U.S. equity markets, with the Magnificent Seven representing ~33% of the S&P 500 as of month-end, there are signs that the concentration between these seven stocks is breaking up, and the other 493 stocks in the index may be starting to pull their own weight.
There are numerous measures of market breadth, and one such measure is the percentage of stocks in the S&P 500 that are closing above their 50-day moving average, which has moved higher since April’s market sell-off, starting July at an intra-month high of nearly 80%, illustrated in Exhibit 3, before moving lower to end the month. Typically, in technical analysis, a 50-day moving average above 70% signals broad market strength. For comparison, this figure was 17% to start the year, providing an indication for how far market breadth has come just in the first half of 2025.
Exhibit 3: Percentage of Stocks in S&P 500 Closing Above 50-day Moving Average
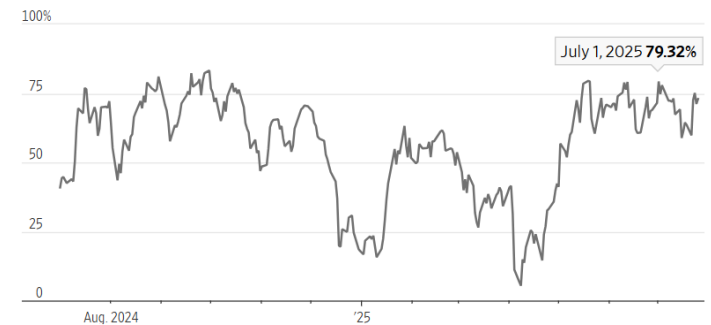
Source: Wall Street Journal
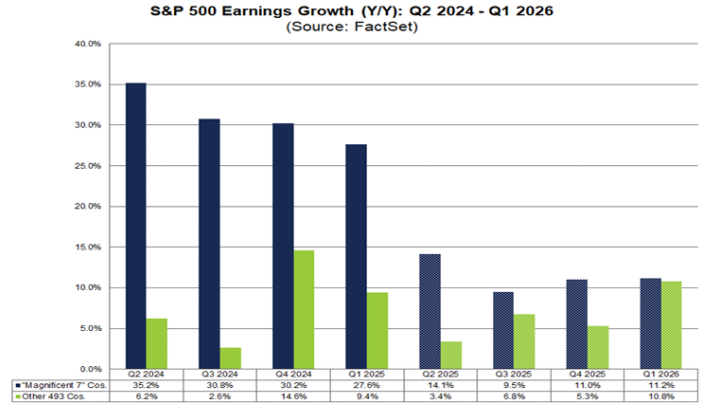
While Q2 earnings look muted for the rest of the 493 stocks in the S&P 500, with estimates calling for growth of 3.4% (versus 14.1% for the Magnificent Seven), expectations point to a reacceleration of growth through year end and into Q1 2026, which will coincide with moderating earnings growth for the Magnificent Seven stocks, illustrated in Exhibit 4. Valuations also point to potentially better opportunities in the S&P 500 ex-Magnificent Seven with the top 10 stocks in the index currently boasting a 28.7x forward P/E ratio, compared to 22.5x for the entire index and 21.0x for the remaining 493 stocks.
Another potential sign of market breadth is the fact that, through July of this year, the Magnificent Seven have only contributed ~39% to the overall returns of the S&P 500, compared to 55% and 63% in 2024 and 2023, respectively. Couple this fact with the latest all-time record high for the S&P 500 set on July 28, implying that there are potentially more companies driving the index higher. While the market breadth story is encouraging, there are still numerous factors at play, including lingering policy decisions surrounding tariffs and interest rates. A particularly important factor moving forward for equity markets will be the ability of companies to effectively manage the impact of tariffs, making future earnings seasons and management commentary even more important to follow, and diversification across and within equity markets an important consideration.
Exhibit 4: Share of Magnificent Seven Returns in S&P 500
Source: FactSet
The Bottom Line: While it may be too early to tell, market breadth in U.S. equity markets is showing signs of life, with various indicators, including 50-day moving averages and forecasted earnings growth, pointing to more broad-based strength in comparison to the heavily concentrated markets seen in recent years. Monitoring these indicators will provide important clues to whether we will finally see a break in the Magnificent Seven’s reign.
Capital Markets Themes
What Worked, What Didn’t
•Growth Comes Back in Favor: Growth and tech names performed well over the month with markets seeing a return to the “risk on” environment after April’s lows.
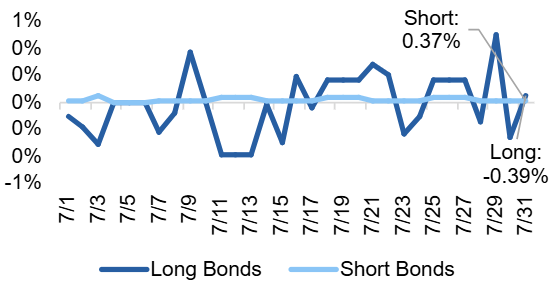
•Short Duration More Favorable: While producing lackluster total return results, short duration securities outperformed longer duration bonds over the month with yields continuing to support the income-generation story.
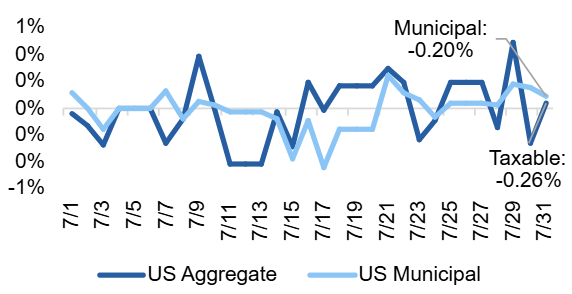
•Munis Edge Out Taxable Bonds: Municipal bonds eked out a slightly better total return than taxable counterparts but remain negative on a total return basis. The Muni/Treasury ratio is above 90% at the longer-end of the curve, providing attractive relative value opportunities.
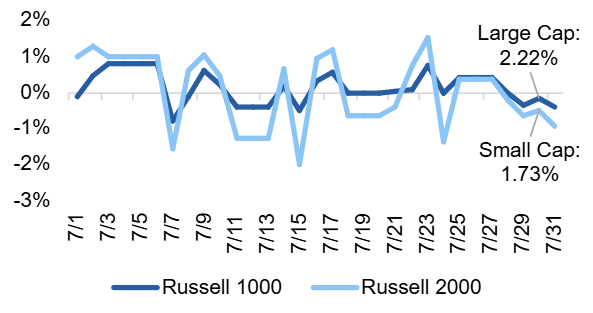
Large vs Small Cap Equity
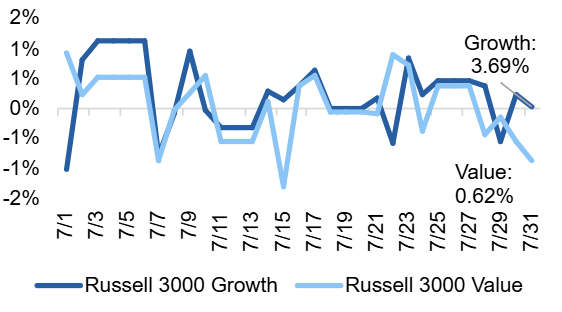
Growth vs Value Equity
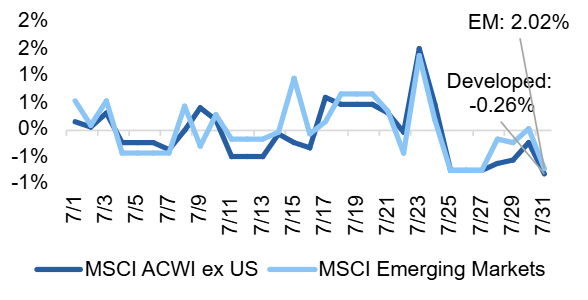
Developed vs Emerging Equity
Short vs Long Duration Bonds
Taxable vs Municipal Bonds
Investment Grade vs High Yield Bonds
Source: YCharts. Data call-out figures represent total monthly returns.
On Alternatives
Gaining Exposure to AI with Infrastructure
The infrastructure asset class encompasses those physical or real assets that are essential to the everyday functioning of our society, including assets tied to transportation, utilities, communication, and energy. More specifically, this includes essentials like power and water utilities, renewable energy generators, and data centers whose demand is increasing to power artificial intelligence (AI) needs.
Similar to real estate and particularly for those investors with a longer time horizon, infrastructure investments can serve as an inflation hedge, offer diversification benefits, and provide a stable income stream. Demand for infrastructure is inelastic, or less impacted by changes in prices, causing these types of investments to be potentially more resilient during economic downturns or recessions.
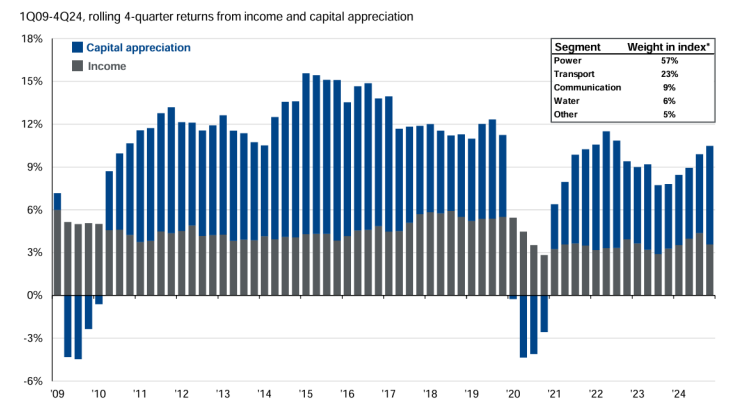
Exhibit 5: Global Infrastructure Returns
Source: JPM Guide to Alternatives
This feature is well illustrated by the gray bars in Exhibit 5, which shows that even during periods of market turmoil, like in the aftermath of the Great Financial Crisis (GFC) in 2009 and the COVID-19 global pandemic in 2020, infrastructure investments maintained a stable income stream. In today’s environment, there are many relevant use cases for infrastructure, but one such use case that is garnering significant attention is the demand for data centers to help power AI. Large-scale AI models are highly complex, operate on vast datasets, and demand immense processing power at extremely high speeds. To function effectively, they rely on large-scale data centers capable of meeting these intense computational requirements.
This has led to a surge in demand for data center infrastructure among major technology companies or “hyperscalers” competing in the AI space, such as Microsoft, Google, and Meta. The substantial growth in capex of major tech companies is illustrated in Exhibit 6, with expectations of continued and hyperbolic growth in coming years. Importantly, these data centers typically have longer-term contracts with high switching costs for tenants, like the Metas of the world, making them more defensive from an investment perspective. Investors can gain diversified and stable exposure to transformative market themes like artificial intelligence, not by trying to pick winners and losers in the equity markets, but by investing in the critical infrastructure that supports the entire ecosystem. Much like selling picks and shovels during the gold rush, investing in the physical backbone of AI – such as data centers – offers a way to participate in the long-term growth while avoiding the volatility and uncertainty of choosing individual tech leaders.
Exhibit 6: Capex at major tech companies
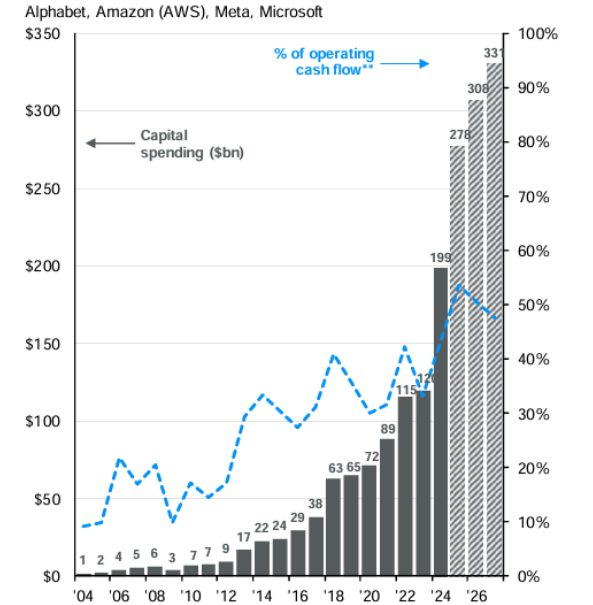
Source: JPM Guide to the Markets
The Bottom Line: Infrastructure can be an attractive asset class to include in a portfolio for those investors looking to diversify, hedge inflation, and receive a stable income stream, all while providing exposure to emerging themes, like AI.
Asset Class Performance Quilt
Markets are ever-changing, making diversification across asset classes and sectors a critical component to portfolio construction. As illustrated below, a Balanced 60/40 portfolio provides greater consistency of returns and less volatility over time.
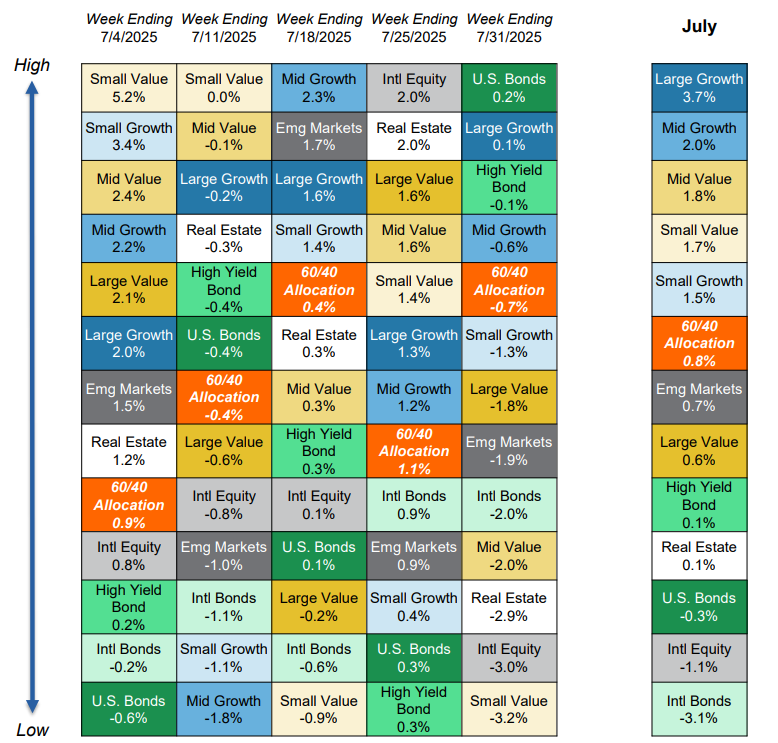
Source: YCharts. Asset class performance is presented using market returns from an exchange-traded fund (ETF) proxy that best represents its respective broad asset class. Returns shown are net of fund fees for and do not necessarily represent performance of specific mutual funds and/or exchange-traded funds recommended by Centura Wealth Advisory. The performance of those funds may be substantially different than the performance of broad asset classes and to proxy ETFs represented here. U.S. Bonds (iShares Core U.S. Aggregate Bond ETF); High Yield Bonds (iShares iBoxx $ High Yield Corp Bond ETF); Intl Bonds (Invesco International Corporate Bond ETF); Large Growth (iShares Russell 1000 Growth ETF); Large Value (iShares Russell 1000 Value ETF); Mid Growth (iShares Russell Mid-Cap Growth ETF); Mid Value (iShares Russell Mid-Cap Value ETF); Small Growth (iShares Russell 2000 Growth ETF); Small Value (iShares Russell 2000 Value ETF); Intl Equity (iShares MSCI ACWI ex US ETF); Emg Markets (iShares MSCI Emerging Markets ETF); and Real Estate (iShares US Real Estate ETF). The return displayed as “60/40 Allocation” is a weighted average of the ETF proxies shown as represented by: 40% U.S. Bonds, 12% International Stock, and 48% Large Blend.

