Market Month in Review – October 2025

At a Glance
Macro Indicators: Federal data was hampered by the government shutdown, with September labor market and PCE inflation data not published, clouding the economic picture. The September CPI report was published and showed both headline and core CPI increased 3.0% on a YoY basis. Private jobs data supported continued softening in the labor market in September. After two quarters of tariff-skewed data, estimates for 3Q GDP growth are currently 3.9%, driven by consumer spending and despite trends supporting slowing.
Trump 2.0: Tariff rhetoric was heightened over the month, particularly between the U.S. and China, contributing to market volatility. While no additional tariffs were implemented, the tensions illustrated the Trump Administration’s ongoing strategy of using tariff threats as leverage in trade negotiations.
Fed & Monetary Policy: The Federal Reserve cut interest rates by 25-bps at the October FOMC meeting, citing labor market weakness but alluded to “driving in fog” without crucial federal data due to the government shutdown. Chairman Powell voiced strongly that a December rate cut is not a foregone conclusion despite market expectations for one. The Fed also announced they will be ending their Quantitative Tightening (QT) program on December 1, underscoring their focus on easing economic conditions to support the labor market.
Capital Markets: Isolated regional bank volatility prompted a brief sell-off mid-month, but U.S. equity markets ended the month higher, marking the sixth-straight positive month for large cap stocks. Yields remained relatively unchanged, with the short-end of the curve declining in tandem with the 25-bps interest rate cut.
Asset Class Performance
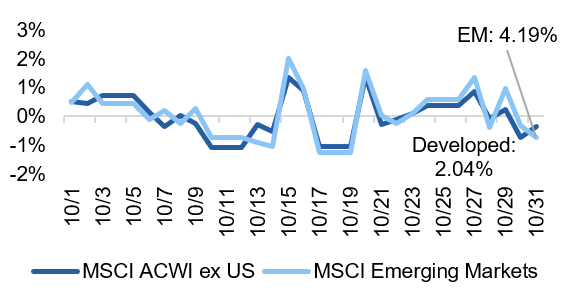
Historically thought of as the most volatile month, asset class performance in October was relatively muted, with gains across the board on a year-to-date basis. Emerging markets outperformed the most in October and continue to be supported by a weaker U.S. dollar.
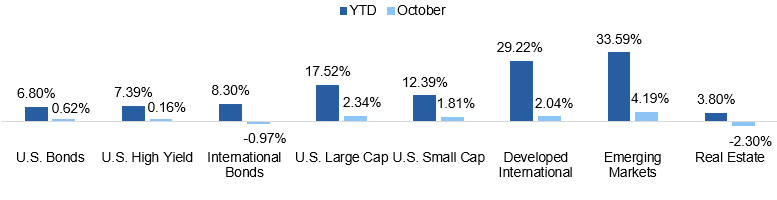
Source: YCharts. Asset class performance is presented using total returns for an index proxy that best represents the respective broad asset class. U.S. Bonds (Bloomberg U.S. Aggregate Bond TR), U.S. High Yield (Bloomberg U.S. Corporate High Yield TR), International Bonds (Bloomberg Global Aggregate ex-USD TR), U.S. Large Cap (S&P 500 TR), U.S. Small Cap (Russell 2000 TR), Developed International (MSCI ACWI ex US TR), Emerging Markets (MSCI EM TR), and Real Estate (Dow Jones U.S. Real Estate TR).
Markets & Macroeconomics
What Government Shutdown?
On October 1, the U.S. government shut down after the Senate failed to pass a House-approved bill to keep funding measures in place. The government was closed the entire month of October, making it the second-longest shutdown in U.S. history as of month-end, threatening to surpass the record 35-day shutdown during President Trump’s first term. Over the month, the Senate tried and failed multiple times to re-open the government, but financial markets paid little attention, focused instead on interest rates, tariff rhetoric, and earnings announcements, illustrated in Exhibit 1.
Exhibit 1: Equity Market Returns vs. October Milestones
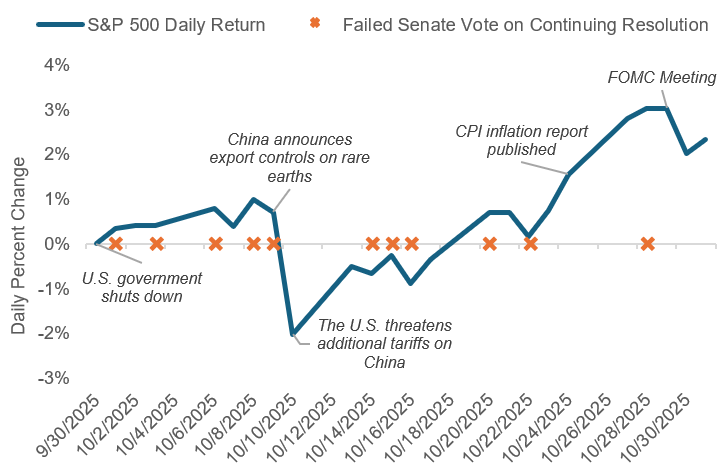
Sources: YCharts / Ballotpedia
Despite markets’ relative nonchalance, the current shutdown is on pace to be the longest in history and the latest estimates from the Congressional Budget Office (CBO) call for a reduction in annualized GDP growth of approximately 1-2% as a result. While this hit to GDP is expected to partially reverse once the government does eventually re-open, the CBO estimates that $7-14 billion will not be recovered. While the true economic impact of the latest government shutdown is difficult to estimate, it is occurring at a time when the health of the U.S. economy is already starting to show softening, particularly in the labor market.
The government shutdown prevented the publication of crucial economic reports during the month, including the September jobs report, which was scheduled for release on October 3. The pause in federal jobs data has made it harder for the Federal Reserve to steer monetary policy to combat labor market softness, with Chair Powell likening it to “driving in fog.” Despite the lack of federal data, the Fed proceeded with another 25-bps cut in October. Markets reacted negatively when Powell indicated that a rate cut in December was not guaranteed, underscoring investors’ expectations for continued monetary easing. PCE inflation, the Fed’s preferred inflation measure, was also not published in October, as tariffs continue to create pressures in the economy and threaten to eat away at margins should they remain in place. CPI inflation, on the other hand, was published, and it showed muted increases in prices, but many expect that the impact of tariffs has not been fully realized.
After China announced new export controls on rare earth elements, the Trump Administration threatened an additional 100% tariff on Chinese imports, escalating tensions and spooking markets in October. By the end of the month, the two leaders met and announced a truce, suspending escalations for the time being. Tariffs continue to be a sore spot for markets, largely due to fears over their ultimate impact on margins. While earnings announcements for the third quarter have been relatively strong, there have been pockets of margin compression, and the outsized capital expenditures by major tech companies paired with above-average valuations has markets worrying whether tariffs will be the catalyst to end the run-up.
Historically, government shutdowns don’t last long enough for markets to care; however, should the current one continue to persist, it could create more lasting impacts. Perhaps markets should be paying more attention.
The Bottom Line: Equity market complacency with the U.S. government shutdown is revealing what matters most: tariffs, interest rates, and their ultimate impact on company bottom lines.
Looking Ahead
Can the Equity Run-Up Continue?
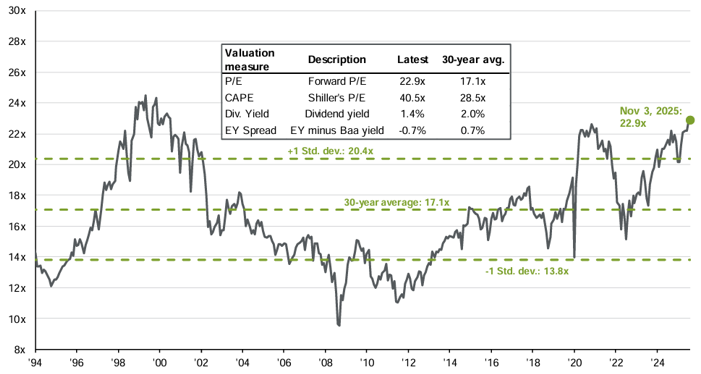
The S&P 500 is trading at a forward price-to-earnings (P/E) ratio of nearly 23x, and other valuation metrics, like the cyclically adjusted price-to-earnings (CAPE) ratio, are approaching historical peaks, illustrated in Exhibit 2. Much of this expansion has been driven by excitement around the artificial intelligence (AI) trade, leading to a surge in technology stocks, which has pushed the “P” in valuation ratios like P/E higher. This trend is causing investors to draw comparisons to the Dot-Com Bubble in 1999, and with both forward- and backward-looking valuation metrics at or near all-time highs, it begs the question: can the run-up in equity markets continue?
Earnings can help provide insight into whether today’s valuations are justified. Looking at the third quarter, earnings growth continues to be supported by the technology sector, which has produced quarterly double-digit earnings growth since 2023. The explosive demand for AI has enabled tech companies to invest heavily in building out these technologies, illustrated by massive capital expenditures from the major “hyperscalers” (Alphabet, Meta, Microsoft, and Amazon), who are expected to collectively spend in excess of $380 billion in capex this year.
Exhibit 2: S&P 500 Forward P/E Ratio
While these substantial capital investments underscore strong long-term potential for tech companies, realizing AI-driven revenues will depend on building out the infrastructure and power systems required to run advanced models – a process that could lag current market expectations and warrants caution from investors.
Exhibit 3: Global Equity Performance
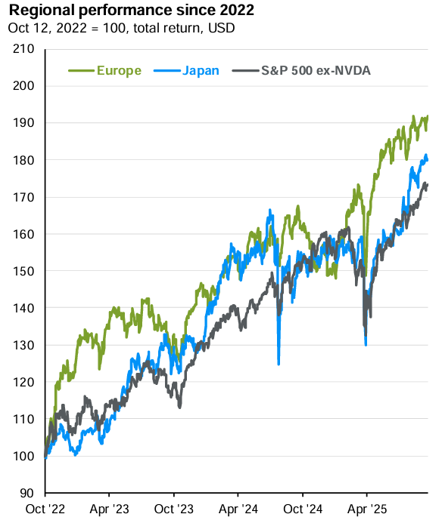
Sources: JPMorgan Guide to the Markets
Muddying the picture for equity markets today are tariffs and whether they will create additional inflationary pressures in the economy. Inflation is bad for stocks as it typically coincides with tightening economic conditions from the Fed. Should tariffs continue to remain in place, it could potentially start weighing more heavily on company margins, which could be a catalyst for volatility. The risk of a monetary policy misstep is also heightened in the current environment as the Fed monitors inflation while contending with labor market softening, yet another volatility catalyst.
Investors should be skeptical that markets will continue to march higher, even after the historic run-up seen in recent years. With valuations at or near historic highs, there is a heavier probability weighted toward prices falling. Without the historic rise in tech companies, like Nvidia, in recent years, international markets, including broad equity markets in Europe and Japan, would have actually outperformed the S&P 500, illustrated in Exhibit 3. Markets cannot go up forever, and while it doesn’t mean investors should exit the market, it does call for prudent asset allocation and risk management to protect for if (and more likely when) valuations come back down to earth.
The Bottom Line: Looking at valuations, today’s equity market appears frothy, driven by the AI trade. Given tariffs remain a real threat to price increases and supply chains, coupled with the time needed to translate tech capex into revenues, the AI trade warrants skepticism from investors, with the run-up continuing not a foregone conclusion.
Capital Markets Themes
What Worked, What Didn’t
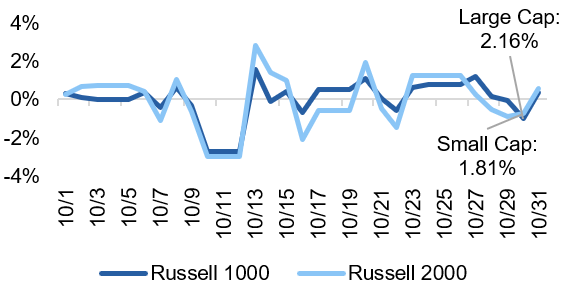
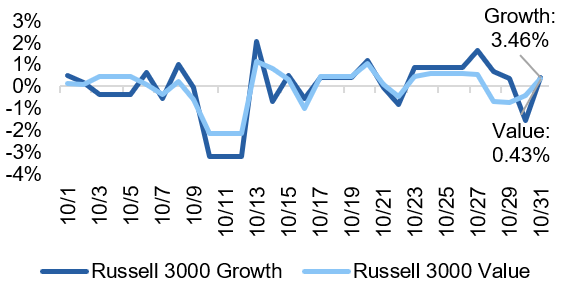
•Large Cap Tech Back in Spotlight: Large cap stocks outpaced small cap counterparts over the month, and growth stocks outperformed their value counterparts by around 300 bps due to continued exuberance in big tech names. Valuations in the large cap tech space continue to be high, warranting diversification across market cap sizes and style boxes.
•Municipal Bonds Post Strong Month: Confronted with an influx of supply in 2025, the supply/demand picture in the municipal market improved in October, contributing to positive total returns in the asset class. From a relative value perspective, the long-end of the muni yield curve remains an attractive part of the market given the steepness of the curve.
Large vs Small Cap Equity
Growth vs Value Equity
Developed vs Emerging Equity
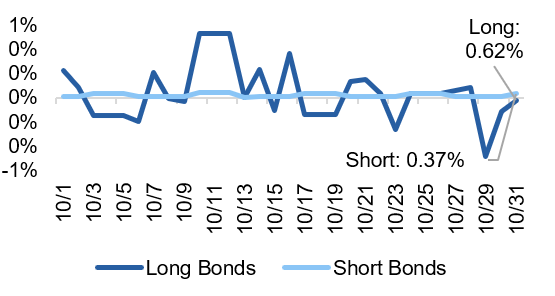
Short vs Long Duration Bonds
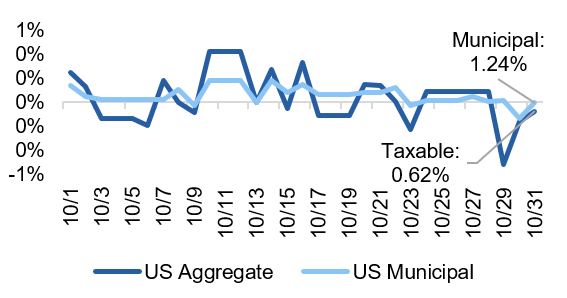
Taxable vs Municipal Bonds
Investment Grade vs High Yield Bonds
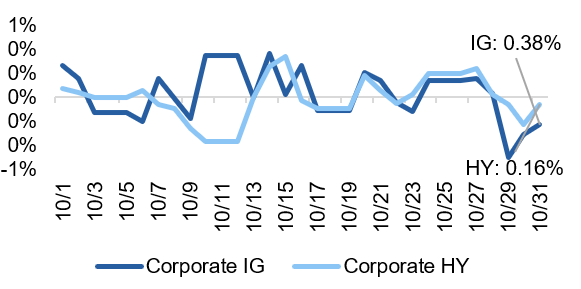
Source: YCharts. Data call-out figures represent total monthly returns.
On Alternatives
Cap Rates and the Real Estate Recovery
Real estate exuberance peaked in late 2022, following a period of historically low interest rates set by the Federal Open Market Committee (FOMC). Since early 2023, the effective federal funds rate has risen by more than 500 basis points, contributing to a broad decline in real estate values and erasing billions of dollars in estimated market capitalization.
This repricing stems in part from the recalibration of a key valuation metric: the capitalization rate (cap rate). The cap rate is the sum of the net cash flow for a property and is also know as net operating income (NOI) divided by the property value. Cap rates represent how much a property will cash flow in comparison to the amount that it is worth, making it a very useful tool for real estate investors to compare properties of vastly different sizes, types, or geographical areas. As interest rates rise, investors demand higher returns to compensate for increased borrowing costs. This in turn drives cap rates higher and, mathematically, compresses property values, assuming a constant NOI. These dynamics have been especially challenging for developments and projects that came to market in 2023 and early 2024, as the cap rates underwritten during the pre-2023, low-rate era are no longer viable in today’s environment.
However, capital appreciation, which is directly tied to a property’s valuation, is only one component of a real estate investment’s return. A significant driver of real estate returns remains the income yield generated from rents, illustrated in Exhibit 4. As the illustration shows, a steady source of income can help offset drawdowns during periods of volatility, like what was experienced between 2023-2024, and can potentially enhance returns during expansions.
Exhibit 4: Sources of Global Private Real Estate Returns
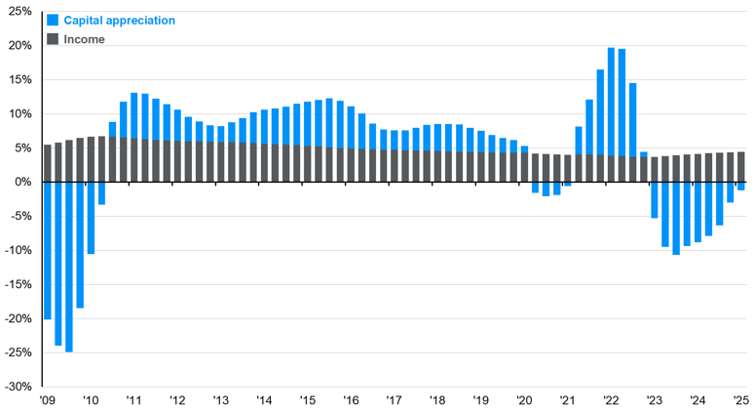
Source: JPMorgan Guide to the Markets
In recent months, the Fed has cut interest rates by 50-bps, bringing the short-end of the yield curve down and creating more favorable conditions for both real estate developers and investors. While additional cuts may provide near-term tailwinds for the real estate market, valuations are more closely correlated with the 10-year U.S. Treasury yield, which reflects longer-term economic expectations. A full recovery to peak-2022 valuations is expected to be a more gradual process; however, the market is already starting to see signs of life.
There is industry consensus that real estate values appear to have bottomed out in the second half of 2024, and institutional capital that had been sitting on the sidelines is now cautiously re-entering the market, narrowing the bid-ask spread and acting as a catalyst for renewed transaction activity. The current macroeconomic environment is also presenting attractive entry points in distressed or repriced assets originally acquired during the 2022 market froth, providing investors not just with compelling investment opportunities but also with encouraging signs of market recovery.
The Bottom Line: Real estate remains a reliable source of income and opportunity as the market regains its footing. With values stabilizing, cap rates becoming more attractive, and new opportunities appearing in repriced assets, the real estate market presents a favorable environment for investors focused on long-term growth, consistent cash flow, and tax-efficient strategies.
Asset Class Performance Quilt
Markets are ever-changing, making diversification across asset classes and sectors a critical component to portfolio construction. As illustrated below, a Balanced 60/40 portfolio provides greater consistency of returns and less volatility over time.
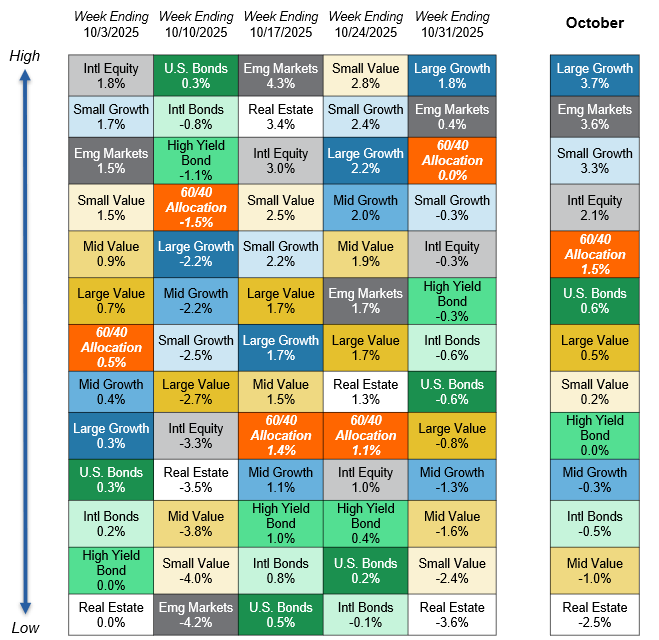
Source: YCharts. Asset class performance is presented using market returns from an exchange-traded fund (ETF) proxy that best represents its respective broad asset class. Returns shown are net of fund fees for and do not necessarily represent performance of specific mutual funds and/or exchange-traded funds recommended by Centura Wealth Advisory. The performance of those funds may be substantially different than the performance of broad asset classes and to proxy ETFs represented here. U.S. Bonds (iShares Core U.S. Aggregate Bond ETF); High Yield Bonds (iShares iBoxx $ High Yield Corp Bond ETF); Intl Bonds (Invesco International Corporate Bond ETF); Large Growth (iShares Russell 1000 Growth ETF); Large Value (iShares Russell 1000 Value ETF); Mid Growth (iShares Russell Mid-Cap Growth ETF); Mid Value (iShares Russell Mid-Cap Value ETF); Small Growth (iShares Russell 2000 Growth ETF); Small Value (iShares Russell 2000 Value ETF); Intl Equity (iShares MSCI ACWI ex US ETF); Emg Markets (iShares MSCI Emerging Markets ETF); and Real Estate (iShares US Real Estate ETF). The return displayed as “60/40 Allocation” is a weighted average of the ETF proxies shown as represented by: 40% U.S. Bonds, 12% International Stock, and 48% Large Blend.

