Market Wrap: The Fed Brings the ‘Pain’ to Banks

The combination of the Federal Reserve’s lenient monetary policy before and after the pandemic, and substantial economic stimulus measures, resulted in a considerable swelling of bank deposits. Last March, the Fed commenced the fastest tightening cycle in decades, increasing the overnight lending rate from essentially 0% to 5%. When the Fed increases bank borrowing rates and interest rates increase, banks generally raise the rates at which they lend money, while usually maintaining the interest paid on deposits. As a result, this boosts their net interest income. When 6-month Treasury Bills pay more than 5% and money market funds pay over 4% while bank deposits average less than 0.50%, depositors are incentivized to direct their money out of the bank and invest in Treasury Bills or money market funds. What happened with Silicon Valley Bank (SVB) was a collapse of confidence in unprecedented circumstances – an exodus of large investor deposits, more than the FDIC-insured limit of $250,000. This unexpected development caught SVB specifically, and other banks, off-guard, resulting in significant losses showing up on their balance sheets, as detailed next.
Take That to the Bank
According to the Wall Street Journal, in the days following SVB’s collapse, the 25 biggest US banks gained $120 billion in deposits. Small banks experienced $108 billion in outflows over the same period, resulting in the largest weekly deposit decline for small banks on record. Meanwhile, more than $220 billion has flowed into money-market funds.
A bank’s business model is to take in deposits, lending to individuals and businesses, and investing the balance (often a portion in long-term fixed-rate bonds), classifying investments they expect to hold for one year or longer as Held-To-Maturity. These Held-to-Maturity securities are held on bank balance sheets at amortized cost, and therefore do not reflect the traditional mark-to-market pricing as securities classified as available for sale; thus, bank balance sheets do not reflect the magnitude of losses resulting from the Fed increasing rates by 5% over the last year.
Because the demand from SVB depositors was too great, SVB had to convert their long-dated Held-to-Maturity assets to available for sale, triggering a loss of $1.8 billion on the conversion from Held-to-Maturity to available for sale securities. Ultimately, financial regulators stepped in and took over operations of SVB. Days later, Signature Bank (SBNY) followed suit, and UBS acquired Credit Suisse (with the forced intervention of Swiss regulators) to prevent them from facing the same fate as SVB and SBNY.
To prevent a bank-run contagion, the Fed stepped in on March 12th, providing liquidity to institutions through the Bank Term Funding Program (BTFP). Under this program, banks can, if needed, borrow reserves against their assets up to the par value; this is to provide liquidity to depositors without recognizing losses by preventing the sale of Held-to-Maturity assets. Through the BTFP, the Fed has injected approximately $400 Billion into the economy, working counter to their current $95 billion monthly balance sheet reduction.
Banks rely on deposits to fund their lending and expansion, so as they experience declines in their deposit base, lending activity decreases, negatively impacting borrowers’ ability to access capital moving forward. Consequently, this situation could restrict consumer demand and accelerate the Federal Reserve’s fight against inflation, forcing them to pause rate hikes after May’s meeting.
Market Recap
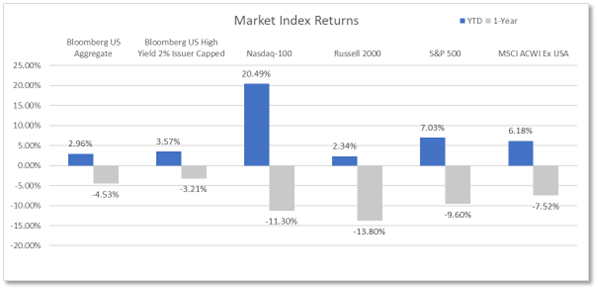
Equities – In what has shaped up to be primarily a low-quality rally despite mounting obstacles, the market demonstrated resilience for the second consecutive quarter. Many of 2022’s worst performers have been 2023’s darlings. The first quarter of 2023 saw the S&P 500 post a 7.03% return, marking the third time (1981 and 1938) in the last 15 bear markets the index posted back-to-back quarterly gains. Though the Fed continues to tighten monetary policy, the market anticipates the rate hiking cycle is nearing the end and expects the Fed will reverse course and lower rates later this year, especially on the heels of the unfolding banking challenges.
Interest rate-sensitive stocks led the charge, with the tech-heavy NASDAQ producing a first-quarter return of 16.77%. Among the biggest beneficiaries of investors shifting from financials to cash-rich companies were the largest growth-oriented equities, as evidenced by the NASDAQ 100’s Q1 return of 20.49%. With a gain greater than 20%, the NASDAQ 100 has technically entered a bull market, with the NASDAQ composite knocking on the bull’s door, returning 19.67% since bottoming in December 2022.
While market participants expect the Fed to pivot in the coming months, the Fed’s February meeting minutes suggested that further rate hikes are needed to dampen inflation. The Fed’s vow to keep rates elevated for longer signaled the peak for small-cap equities. From the start of the year through the Fed’s announcement on February 2, the small cap Russell 2000 index had gained 11.33%. Bank liquidity challenges are compounding the concerns for small cap equities as access to capital and lending standards tighten. The combination of these fears pushed the Russell 2000 nearly 10% lower from the Fed’s February meeting through the end of the quarter, with the Russell 2000 ending Q1 up only 2.34%.
Bonds – Traditionally considered ‘safe’ investments in a portfolio, bonds continue to take investors on a wild ride. Treasury Bond volatility (as measured by the MOVE index) outpaced equity volatility (as measured by the VIX) in the first quarter, leading many to question the validity of the Treasury security as the ‘safest asset.’ Periods like the first quarter serve as a reminder that investing in Treasury securities removes credit risk, but not volatility, from consideration.
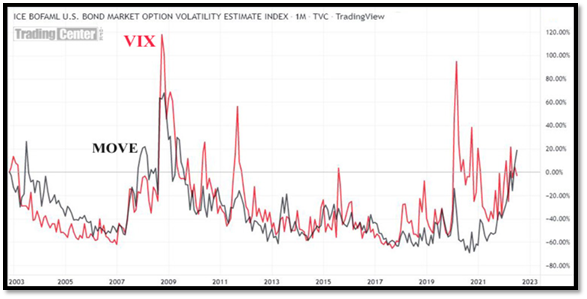
Source: https://tradingcenter.org/index.php/trade/equities/stock-signals/354-move-index-bonds
At the beginning of the New Year, concerns about long-term growth prospects and anticipation the Fed would cut rates by year end caused yields on the 10-Year Treasury to decline by 0.51%, dropping from 3.88% to 3.37%. After January’s inflation report and the Fed’s February meeting, market expectations abruptly shifted, pushing the Fed Funds peak rate expectations from ~5% to close to 5.5%, and pushing the 10-year back above 4%.
Queue the collapse of Silicon Valley Bank, forcing investors to flock to the safety of Treasury securities and pushing the 10-year back below 3.4%. In light of the Fed’s comments following their March meeting, along with the apparent stabilization of the country’s banking system, yields have risen, with the 10-Year Treasury now at 3.48%. As volatile as yields were in the year’s first quarter, bonds still produced a return of 2.96%.
Source: YCharts
Economy: Feel the ‘Pain’
After two consecutive quarters of negative real GDP growth in 2022 of -1.6% and -0.6%, real GDP rebounded to 3.2% and 2.6% in the third and fourth quarters.
Underpinned by a robust labor market and solid wage growth, consumers have proven resilient in the face of 40-year high inflation and higher interest rates. The fourth quarter’s final GDP reading showed that consumers may be starting to feel the pain with spending advancing only 1%. Reduced consumer spending leads to slower economic growth (and potential recession). Additionally, declines in exports, nonresidential fixed investment, and state and local government spending contributed to lower growth figures.
Inflation & Interest Rates
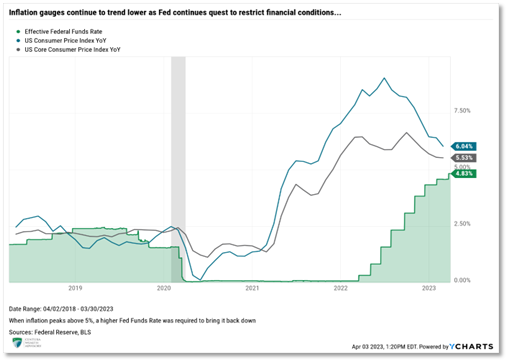
Month-over-month readings continue to post positive marks. Year-over-year inflation trended lower from its June 2022 peak of 9.06%. Though inflation came in higher than expected in January causing equity markets to sell off and yields to rise, February’s reading was in line with expectations.
January’s and February’s headline CPI came in at 6.41% and 6.0%, respectively, while core CPI (excluding energy and food) registered 5.55% and 5.53% year-over-year readings over those same periods, as both measures still increased month-over-month. The most problematic component of inflation is the resiliency of price pressure on core services, particularly shelter – a sticky and not-so-transitory variable representing about 1/3 of CPI. Shelter continued to trend upwards, increasing 8.1% over the last year – the highest growth rate since 1982. On a positive note, rents are coming down, and home prices are off their June 2022 peak, pointing to lower inflation readings ahead.
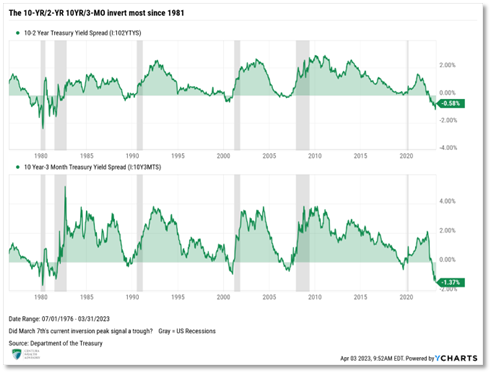
Prior to the banking failures, we continued to see larger increases on the front-end of the yield curve, causing the inversions to worsen across several maturities, sending even stronger and more ominous recession signals to the market.
Recession has been a headline topic over the last few quarters. One of the most prominent and accurate yield curve inversion points is on the 2-Year US Treasury versus the yield on the 10-Year US Treasury (10/2). Its peak reached an inversion of -1.07% on March 7th and narrowed slightly to close the quarter inverted -0.58%, only 0.05% higher than the start of the year. The last statistically meaningful yield inversion was in the fourth quarter, with the 10-Year to 3-Month Treasury spread crossing into negative territory on October 26. Remaining inverted for the rest of 2022, it picked up momentum through the year’s opening quarter to -1.37%.
At their current levels, both inversion points mark the largest inversions since 1981. Inverted yield curves have proven solid predictors of a recession. Typically, a recession follows anywhere from 12 to 24 months after the initial inversion. For reference, the 10/2 yield curve remains inverted since July 2022.
According to LPL Research Fixed Income Strategist, Lawrence Gillum, one of the timelier signals derived from inversions is when the curve troughs and the yield curve finally begins to steepen, with the spread moving from negative, back to positive territory. Outside of the early 1980s, the steepening of the curve toward positive territory proved to be a timelier indicator, as the average time from an inverted yield curve trough to a recession shortened to roughly 12 months during these periods.
Finding Balance
After its balance sheet ballooned to nearly $9 trillion post-pandemic, the Fed commenced its initiative to reduce its holdings. In Mid-March, the Fed confirmed the pace of their balance sheet reduction of $95 billion per month for the foreseeable future. Since the start of the year, the Fed has reduced its balance sheet by $167 billion through March 1, bringing the total reduction to $598B from the April 2022 peak. Since the SVB collapse, the Fed has injected nearly $400B into the economy, reinflating its balance sheet and marking a pivotal moment for The Fed. For the first time in nearly a year, liquidity is being pumped into the system (Quantitative Easing). At the same time, the Fed is aggressively engaged in Quantitative Tightening (raising rates and reducing its balance sheet by $95 billion per month).
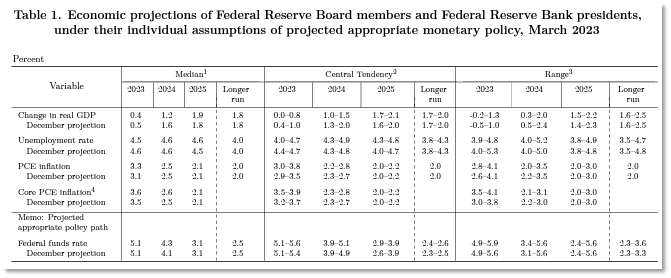
Nonetheless, on Wednesday, March 22, the Fed decided to continue rate hikes by increasing the Federal Funds Target Rate by 0.25% to the range of 4.75% – 5.00%. Federal Reserve Chairman, Jerome Powell, pursued the narrative that inflation has run too high, and the labor market continues to remain too tight. The Federal Reserve, still committed to do whatever it takes to contain inflation, will likely raise rates another 0.25% during their May meeting. This would bring rates in line with the projected peak rate provided in the Fed’s March Dot Plot of 5.10%.
Source: www.federalreserve.gov
Unemployment
The labor market remains robust, having now recouped all jobs lost during the pandemic-induced recession. Unemployment fell to pre-pandemic levels of 3.4% through January, matching the lowest reading since 1969. Although February saw an uptick to 3.6% as the increase in the participation rate outpaced the rate of hiring for the month, there are still more than one-and-a-half job openings for every unemployed person (1.67:1).
Wage growth is one of the Fed’s primary concerns. Although wage inflation has been trending lower, it remains elevated, which worries the Fed. Strong wage inflation increases the risk of a wage-price spiral that could prolong elevated inflation. February’s CPI print marks the 26th consecutive month inflation has outpaced wage growth. Based on its updated March projections, the Fed forecasts the unemployment rate to increase to 4.5% in 2023. The strength in the labor market continues to serve as a beacon for the Fed. It provides a cushion and signals they can continue tightening monetary policy.
Centura’s Outlook
The Fed confirmed its commitment to do whatever it takes to control 40-year high inflation – not letting concerns about a potential banking crisis derail its tightening efforts. Interest rates remain at levels not seen since before the Great Financial Crisis (2008-09), so it’s no surprise to witness tighter financial conditions slowing the economy, with a likely recession on the horizon.
We still believe the two most problematic and impactful risks today are inflation and the resulting Federal Reserve monetary policy response. Concerns around bank liquidity and possible economic recession have prompted analysts to revise earnings lower. According to FactSet, the estimated earnings growth for the S&P 500 in the fourth quarter is –6.6%. If accurate, this would represent the largest decline the index delivered since the second quarter of 2020 (-31.8%). These negative revisions highlight the challenges companies must traverse to deliver profit in 2023. While the Fed’s March meeting was seen as a dovish rate increase, we believe it’s important to note that even when the Fed does stop raising rates, maintaining the current level of rates is still restrictive, and should not be viewed as the end of their tightening cycle.
A company’s ability to service debt is negatively impacted with rates expected to remain elevated. Factoring in the increased cost of labor and companies struggling to pass the increased cost of goods onto consumers, we believe the road ahead likely remains challenging to navigate. With earnings releases starting in mid-April, both top and bottom-line misses and negative management sentiment will likely dampen return expectations on equities. Forward 12-month P/E ratios are around 17.8, slightly below their five-year average of 18.5. This indicates additional drawdowns may be in store before equities become attractive from a valuation standpoint.
In addition to the Fed’s tightening regime and banks losing approximately $400 billion of deposits in March, market volatility is likely to persist through 2023, with financial conditions tightening significantly. This puts further pressure on both business and personal balance sheets. Until inflation breaks to lower levels, the Fed provides more clarity on their forward-looking monetary policy, and banking conditions stabilize, we remain cautious and anticipate that equities will experience turbulence as the first half of 2023 continues to unfold.
Our cautious outlook informs our allocations which remain underweight to respective equity targets. Our quality bias and slight value bias has served as a slight headwind in the year’s first quarter. Our underweight to foreign equities continues to provide support to client portfolios. Though the markets face a wall of worry, it’s important to remember they are forward-looking, often pricing in future economic recoveries before they happen. Given the strength of the equity market recovery since late last year, we began bringing some of our equity positioning back towards neutral or in line with our long-term target allocations. We intend to exercise caution going forward while also monitoring for opportunities to capitalize on further market dislocations.
Our fixed-income allocation continues to utilize non-traditional fixed-income investments to mitigate further risks of rising rates. The short duration of our fixed-income allocation has protected client portfolios from spiking yields and loss of principal. We have incorporated larger-than-average cash allocations to provide additional support against interest rate volatility. Furthermore, yields on cash money market funds became attractive for the first time in several years. These cash allocations generate an attractive income stream and allow us to pivot as we identify opportunistic investments for superior risk-adjusted returns.
We continue to succeed in improving returns and reducing risk by incorporating many private and liquid alternative investments to our allocations. The ramifications of spiking interest rates still impact private real estate and we anticipate additional downward valuation adjustments in many markets. We are particularly concerned with commercial office real estate, as several cities are experiencing office vacancies above the national average of 18.7% (the highest ever). With approximately $46 billion of variable rate office debt, we believe defaults on commercial real estate loans could increase over the balance of 2023, potentially adding to challenges in the banking sector.
Our focus on real estate industries possessing a large favorable supply/demand imbalance, like multifamily real estate, should help mitigate losses relative to other real estate sectors not possessing similar disparities. Despite the expected challenges in the real estate market, we maintain our dedication to exercising patience and selectivity in our decisions.
As Centura continues to enhance our alternative investment platform, we will remain focused on high-quality, conservative core exposure, with an eye toward opportunities to capitalize on the dislocations that often happen in private markets due to illiquidity and information disparities.
Thank you for your continued confidence and support. While we face multiple challenges, we remain anchored to our core principles which we believe will allow us to navigate toward achievement of your wealth building objectives. If you have questions or concerns, please contact your Centura Wealth advisor.

