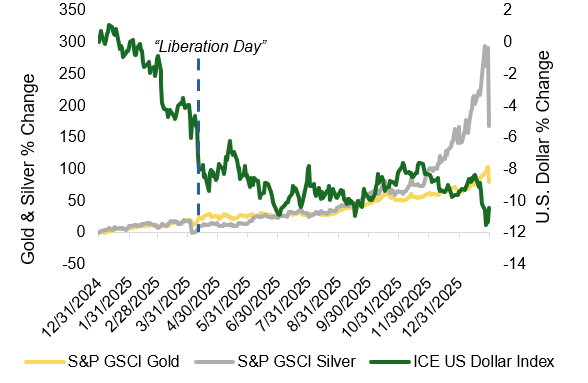
On February 28, 2026, coordinated U.S. and Israel military strikes on Iran escalated into the effective closure of the Strait of Hormuz – the first time in history this chokepoint has been blocked. Approximately 20% of global oil and LNG supply transits this corridor and its closure caused Brent crude to surge from roughly $80 per barrel to nearly $119 within weeks. This single event has reshaped the investment outlook across every asset class covered in this report and represents the most significant geopolitical supply shock since at least the 1970s, according to the International Energy Agency. The outlook for the conflict remains highly uncertain and how it plays out will define how assets perform for the remainder of the year.
Scenario Framework: Iran Conflict Duration Is the Key Variable
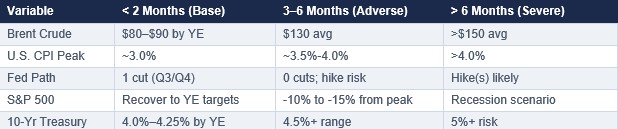
Source: Capital Economics, Goldman Sachs, EY-Parthenon, Charles Schwab, Federal Reserve March 2026 projections, Al Jazeera/Chatham House economic analysis. Oxford Economics Alpine Macro baseline does not expect conflict to extend beyond two months.
Key Cross-Asset Themes in Q1
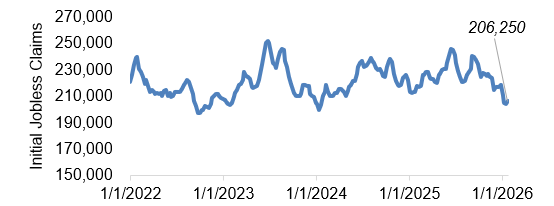
U.S. Macro: The Iran conflict introduced a stagflationary risk premium not seen since the 1970s oil shocks. Energy-driven inflation is tracking toward 3.5% to 4.0%, while the labor market continues to soften, with volatile monthly reports. GDP growth for 2026 was revised to approximately 2.0%, contingent on a conflict resolution within 2-3 months. Compounding the macro uncertainty, the incoming Fed Chair, Kevin Warsh, has yet to be nominated, creating implications for monetary policy moving forward.
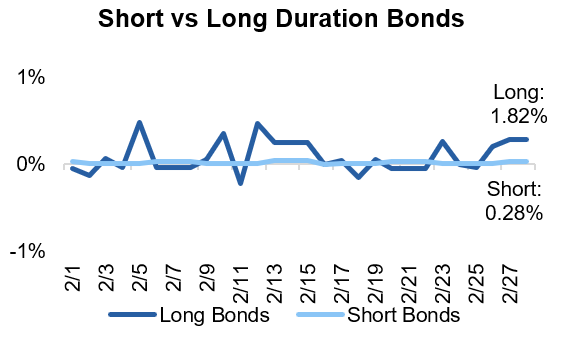
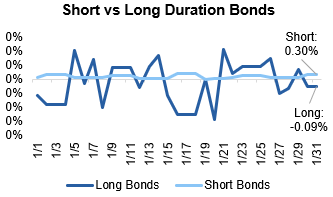
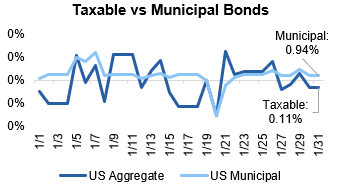
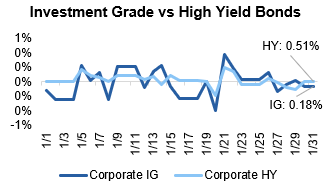
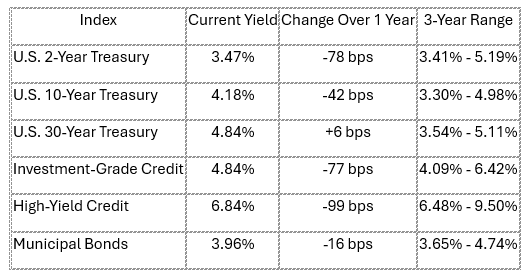
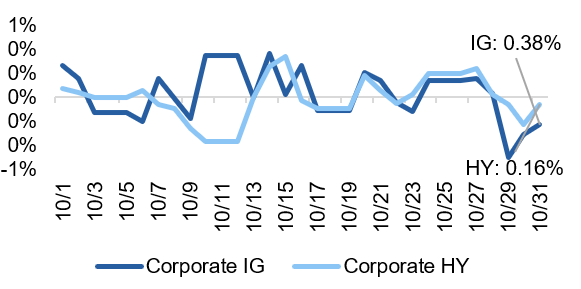
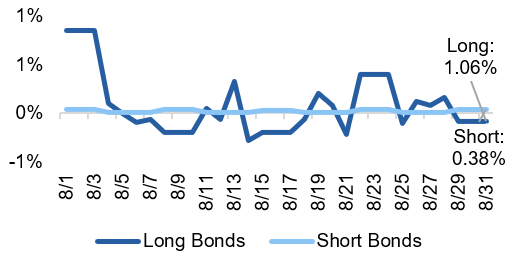
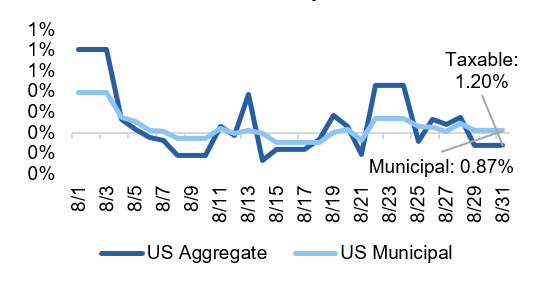
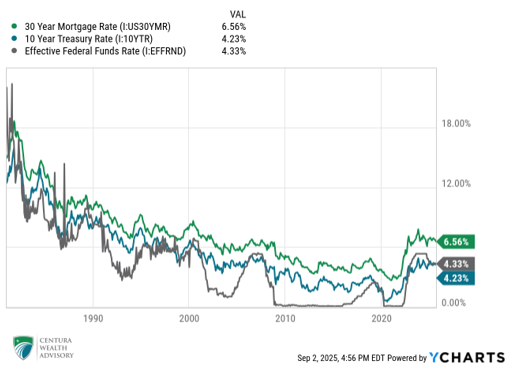
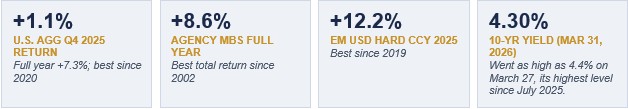
U.S. Fixed Income: The standard safe-haven bid for Treasuries failed as yields rose, not fell, with inflation expectations dominating sentiment. The 10-year Treasury climbed from 3.97% pre-conflict to 4.30% as of quarter-end. At their March 18 FOMC meeting, the Fed held rates unchanged for the second consecutive meeting, with only one cut now projected for 2026. Rate hike risk is non-trivial: the Atlanta Fed shows a ~20% probability of a 25 bps increase. Moving forward, TIPS and short-duration agency MBS are preferred over assets like long-duration Treasuries. The attitude of the Fed will be critical for risk assets. Do they “look through” the price spike associated with the change in oil prices or react?
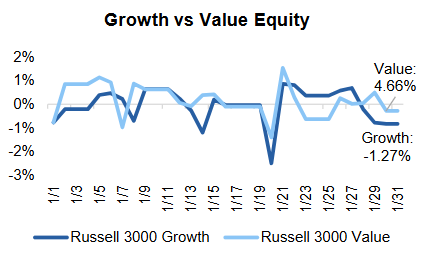
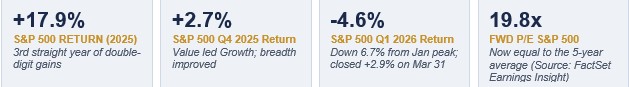
U.S. Equities: The S&P 500 ended the quarter down approximately 6.5% from its January peak (with daily swings of up to 2%). Over the quarter, defense, energy, and AI adoption beneficiaries outperformed; consumer discretionary, companies displaced by AI (namely, software), and airlines underperformed. History suggests geopolitical-driven drawdowns recover within 12 months if the conflict is contained, but the 2026 EPS estimate of $305–$313 per share remains under revision as the Iran conflict continues.
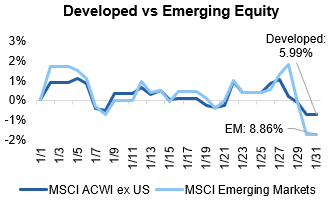
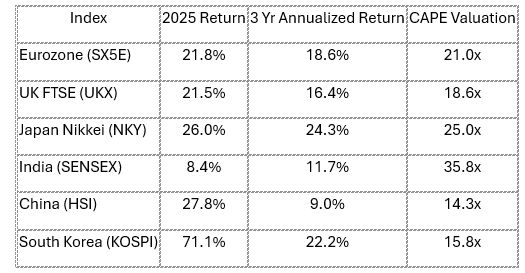
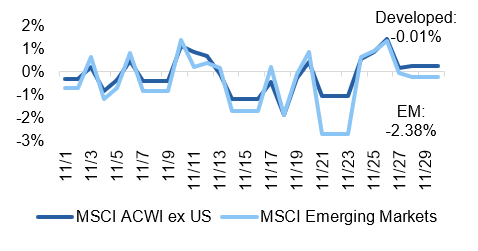
International Equity: Asia – particularly India, South Korea, and Southeast Asia – is most vulnerable to the energy shock whereas Europe faces moderate spillover. Despite the headwind of the Iran conflict, the structural case for international equities remains intact: valuations remain cheaper than U.S. equivalents, and dollar weakness is likely to resume post-conflict. As the Iran conflict continues, Latin American energy exporters (Brazil, Colombia) and Gulf sovereign equities should benefit.
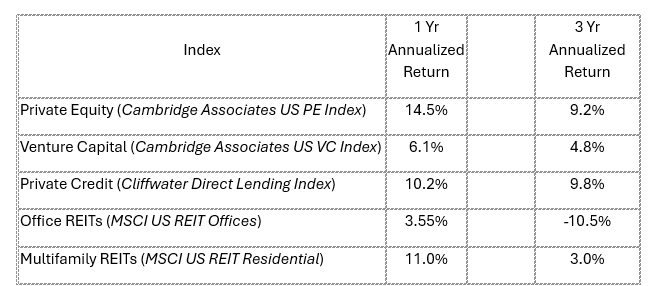
Private Equity: Near-term dealmaking has stalled as GPs await resolution of the Iran conflict. Defense contractors, domestic energy infrastructure, and AI-integrated portfolio companies are the clear near-term beneficiaries. The structural M&A recovery thesis remains intact: a H2 2026 reacceleration is expected once macro uncertainty clears. Secondaries and continuation vehicles remain the primary liquidity mechanism for legacy 2021–2022 vintage holdings.
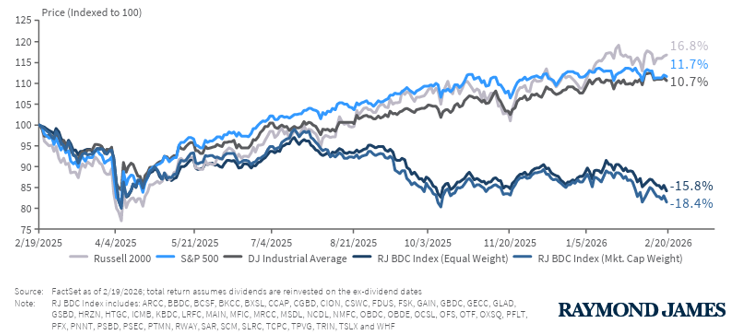
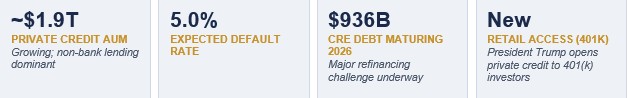
Private Debt: A coordinated wave of retail redemptions swept major BDC and interval fund vehicles in Q1, notably forcing gating events at Blackstone (BCRED: $3.8B requested, 7.9% of AUM – injected $400M firm capital), BlackRock (HPS HLEND: $1.2B requested, 9.3% of NAV; $620M approved), Blue Owl (OBDC II permanently frozen), and Cliffwater ($33B fund: 14% of shares requested vs. a 7% cap), in addition to Morgan Stanley, Ares, and Apollo. Two structural risk drivers are converging: AI-driven disruption of SaaS borrowers (~19% of direct loans) eroding creditworthiness and a structural liquidity mismatch in semi-liquid vehicles. Payment in kind (PIK) loan usage and covenant-lite structures are the leading indicators of deeper credit stress. Morgan Stanley projects default rates could reach 8%; UBS warns of up to 13% in a severe scenario.
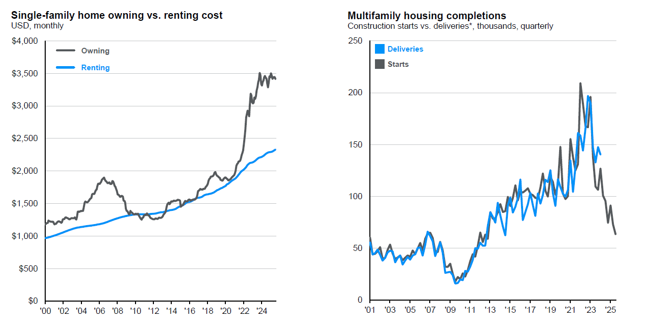
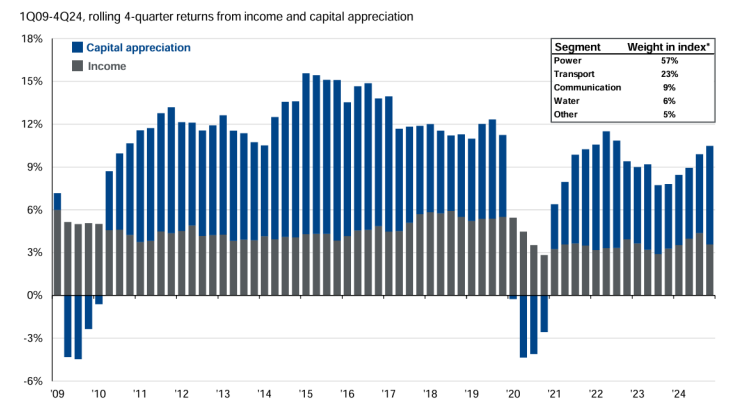
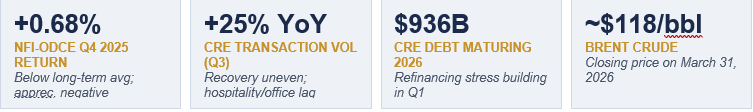
Real Estate: Rising Treasury yields have deferred cap rate compression and the core real estate recovery with the outlook for the U.S. multifamily sector uncertain as the Iran conflict has disrupted expectations for interest rate cuts in 2026. Data centers and industrial logistics remain secular overweights; office is structurally impaired. The $936B CRE debt maturity wall is generating a growing pipeline of distressed refinancing opportunities for well-capitalized opportunistic investors.
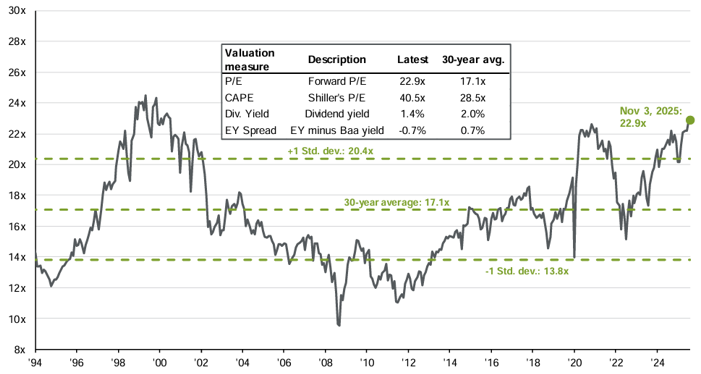
Bottom Line: The conflict in Iran has come at a time when U.S. equity valuations and credit spreads are at all-time highs and tights, respectively, and when the U.S. economy is suffering from stubborn inflation and a weakening labor market. Moving forward, we expect continued volatility and potential downside risks. The outlook for the medium-term (3+ years) remains intact, but the longer oil prices stay elevated, the more that thesis will be challenged.
U.S. Macroeconomic Landscape
Q1 2026 Market Review
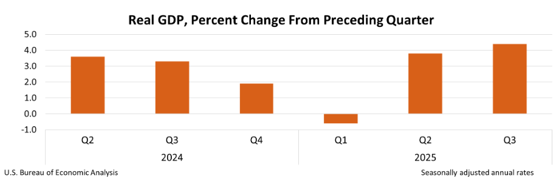
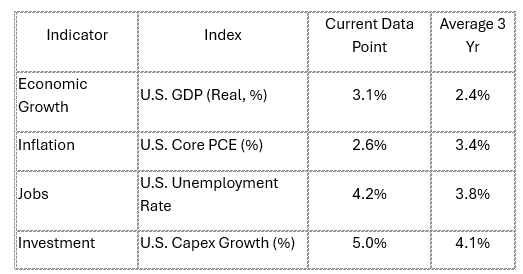
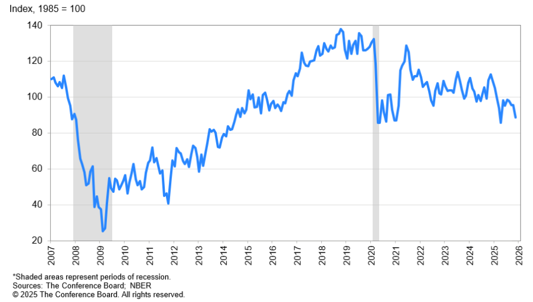
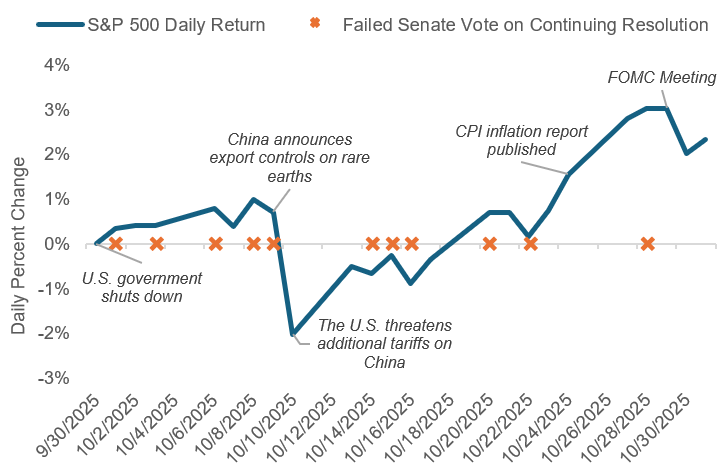
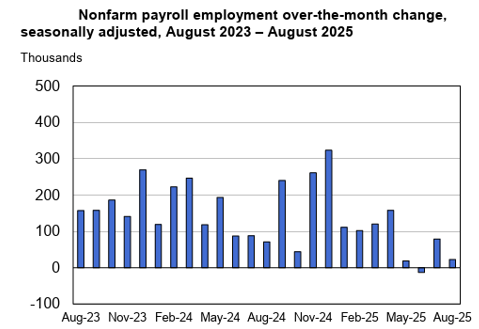
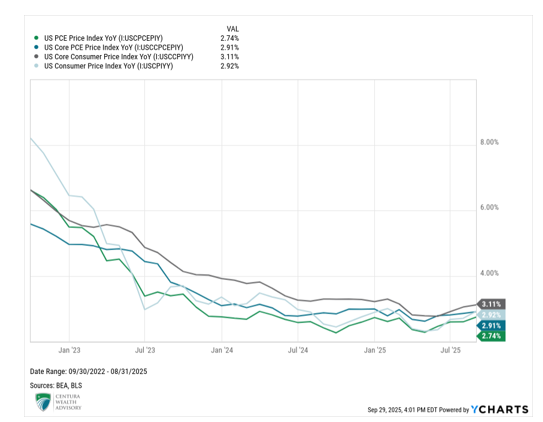
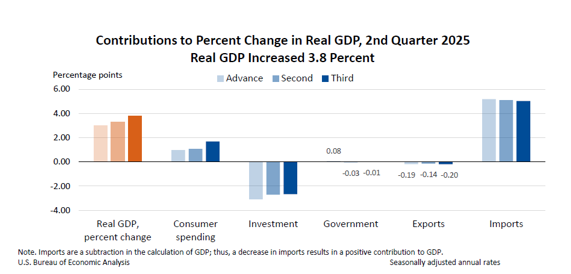
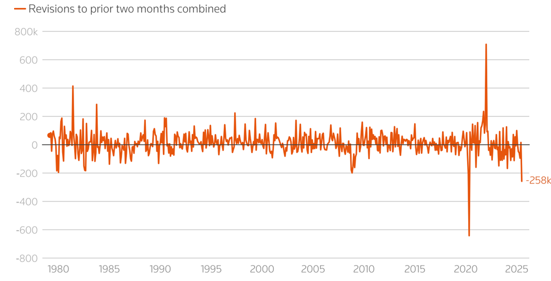
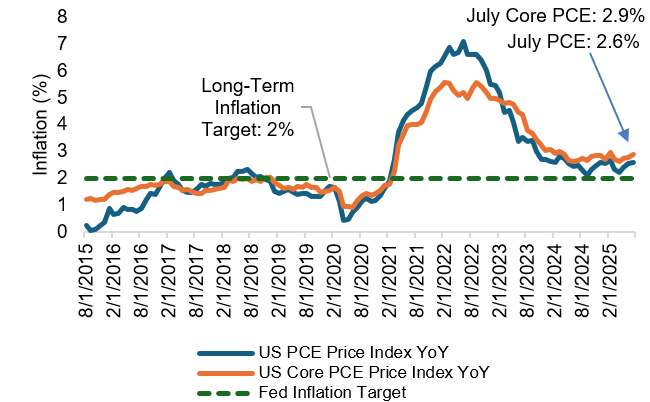
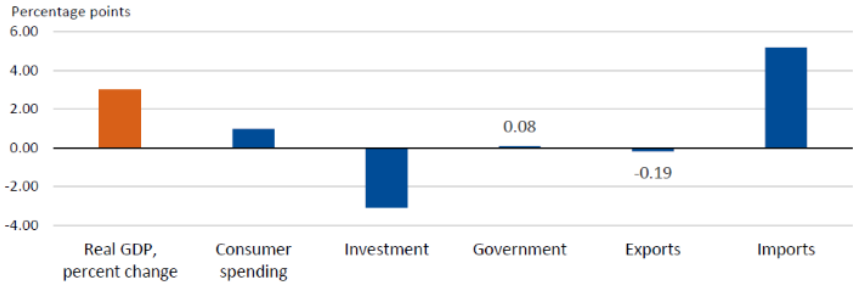
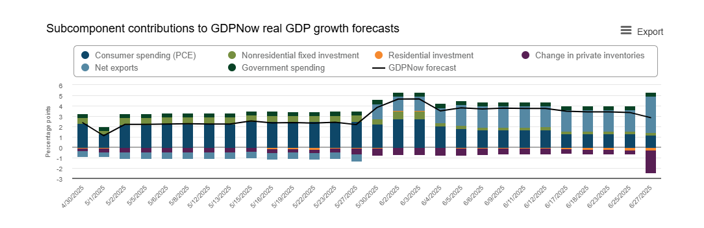
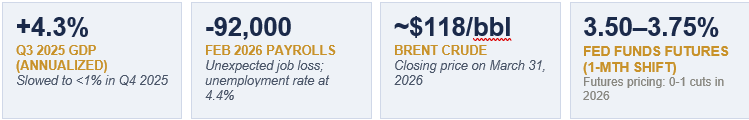
The U.S. macroeconomic picture in Q1 2026 was defined by a fragile but resilient economy suddenly confronting a major exogenous shock. The quarter began with GDP momentum on solid ground – Q3 2025 had printed an exceptional 4.3% annualized growth rate – but Q4 2025 slowed sharply to below 1%, reflecting the combined drag from a 43-day government shutdown in October and November, softening consumer spending, and a decelerating labor market. January data confirmed these trends: core PCE inflation rose to 3.1%, above the Fed’s 2% target, while consumer confidence approached recessionary levels. February brought further deterioration: the economy shed an unexpected 92,000 nonfarm payroll jobs, pushing the unemployment rate to 4.4%. This “low-hire, low-fire” equilibrium – where the labor market is too weak to generate jobs but too stable to trigger Fed easing – placed the FOMC in an uncomfortable holding pattern. Then, on February 28, the U.S.-Israel strike on Iran transformed the macro outlook. Brent crude surged above $100 per barrel within days and ended the quarter at around $119/bbl. National average gasoline prices climbed from $2.98/gallon pre-conflict to $4.02/gallon by March 31 – crossing $4.00 for the first time since August 2022 – directly and immediately pressuring consumer purchasing power. The Fed held rates unchanged for the second consecutive meeting on March 18, with Chair Powell acknowledging the “uncertainty” while projecting year-end core PCE at 2.7%.
2026 Forward Outlook
The U.S. macroeconomic outlook for the remainder of 2026 now hinges critically on the duration and intensity of the Iran conflict. The pre-war base case – GDP growth of 2.0%–2.6%, gradual Fed easing to 3.0%–3.25%, and core PCE declining toward 2% by year-end – has been materially revised across most institutional forecasters.
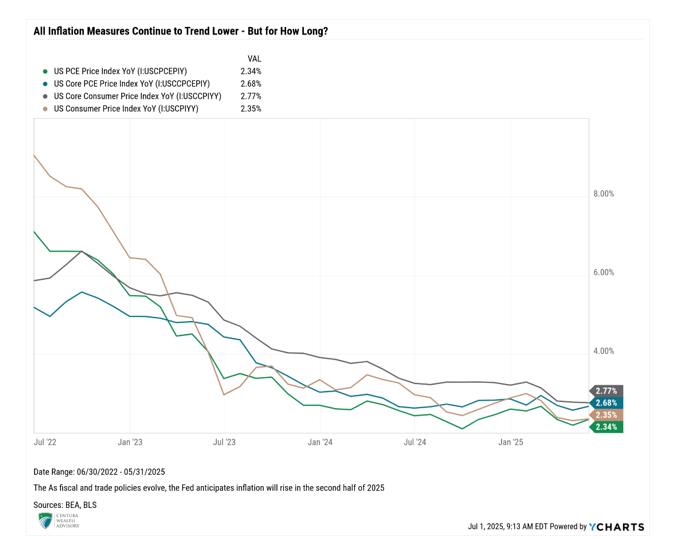
The inflation path has worsened significantly. Before the Iran strikes, core PCE was running at 3.1% and headline CPI was at 2.4%. Higher energy costs now threaten to push headline inflation to 3.5%–4.0% in the near term, with potential second-round effects on food, transportation, and utilities. CNBC quotes economists warning of “a familiar but uncomfortable dilemma,” alluding to an energy shock generating inflation alongside a slowing labor market. J.P. Morgan notes that “there’s never a good time for an adverse supply shock, but ideally the starting point would be low and stable inflation,” a precondition that clearly did not exist entering the conflict. The CBO had already projected PCE inflation at 2.7% for 2026 before the conflict, above the Fed’s pre-conflict estimates.
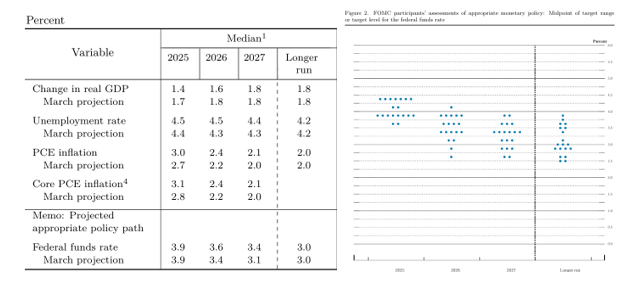
The stagflation risk – rising inflation alongside slowing growth – is the dominant macro concern. Federal Reserve officials, including Powell, have pushed back against the “stagflation” label, arguing that the 1970s comparison requires double-digit unemployment and inflation that does not apply today. However, the structural parallels are uncomfortable: an oil shock in an environment of above-target inflation, weakening employment, and politically constrained monetary policy. The Atlanta Fed’s probability tracker shows a nearly 20% probability of a rate hike this year – a scenario that would have been broadly inconceivable three months ago.
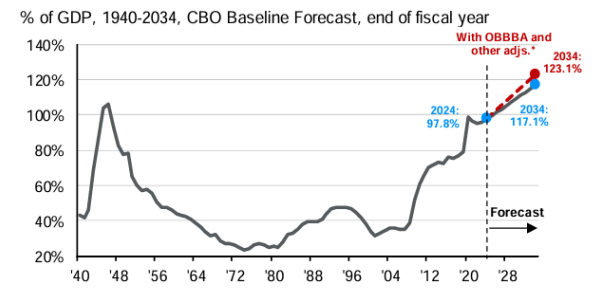
The One Big Beautiful Bill Act’s (OBBBA) fiscal stimulus, including an estimated $150 billion in consumer tax refunds flowing in Q1–Q2 2026 and full equipment expensing benefits, provides a partial offset, supporting consumer spending and business investment in the near term. However, the CBO’s warning of $3.4 trillion in added deficits over 10 years remains a structural constraint, and rising defense spending from the Iran conflict will widen this deficit further, potentially exerting upward pressure on long-term Treasury yields.
Lastly, the May 15 Fed Chair transition remains a significant institutional wildcard, particularly as Kevin Warsh’s nomination remains stalled in the Senate. If Powell departs without a confirmed successor, markets face an extended period of leadership uncertainty at the FOMC during one of the most complex monetary policy environments in decades. Powell has stated he has “no intention” of leaving voluntarily until a related investigation is resolved and his successor is confirmed.
Bottom Line: The most likely base case is that the conflict proves shorter than feared, oil retreats toward $80–$90 per barrel by H2 2026, the Fed delivers one 25-basis-point cut in Q3, and GDP growth lands near 2.0% for the full year. But the tail risks, particularly a prolonged Strait of Hormuz closure, are more severe today than at any point since 2020 and the 2008 financial crisis.
U.S. Equity Markets
Q1 2026 Market Review
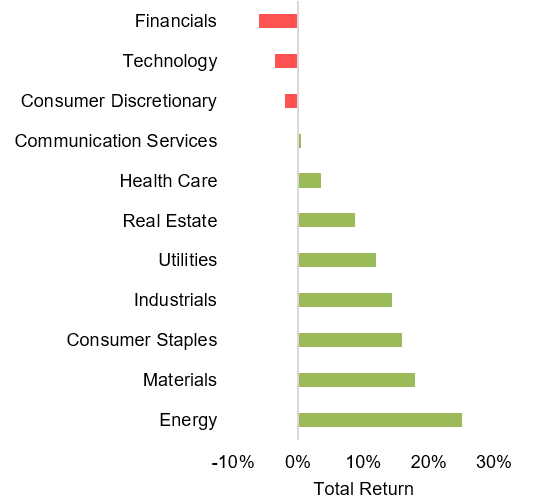
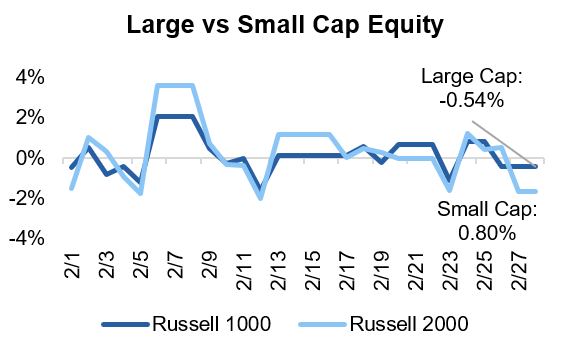
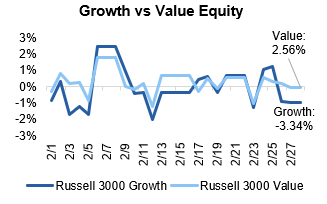
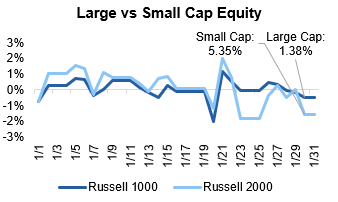
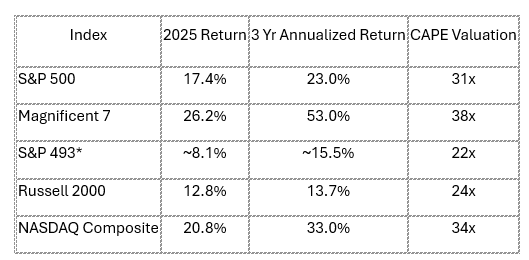
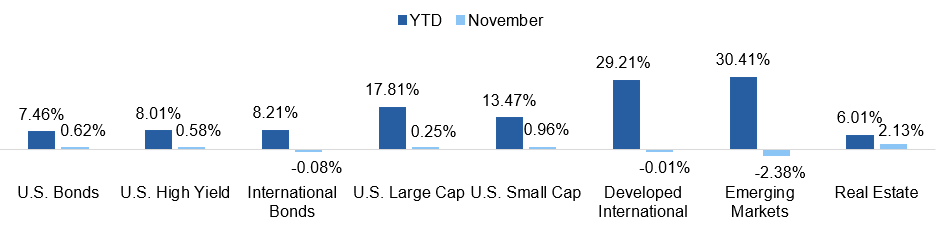
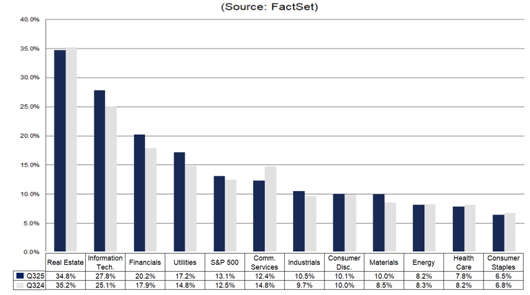
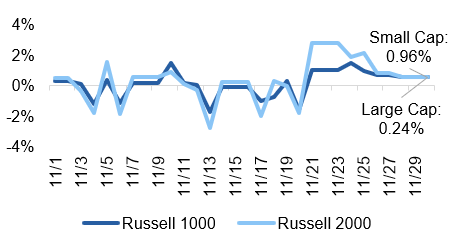
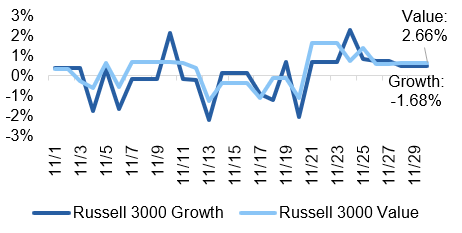
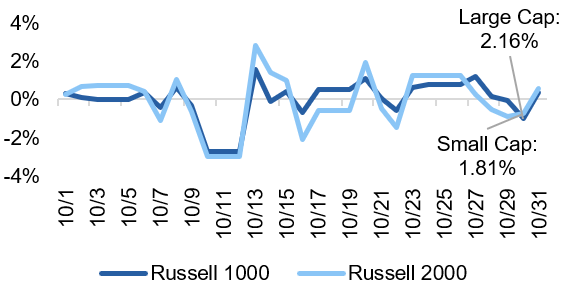
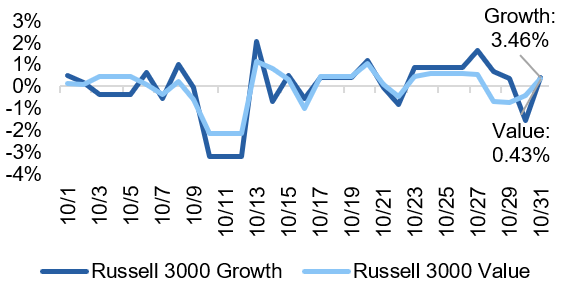
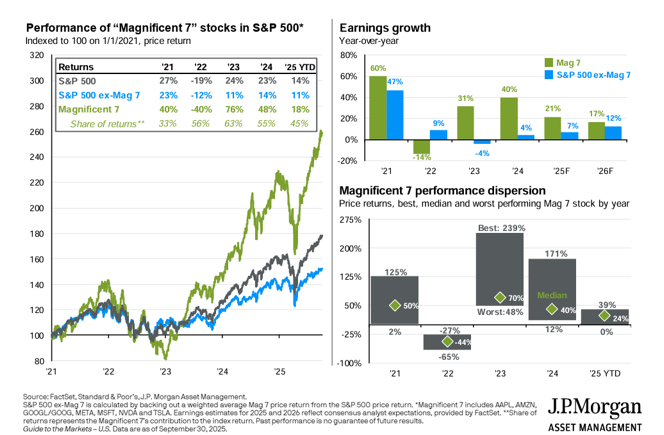
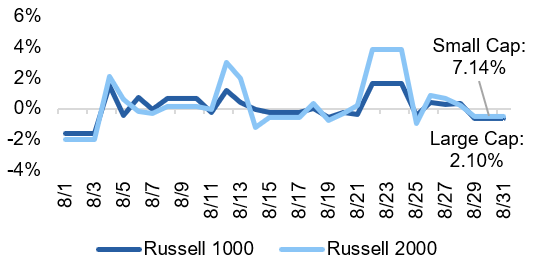
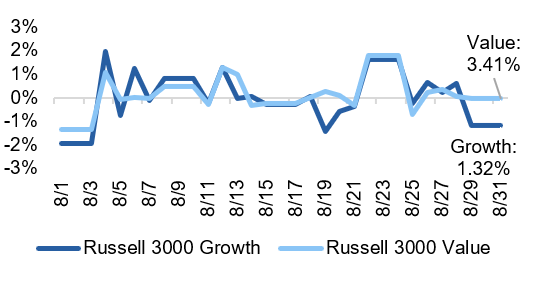
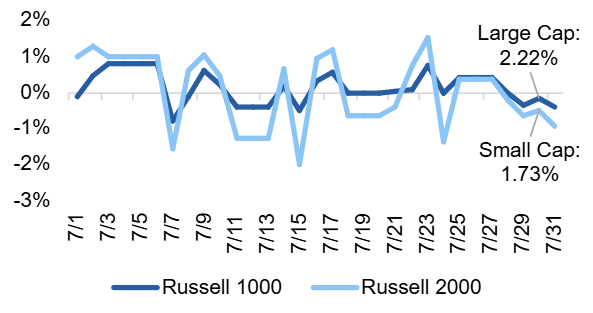
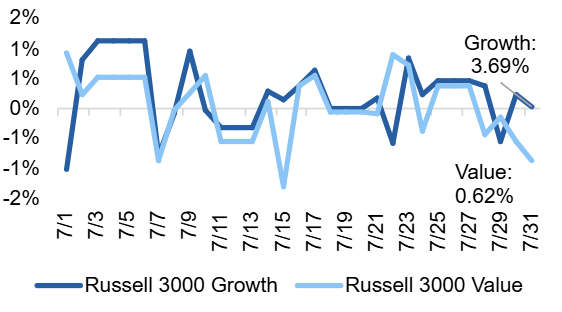
U.S. equity markets entered Q1 2026 with considerable momentum following the S&P 500’s strong 2025 close, where the index gained 17.9% for the year and posted its third consecutive year of double-digit returns. Q4 2025 closed with notable leadership rotation: value outperformed growth; cyclical sectors, including financials, industrials, and healthcare led; and Magnificent 7 correlations fractured for the first time in the cycle. Small caps, as measured by the Russell 2000, were up 2.2% in Q4, finally beginning to perk up on improving macro expectations. January 2026 extended this momentum, supported by strong Q4 earnings releases and fiscal stimulus optimism from the OBBBA. However, the quarter was violently interrupted on February 28, when joint U.S.-Israeli military strikes on Iran triggered retaliatory attacks across the Gulf and the closure of the Strait of Hormuz. The S&P 500 finished the quarter down 4.6%, led by the energy sector while consumer discretionary and technology faced pressure from rising oil prices compressing consumer purchasing power. Equity markets swung sharply in March as conflict headlines drove outsized daily moves – falling as much as 1.7% on March 26 before surging 2.9% on March 31 to close out the quarter. Healthcare and defense-related names outperformed as AI capex narratives gave way to geopolitical risk-premium repricing. The more economically sensitive small- and mid-cap market reversed its outperformance and underperformed their large cap peers.
2026 Forward Outlook
The U.S. equity outlook for the remainder of 2026 has bifurcated sharply: the base case before February 28 (continued AI-driven earnings growth, multiple expansion, broadening leadership) must now be weighed against a scenario where elevated oil prices compress consumer spending, reignite inflation, and complicate the Fed’s easing path.
The Iran conflict has introduced a stagflationary risk premium into equity valuations that was absent entering the year. Morgan Stanley notes that markets have historically posted double-digit gains three and six months after the onset of major conflicts, but this historical pattern is conditioned on conflicts being contained and energy disruption temporary.
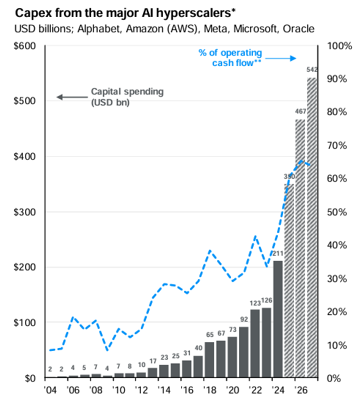
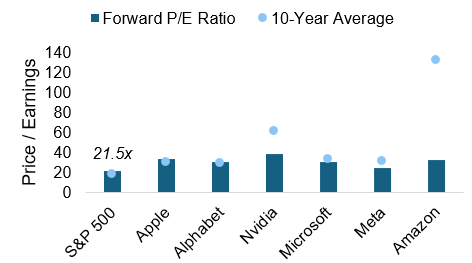
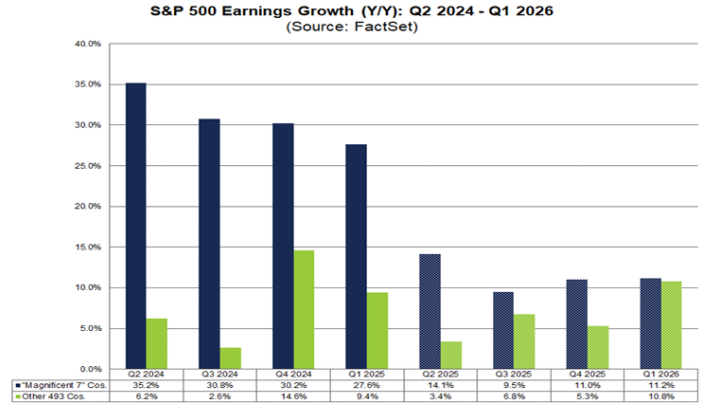
For corporate earnings, the consensus S&P 500 EPS estimate for 2026 of $305–$313 is actively under review. Energy companies and defense contractors benefit directly from the Iran conflict and increases in defense spending could drive multiyear demand for aerospace, drone, satellite, and missile defense technologies, a structural shift that could outlast the immediate conflict. Conversely, consumer discretionary, airlines, shipping, and energy-intensive industrials face near-term margin pressure.
History counsels patience. In 20 major military conflicts since World War II, the average market recovery following the initial geopolitical shock has been positive within 12 months. Investors who exit during geopolitical downturns typically miss the recovery, supporting the notion that portfolios constructed with appropriate diversification should remain in place. The key tactical pivot is from broad market beta to sector-specific positioning: overweight defense, energy infrastructure, TIPS-linked assets, and AI adoption beneficiaries with pricing power. Investors can also consider going underweight consumer discretionary, airlines, and yield-sensitive sectors where the combination of higher rates and higher energy costs creates a dual squeeze. Mid- and small-cap exposure may face near-term headwinds as higher-for-longer rates bite on financing costs and higher energy prices impact margins.
Bottom Line: The conflict in Iran has come at a challenging time for the U.S. equity sector, with stretched valuations, a stalled rate-cutting cycle, and a weak labor market. We would expect substantial sector rotation as the market tries to find safe havens against the geopolitical turmoil causing the indices to gyrate substantially.
International Equities
Q1 2026 Market Review
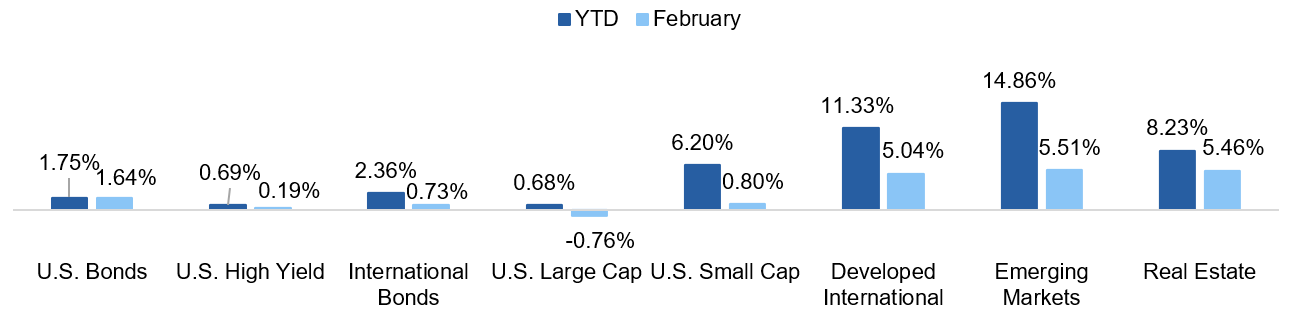
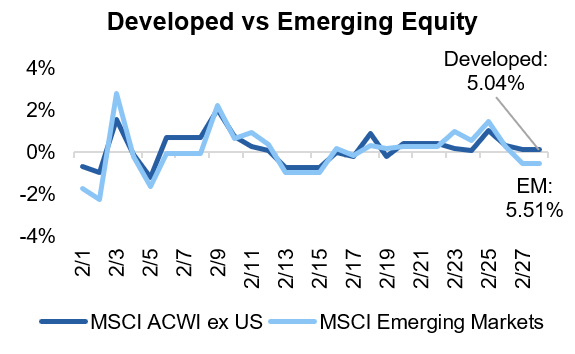
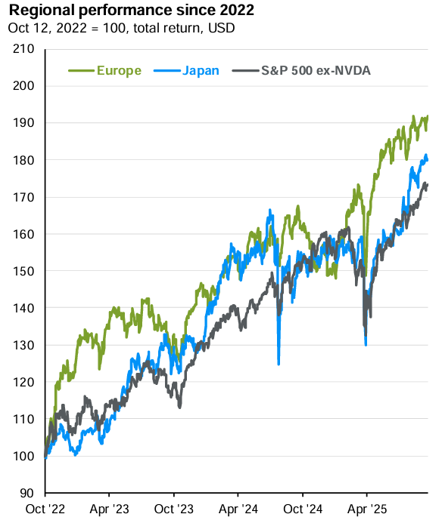
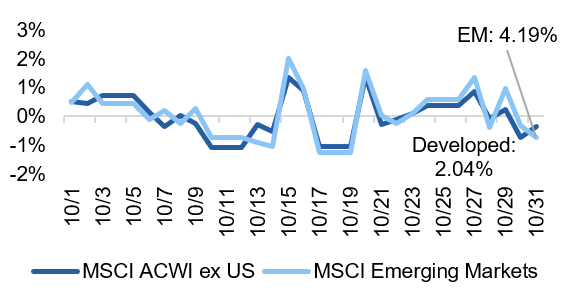
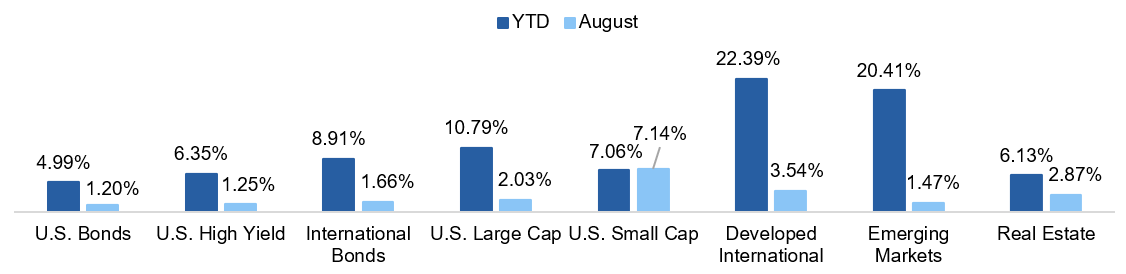
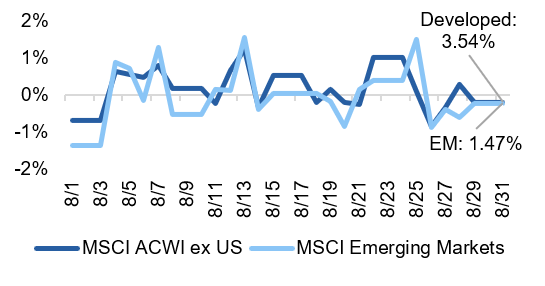
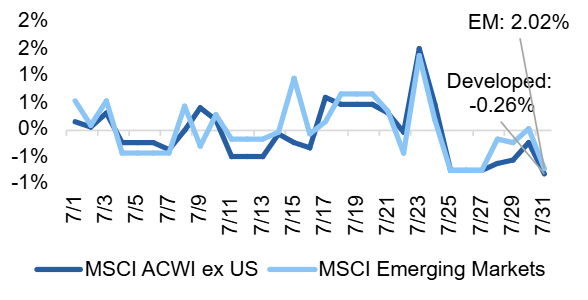
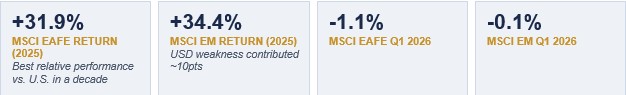
International equity markets carried extraordinary momentum into Q1 2026 following the most decisive year of outperformance versus U.S. equities in over a decade. The MSCI EAFE returned 31.9% in 2025 and the MSCI EM returned 34.4% in USD terms – roughly double the S&P 500’s 17.9% – with approximately 10 percentage points of the EAFE return attributable to U.S. dollar weakness. The MSCI EM Index opened 2026 with approximately 7% gains through early February, clearing major resistance at its 2021 highs, with broad participation (over two-thirds of constituents trading above their 200-day moving averages). European equities extended gains through January on German fiscal stimulus optimism. This constructive picture was disrupted materially when U.S. and Israeli forces struck Iran on February 28. Asia appears most vulnerable to the energy supply shock given its dependence on Persian Gulf oil and LNG imports, while Europe faces meaningful exposure through energy price pass-through and slowing growth. The near-term dollar appreciation impulse – historically a headwind for international equity returns for USD-based investors – has arrested the dollar’s decline, at least temporarily, removing one of the key 2025 tailwinds for international equities.
2026 Forward Outlook
The Iran conflict has introduced the most significant near-term headwind to international equity performance since the 2022 Russia-Ukraine crisis, but the structural case for an international allocation remains compelling, and, in some respects, is strengthened by the conflict’s dynamics.
The divergence in vulnerability is stark. Asia, particularly India, South Korea, Japan, and Southeast Asian manufacturing economies, faces the most acute near-term pressure from higher energy import costs. India, with thin foreign exchange reserves and heavy Middle Eastern crude dependence, faces elevated vulnerability to prolonged disruption, with higher energy costs feeding inflation and weakening the rupee. South Korea, home to Samsung and other global technology players, faces energy cost pressure on semiconductor manufacturing. Wheat prices have also risen, with food-importing countries facing acute stress from the conflict’s agricultural disruption.
Europe’s exposure is meaningful but more manageable. Chatham House estimates that if the conflict is contained, European inflation in 2026 would be approximately 0.5 percentage points higher than pre-conflict forecasts. A more severe scenario – oil at $130 per barrel – could push Eurozone inflation to over 4% year-over-year, potentially forcing the ECB to raise rates and causing the Eurozone economy to contract in Q2. Germany’s fiscal stimulus, however, remains a powerful structural support for European equities, and the MSCI EAFE’s high cyclical weighting (60% in Financials, Industrials, Materials, and Consumer Discretionary) provides exposure to sectors that can absorb energy cost increases through pricing power.
Despite near-term headwinds, the structural bull case for international equities remains intact. Valuations are still significantly cheaper than U.S. equivalents even after 2025’s strong run. The dollar’s longer-term downtrend, driven by geopolitical fracturing and a shift away from dollar-denominated assets, may actually be reinforced by the unilateral nature of the U.S. decision to strike Iran. Dollar weakness will likely resume once hostilities subside, providing a renewed tailwind for international equity returns.
Emerging markets require the most careful differentiation. Energy exporters – Gulf states, Brazil, Colombia, Nigeria – benefit directly from higher oil prices. Latin America, particularly Brazil and Mexico, remains a high-conviction overweight on outsized monetary policy stimulus, supply chain reconfiguration, and oil export revenue. China, despite modest 2026 growth headwinds from higher energy costs, is relatively insulated given its massive renewable energy investments, diversified hydrocarbon suppliers, and strategic petroleum reserves. In fact, some Chinese analysts see the war as a net positive for China’s competitive position.
Bottom Line: While in the short-term, overseas markets are vulnerable to the impact of higher energy prices, there will be winners and losers in that space depending on the oil reliance coming from the Strait of Hormuz. On the assumption that the conflict will end, we expect this to accelerate the shift out of U.S. equity markets and U.S. dollars into overseas markets where valuations are more supportive.
U.S. Fixed Income
Q1 2026 Market Review
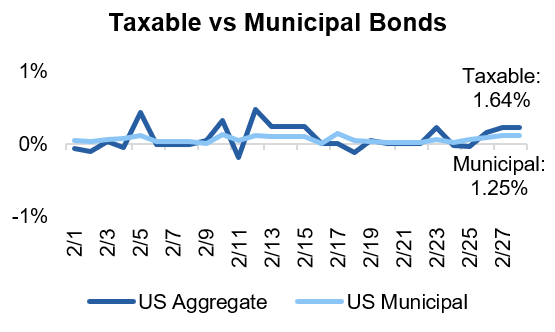
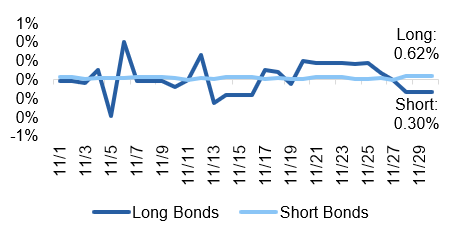
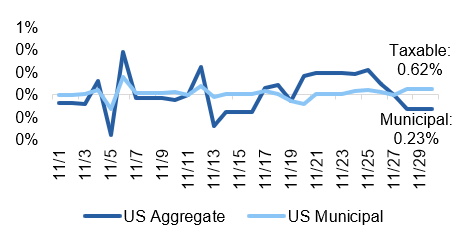
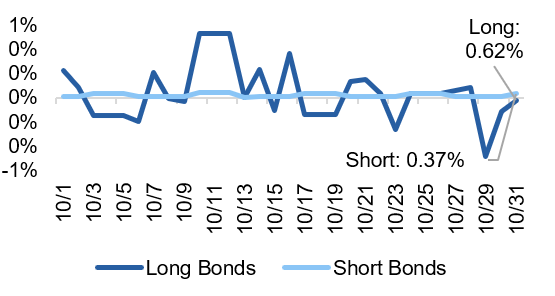
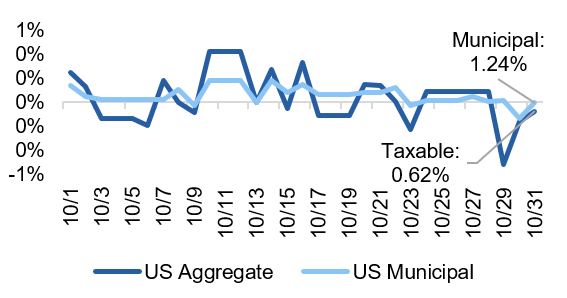
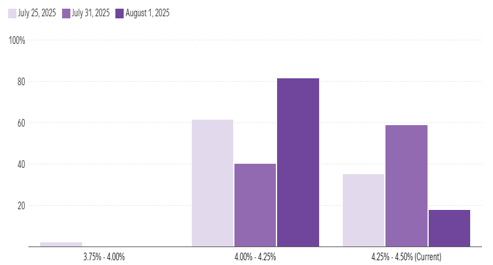
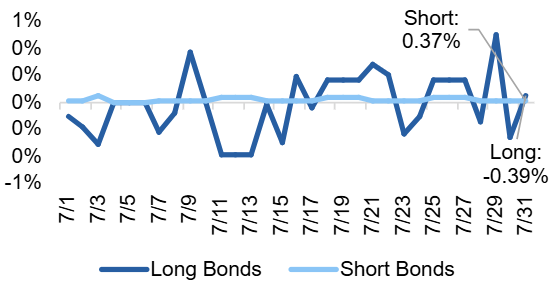
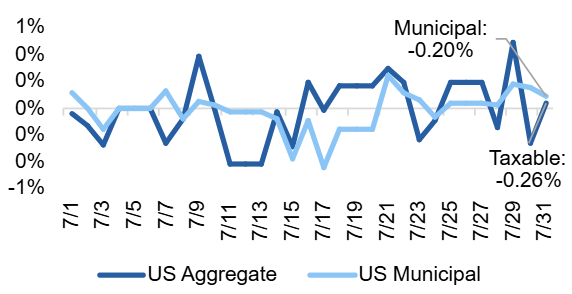
Q1 2026 opened with fixed income markets navigating a complex cross-current of moderating inflation, a cautious Federal Reserve, and – most disruptively – the outbreak of the U.S.-Israel military conflict with Iran on February 28, 2026. The quarter began with the Bloomberg U.S. Aggregate enjoying tailwinds from the Fed’s Q4 2025 rate cuts (which brought the federal funds rate to 3.50%–3.75%) and investor optimism around a gradual easing cycle. The 10-year Treasury yield briefly traded as low as 3.93% in late February, reflecting a rally driven by soft economic data, weakening consumer confidence, and falling oil prices. That dynamic reversed sharply when U.S. and Israeli forces launched strikes on Iran, closing the Strait of Hormuz. The 10-year Treasury yield climbed from 3.96% to as high as 4.4% in March, defying the typical safe-haven bid for Treasuries. The Fed held rates unchanged at its March 17–18 FOMC meeting, their second consecutive hold, as policymakers weighed oil-driven inflation risks against a softening labor market that shed 92,000 payroll jobs in February.
2026 Forward Outlook
The remainder of 2026 presents one of the most complex fixed income environments in years, with the Iran conflict reshaping nearly every element of the rate, inflation, and credit outlook. The direction of oil prices – and the duration of Strait of Hormuz disruption – is now the single most important variable for fixed income investors, outshining the previous concerns of a weakening labor market and stubborn inflation.
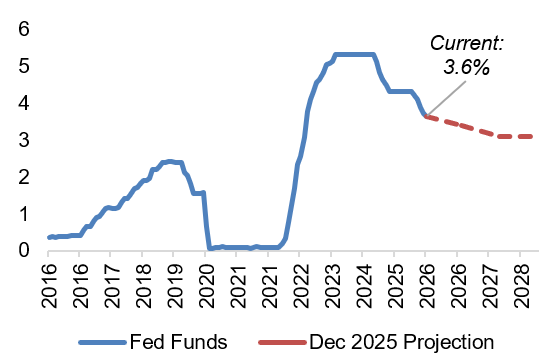
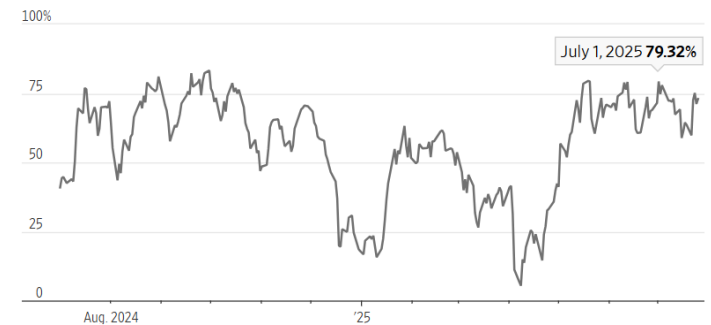
The Iran conflict has materially complicated the Fed’s policy path. Before the February 28 strikes, consensus forecasted two 25-basis-point cuts in 2026. The Atlanta Fed’s Market Probability Tracker has shown a nearly 20% probability of a rate hike, a sharp contrast to the December 2025 “Dot Plot.” Some economists project Brent crude averaging $150 per barrel over the next six months if the conflict lasts three months, which would push headline PCE inflation well above 3% and force the Fed’s hand to hike rates. The OECD recently raised the inflation outlook for the U.S. to 4.2%, illustrating the potential for rising prices as a result of the conflict. The Fed’s updated March projections forecast year-end core PCE at 2.7%, with Chair Powell acknowledging that “nobody knows” the full economic impact and signaling the central bank will act as needed. Powell’s term ends May 15, and Kevin Warsh’s nomination to succeed him remains stalled in the Senate amid a Justice Department probe, adding a layer of institutional uncertainty.
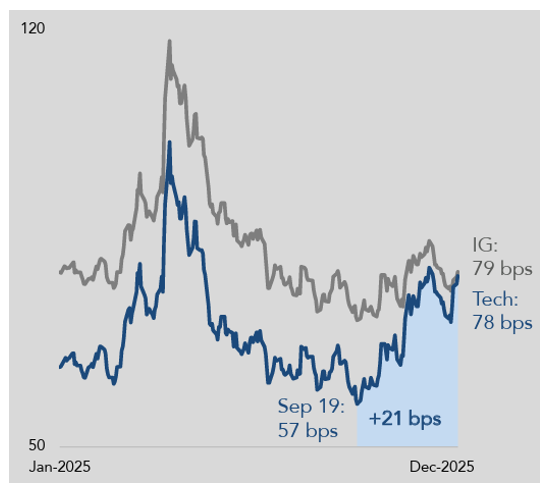
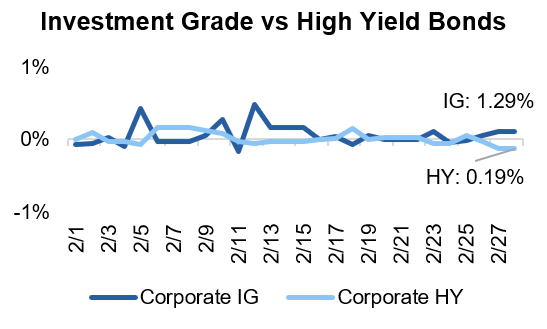
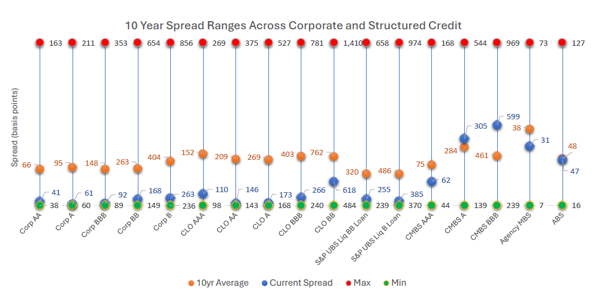
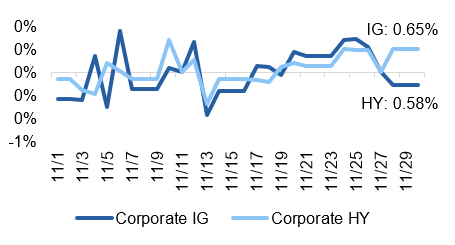
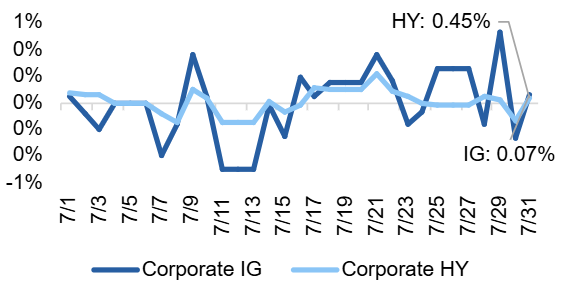
Investment grade credit faces elevated spread risk. Prior to the conflict, IG spreads were near multi-decade tights of 80 basis points with little cushion. AI infrastructure issuance, which dominated 2025 supply, will continue to absorb market capacity, but rising uncertainty and potential economic slowdown from the oil shock may trigger spread widening in lower-rated IG names.
Agency MBS retains its most-favored status within core fixed income. Spread levels relative to IG corporates remain attractive, and the asset class benefits from its relative insulation from energy-driven credit risk. The technical backdrop – supplementary leverage ratio (SLR) regulatory relief and the end of QT – remains intact.
USD EM debt faces headwinds from the Iran conflict. While EM fundamentals remain broadly sound, higher oil import costs are pressuring India, South Korea, and other net importers, illustrating the outsized impact of the oil disruption on Asian economies.
Bottom Line: U.S. fixed income returns will be a function of whether the market sees the inflationary pulse coming from higher oil prices as temporary or more permanent. Against the backdrop of a weakening labor market, the Fed will be forced to pick between looking through the inflationary surge or increasing rates and slowing the economy further. All eyes will be on Warsh and how he is interpreting the data.
Private Equity

Q1 2026 Market Review
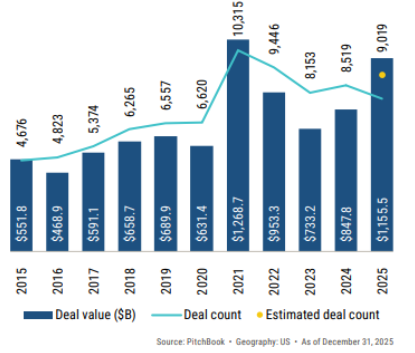
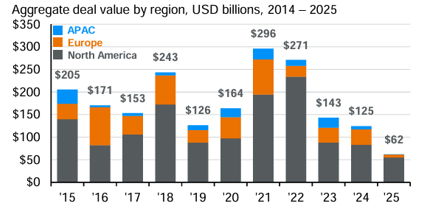
Private equity entered Q1 2026 with genuine momentum after a rocky 2025. Total deal value reached $1.2 trillion across 9,000+ transactions in 2025 – only the second time on record above $1 trillion – with exit activity recovering strongly to $682 billion, the best since 2021. The H2 2025 acceleration, driven by macro clarity and Fed rate cuts, carried into January 2026 with sponsor confidence returning, financing costs lower, and bid-ask spreads narrowing on quality assets. The Fed’s three 2025 rate cuts had reduced the average cost of PE middle market term loans by approximately 300 basis points from cycle peaks, directly improving LBO return profiles. However, the Iran conflict outbreak on February 28 introduced a new source of macro uncertainty that has caused GPs to pause M&A processes and limited partners to reassess portfolio exposure. Deal processes underway at quarter-end have been paused or extended as buyers wait for clarity on the conflict’s economic duration. The disruption echoes the Q2 2025 tariff-induced lull, suggesting that H1 2026 deal momentum may disappoint with recovery a function of the outlook on the conflict. Fundraising remains a structural challenge: global PE capital raised fell 11% in 2025 for the second consecutive annual decline, with LPs withholding commitments pending improved distribution metrics.
2026 Forward Outlook
Private equity’s 2026 outlook has been complicated by the Iran conflict but the structural cycle recovery remains intact, with activity expected to rebound once geopolitical uncertainty clears.
The most immediate impact of the Iran conflict on PE is the re-widening of bid-ask spreads and the deferral of exit processes. Rising rate expectations following the Fed’s hawkish hold at the March meeting reduce the DCF-driven uplift to asset valuations that had been building since late 2024. For leveraged buyouts specifically, any reversal of the rate-cut path meaningfully dampens return assumptions, since PE’s carried interest economics are highly sensitive to the entry and exit multiple gap. Morgan Stanley estimates that the cost of PE middle market financing has declined 300 basis points from cycle peaks, but the Iran conflict risks narrowing this advantage if rates stay higher for longer.
The Iran conflict also creates sector-specific opportunities. Defense, aerospace, and energy infrastructure are receiving increased government spending that could drive multiyear demand – exactly the type of predictable, contracted revenue stream that PE platforms prize. Energy infrastructure (pipelines, LNG terminals, grid modernization) and digital infrastructure (data centers, power generation) remain high-conviction deployment themes, and the conflict arguably accelerates both: the Strait of Hormuz closure has renewed calls for energy diversification and domestic production, while defense budgets across NATO are being revised upward.
The secondaries market and continuation vehicles (CVs) remain critical tools for portfolio management in 2026. LPs are increasingly using secondaries for liquidity (due to the explosive growth over “evergreen” funds) and portfolio rebalancing rather than as a last resort, and GPs are using CVs to manage legacy 2021–2022 vintage positions that remain below acquisition cost. Dry powder, while declining from record levels, remains ample to fund large buyouts once clarity surrounding the macro picture returns. The key milestones to monitor are, once again, the duration of the Iran conflict, the Fed’s June meeting for interest rate insights, and Q2 earnings season, which will reveal the extent of energy cost pass-through to PE portfolio company margins.
Bottom Line: PE remains an attractive asset class, however the excess returns generated over public equity may be more muted than in previous decades. Higher borrowing costs, an increase in the number of managers, and more price transparency mean that being selective in choosing your manager is more important than ever.
Private Debt
Q1 2026 Market Review
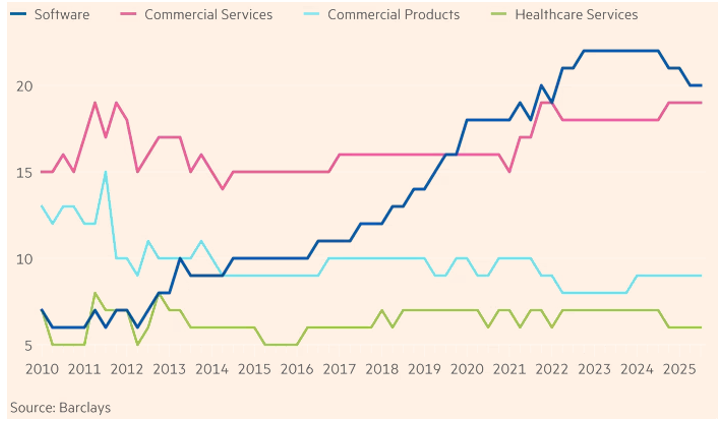
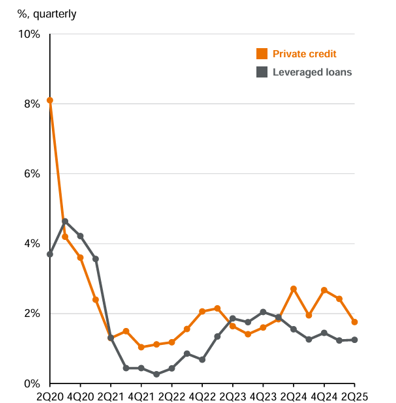
Private debt markets entered Q1 2026 facing their most significant liquidity test since the asset class became a dominant source of non-bank financing. What began as isolated fraud-driven failures in 2025 with First Brands and Tricolor in the U.S. auto parts sector cascaded into a broad reassessment of BDC and interval fund structures as retail investors sought exits. The wave of gating events in Q1 was unprecedented in scale: Blackstone’s BCRED faced $3.8B in requests (7.9% of its $82.5B AUM) and injected $400M of firm capital to avoid formal gating; BlackRock’s HPS Corporate Lending Fund (HLEND) received $1.2B in withdrawal requests (9.3% of NAV) – its first-ever redemption breach – approving only $620M; Blue Owl permanently froze OBDC II; Cliffwater’s $33B flagship fund received requests for 14% of shares, double its 7% regulatory maximum quarterly cap; and more asset managers followed. Beneath the liquidity headlines, two structural fault lines are widening: first, AI-driven disruption of SaaS and enterprise software borrowers – approximately 19% of total direct loans and 15–17% of BDC portfolios by deal count – is eroding cash flows and threatening the revenue models underpinning loan valuations; second, covenant erosion through covenant-lite structures and escalating PIK usage – approximately 10% of BDC interest income now accrues as PIK rather than cash, a measurable proxy for shadow credit stress. The Iran conflict added a third layer: higher energy costs increase operating expenses for borrowers, higher-for-longer rates intensify refinancing pressure on 2020–2021 vintage floating-rate debt, and resurgent inflation threatens the collateral values underpinning loan marks.
2026 Forward Outlook
The 2026 outlook for private debt is defined by two compounding risk streams that will fundamentally differentiate returns across managers and vintages. On credit quality: AI disruption is systematically eroding the revenue models of SaaS and enterprise software borrowers – the single largest borrower category in direct lending at approximately 19% of outstanding loans. Software stocks fell ~30% between October 2025 and February 2026 with roughly 15% of SaaS borrowers struggling to cover interest expenses. Morgan Stanley projects direct lending defaults could reach 8%; UBS warns of 13% in a severe AI disruption scenario. However, both agree this would reprice, not break, the asset class given its distributed structure and superior bank capitalization versus 2008.
On structure and liquidity: covenant-lite terms have compressed workout timelines and the first observable signal of borrower distress is now often a missed payment rather than a covenant breach. 23 of 32 rated BDCs face $12.7B in unsecured debt maturities in 2026 – a 73% increase over 2025 – creating a compounding refinancing wall. The opacity of private credit valuations is a structural liability: managers who mark their own assets delay stress recognition, creating conditions for sudden gaps when secondary market transactions or forced sales reveal true pricing. Widening credit spreads and higher bank collateral charges are raising effective back-leverage costs and compressing net returns. The Q1 gating events at Blackstone, BlackRock, Blue Owl, Cliffwater, Ares, and Apollo have exposed a fundamental structural tension: retail capital expecting quarterly redemption access is mismatched with assets requiring months or years to liquidate at fair value. We favor senior secured, hard-covenant structures with documented workout capabilities and limited software sector concentration and intend to avoid covenant-lite legacy vintages from 2020–2022.
Bottom Line: Private debt as an asset class is here to stay however they are not immune to the stresses causing their publicly traded peer’s spreads to widen. We expect a continued tough ride for the near term – not just because of liquidity issues but also because the economic fundamentals are changing.
Real Estate Markets
Q1 2026 Market Review
Real estate markets entered Q1 2026 with cautious optimism – valuations had stabilized after two years of cap rate expansion and transaction volumes were recovering (up 25% year-over-year in Q3 2025). The $936 billion CRE debt maturity wall arrived in earnest in Q1, with a wave of commercial real estate loans requiring refinancing in an environment where interest rates remained elevated and cap rates had not compressed sufficiently to generate equity value. Office properties – impaired structurally by remote work trends – and hospitality assets are facing the softest transaction markets. Industrial and multifamily assets maintained the strongest fundamentals, supported by persistent housing supply constraints and e-commerce demand. The Iran conflict added new complexity: surging energy costs directly affect real estate operating expenses (utilities, HVAC), rising long-term Treasury yields push up commercial mortgage rates, and increased macro uncertainty has deferred transaction decisions from buyers who had been poised to re-enter the market.
2026 Forward Outlook
Real estate’s path for the remainder of 2026 is now shaped by three competing forces: the structural recovery driven by supply discipline and stabilizing valuations; the $936 billion debt maturity wall creating forced transaction activity; and the Iran conflict’s impact on rates, energy costs, and investor risk appetite.
The Iran conflict introduces a specific set of real estate dynamics. Higher energy costs increase operating expenses, particularly for industrial and office properties with high utility consumption. Rising long-term Treasury yields directly increase commercial mortgage rates and cap rate expansion pressure, delaying the cap rate compression necessary for core real estate revaluation.
Data centers represent the most compelling secular growth story in real estate and are directly reinforced by the Iran conflict: the energy security focus accelerates domestic power generation investment, while AI infrastructure demand, which was already driving unprecedented data center development, remains undiminished by geopolitical events. Industrial and logistics real estate maintains strong fundamentals. New construction remains muted across property types, supporting occupancy and rent growth. Supply chain reconfiguration away from the Strait of Hormuz has increased demand for domestic warehousing and logistics infrastructure, a direct near-term tailwind. The outlook for multifamily is likely a mixed bag: housing supply constraints remain acute and affordability pressures prevent many renters from transitioning to homeownership. Office remains a challenged sector of the real estate market as work-from-home structural trends are entrenched. Additionally, the Iran conflict’s uncertainty may further defer corporate real estate decision-making. Hospitality faces a compound headwind: surging jet fuel costs are driving airline ticket prices sharply higher (Gulf carriers are operating under major airspace restrictions), dampening business and leisure travel demand.
The base case for core real estate returns in 2026 is low-single-digit total returns with capital appreciation remaining negative or flat. Value-add and opportunistic strategies targeting distressed debt and repriced assets offer the most compelling risk-adjusted entry in the current cycle.
Bottom Line: Real estate may have a challenging year ahead but given the ebb and flow of supply it is setting the stage for future growth a few years out. In this environment, it makes sense to keep powder dry and consider distressed or opportunistic assets.
DISCLOSURES
The information provided is for educational and informational purposes only and does not constitute investment advice and it should not be relied on as such. It should not be considered a solicitation to buy or an offer to sell a security. It does not take into account any investor’s particular investment objectives, strategies, tax status or investment horizon. You should consult your attorney or tax advisor.
The views expressed in this commentary are subject to change based on the market and other conditions. These documents may contain certain statements that may be deemed forward-looking statements. Please note that any such statements are not guarantees of any future performance and actual results or developments may differ materially from those projected. Any projections, market outlooks, or estimates are based upon certain assumptions and should not be construed as indicative of actual events that will occur. All information has been obtained from sources believed to be reliable, but its accuracy is not guaranteed. There is no representation or warranty as to the current accuracy, reliability, or completeness of, nor liability for, decisions based on such information and it should not be relied on as such.
Centura Wealth Advisory is a registered investment advisor. Advisory services are only offered to clients or prospective clients where Centura Wealth Advisory and its representatives are properly licensed or exempt from licensure. 12255 El Camino Real, St. 125, San Diego, CA 92130.