After experiencing zero in 2023, the S&P 500 took more than two years before making a new all-time high. Fast forward to the end of the first quarter, witnessing the S&P 500 march its way to 22 new all-time high levels, on pace for the most ever. While much uncertainty surrounding monetary policy still exists, the equity markets brushed off the noise, experiencing minimal volatility. The quarter’s maximum S&P 500 drawdown of -1.7% would mark the smallest drawdown in history if the year ended as of March 31. Even gold and Japan’s stock market joined the all-time highs party, with the latter doing so for the first time since 1989.
Unlike recent quarters, chinks in the armor of the Magnificent 7 appeared to form, as three of the seven constituents (Apple, Alphabet, and Tesla) failed to outpace the broad index return of 10.8%. Ten of the eleven S&P sectors turned in a positive return. On the other hand, Nvidia continued its AI-fueled meteoric ride on way to a Q1 return of more than 82%, and we witnessed a reawakening of the meme stock mania as traders poured into the Reddit Inc., Trump Media, and Technology IPOs.
A year removed from the collapse of Silicon Valley Bank, we were reminded of the stress that higher rates have applied to the balance sheets of small and regional banks. New York Community Bank reported surprise losses on their multifamily commercial real estate loan portfolio, reminding investors that there could still be another shoe to drop. Regional banks tend to have a very large percentage of commercial real estate loans on their books, with many experiencing a high number of defaults, though the market quickly shrugged off the news and risks.
Highlighted last quarter, we felt the bond market got ahead of itself and overpriced the timing and magnitude of Fed rate cuts. Entering 2024, the market anticipated the U.S. central bank would cut six times, resulting in a projected 1.50% (150 basis points) in rate reductions, starting as early as March. As the market reassessed the Fed’s rhetoric and repriced their expectations, market yields for longer dated bonds rose sharply by 0.46% before the 10-Year U.S. Treasury rate settled and ultimately ended the quarter at 4.20%.
Market Recap
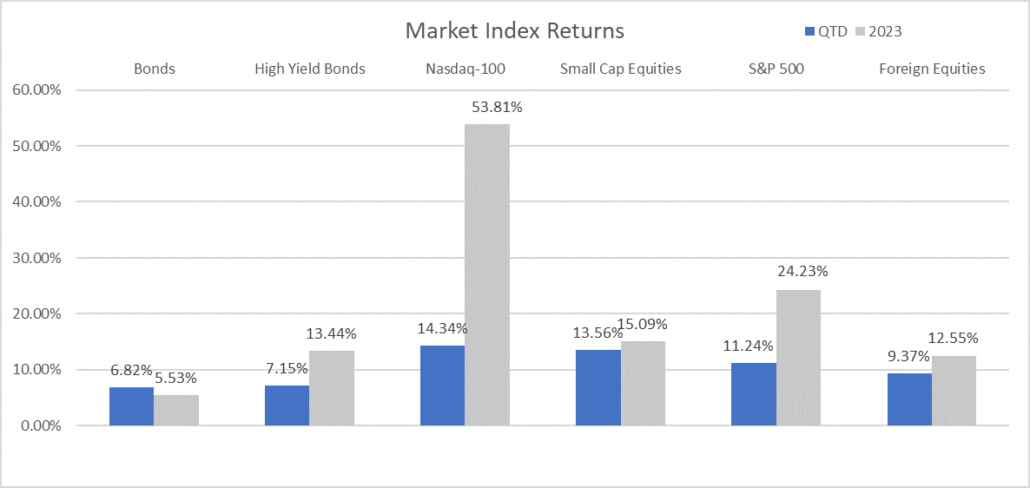
Equities – 2023 witnessed a positive correlation between yields on longer dated bonds and equity prices, which resulted in higher equity levels as yields fell and downward pressure as yields rose. This was particularly highlighted over the final two months of 2023, when the yield on the 10-Year U.S. Treasury fell from nearly 5% to 3.88% and ignited the ‘everything rally.’ The largest benefactors were asset classes like small caps and technology, which tend to be the most sensitive to higher interest rates. In contrast to last year, 2024 has seen a significant decoupling of the relationship between equities and bond yields. Fueled by AI-driven enthusiasm, expectations of Fed cuts, and unexpectedly robust earnings, the S&P 500 surged 10.8% for the quarter. This performance marks the best first quarter for the U.S. large-cap index since 2019, delivering consecutive quarters of double-digit returns.
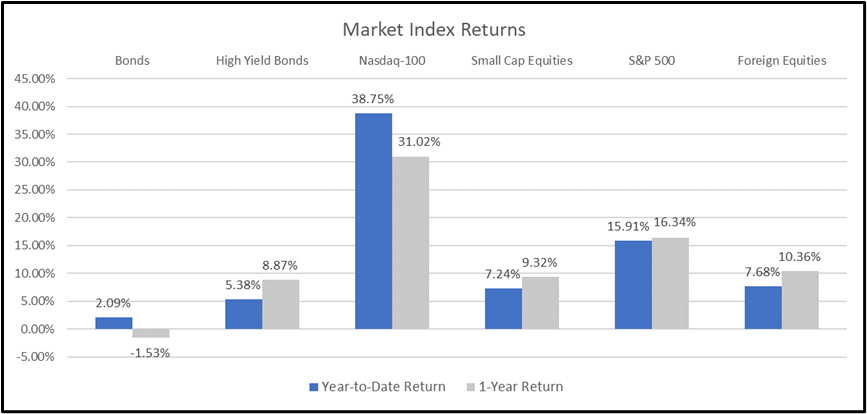
Conversely, higher yields continue to plague smaller companies with today’s higher cost of debt marring their outlook. As the market reassessed monetary policy and rates rose in the first quarter, the small-cap Russell 2000 index experienced turbulence to start the year, but ultimately eked out a 5.18% YTD return.
With a ‘soft landing’ to ‘no landing’ all but expected, the market appears to have accepted the Fed’s latest projections and are closely observing economic data for signals the Fed has the green light to lower rates. As important indicators surrounding inflation, jobs, and overall economic health flood the market, we expect the market to continue reacting counterintuitively to good news, treating it as bad news, while reacting to bad news as though it is good news. Should core inflation remain sticky and economic data remain strong, we would not be surprised to see volatility return as investors start to extend expectations surrounding a June Fed pivot.
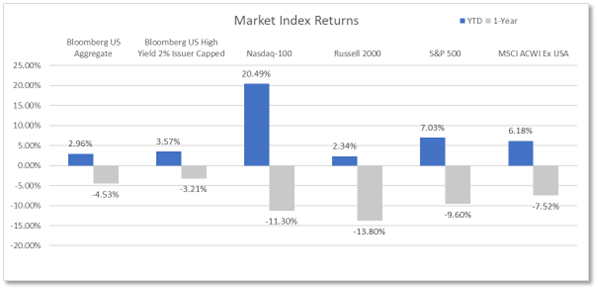
Bonds – As yields reversed course, bonds kicked off 2024 adding to their multi-year downward trend. With stronger-than-expected economic data and Fed uncertainty, the market repriced Fed expectations and the yield on the 10-Year U.S. Treasury shot from 3.88% to as high as 4.34% in mid-March. While the market has appeared to reprice monetary policy changes, robust U.S. debt issuance and the demand for U.S. Treasury securities continues to wane, failing to absorb supply and applying upward pressure on yields, exemplified by the Bloomberg U.S. Aggregate Bond Index falling 0.78% over the quarter.
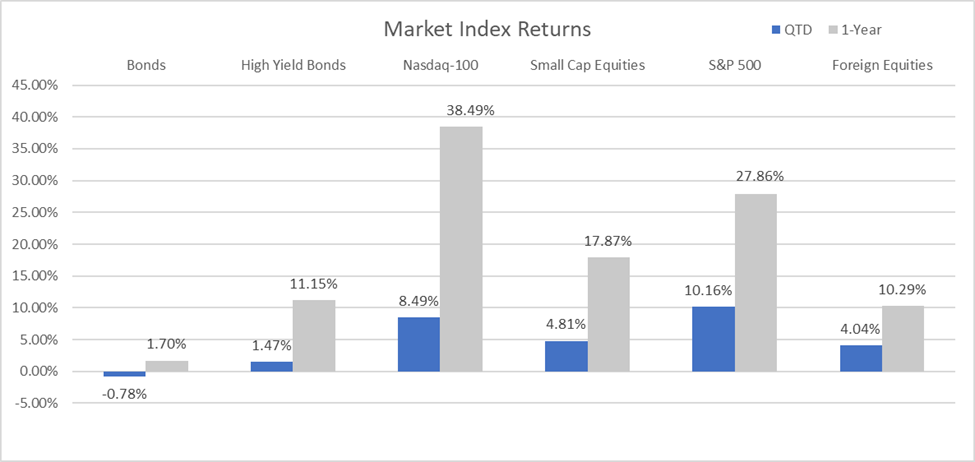
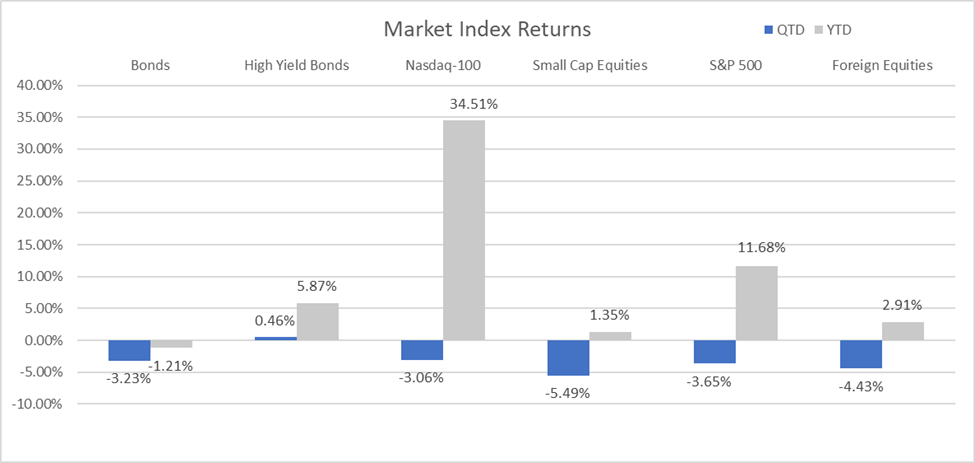
Source: YCharts. The Bloomberg US Aggregate Index was used as a proxy for Bonds; the Bloomberg US High Yield 2% Issuer Capped Index was used as a proxy for High Yield Bonds; the Russell 2000 Index was used as a proxy for Small Cap Equities; and the MSCI ACWI Ex USA Index was used as a proxy for Foreign Equities.
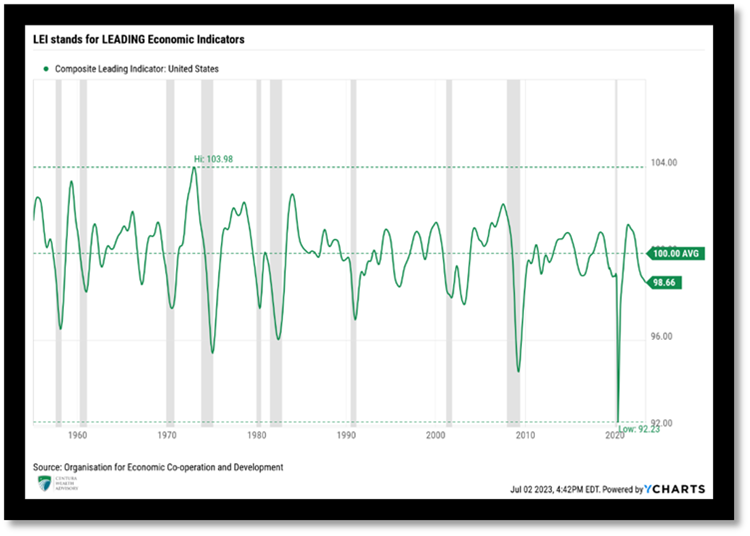
With stronger economic data, base case expectations call for the Fed successfully achieving a ‘soft landing’ and avoiding recession. However, as data has continued to surprise to the upside, many growth metrics continue moderating.
Economy: The Consumer starts slowing
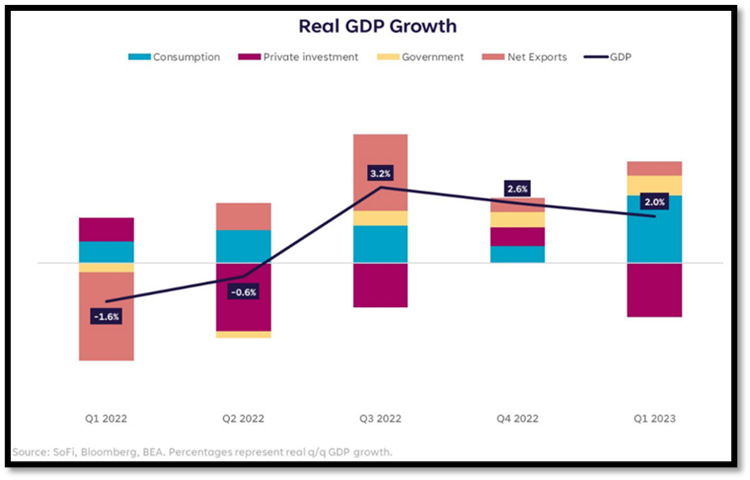
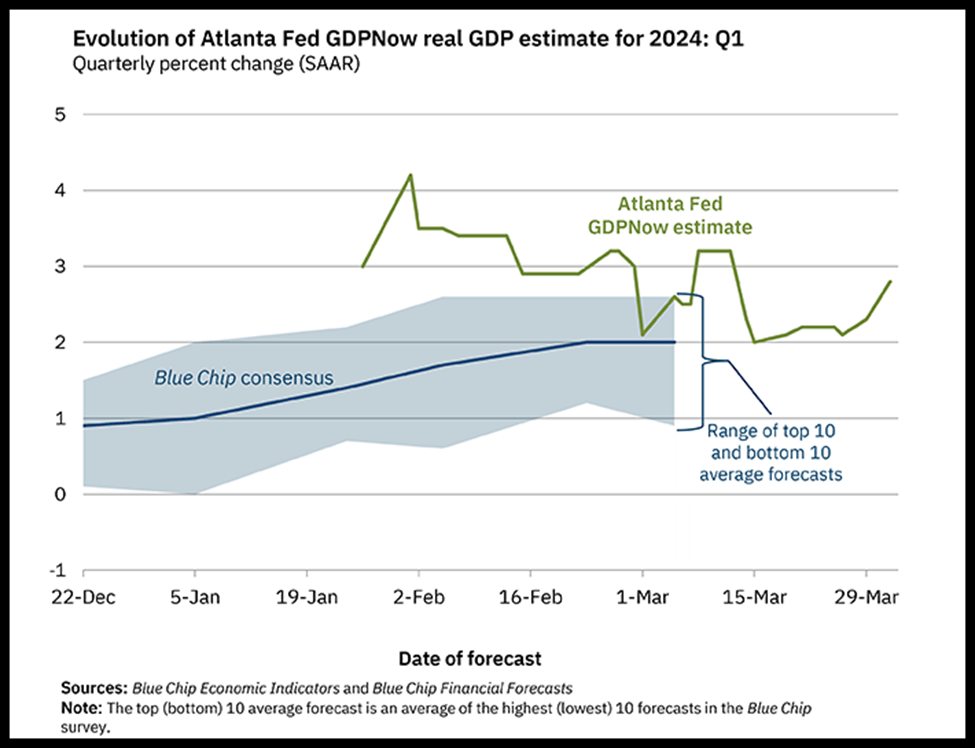
After avoiding the widely anticipated recession of 2023, and growing approximately 2.5%, the U.S. economy continues to grind higher at a moderate pace. As of March 29, 2024, the Atlanta ‘Fed’s GDPNow model for the first quarter is projecting growth of 2.3%, with the largest contribution expected to come from consumer spending, once again, and net exports expected to detract from growth.
Despite higher borrowing costs, the U.S. continues to outperform its global peers, largely due to a stable labor market that has consistently produced wage increases outpacing inflation for 10 consecutive months, through February. March’s labor report is due Friday, April 5 and wages are expected to continue to outpace pricing pressures for an 11th straight month, further supporting consumers’ ability to spend.
Unemployment
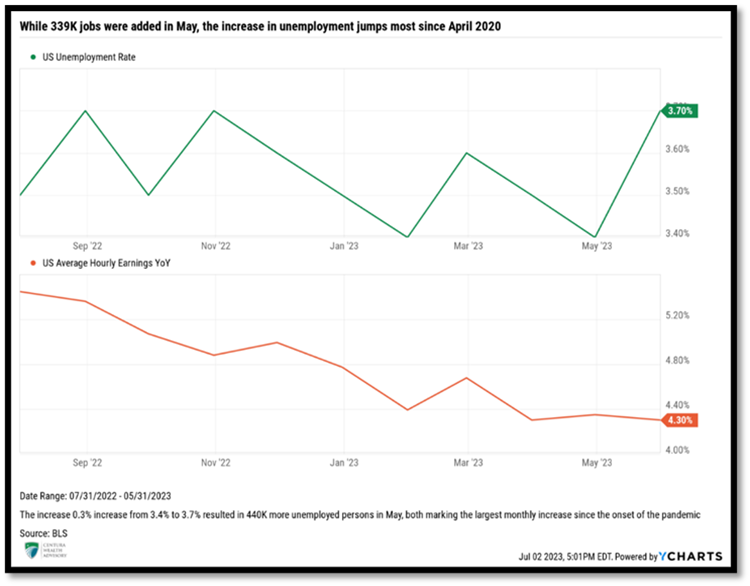
February’s Labor Market Report registered the 38th consecutive month of job gains. Estimates called for 198,000 jobs in February, and the market surprised to the upside with the addition of 275,000 jobs, though unemployment jumped 0.2% to 3.9%.
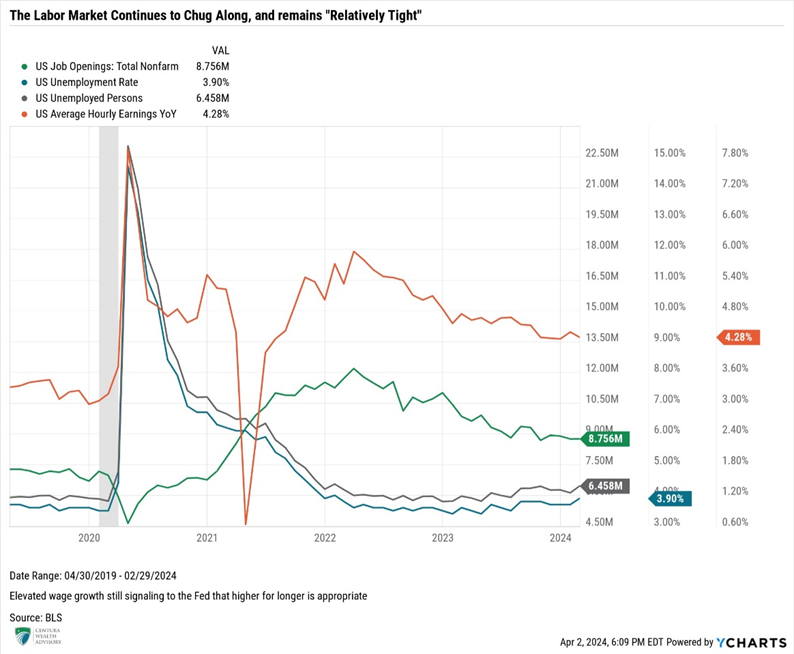
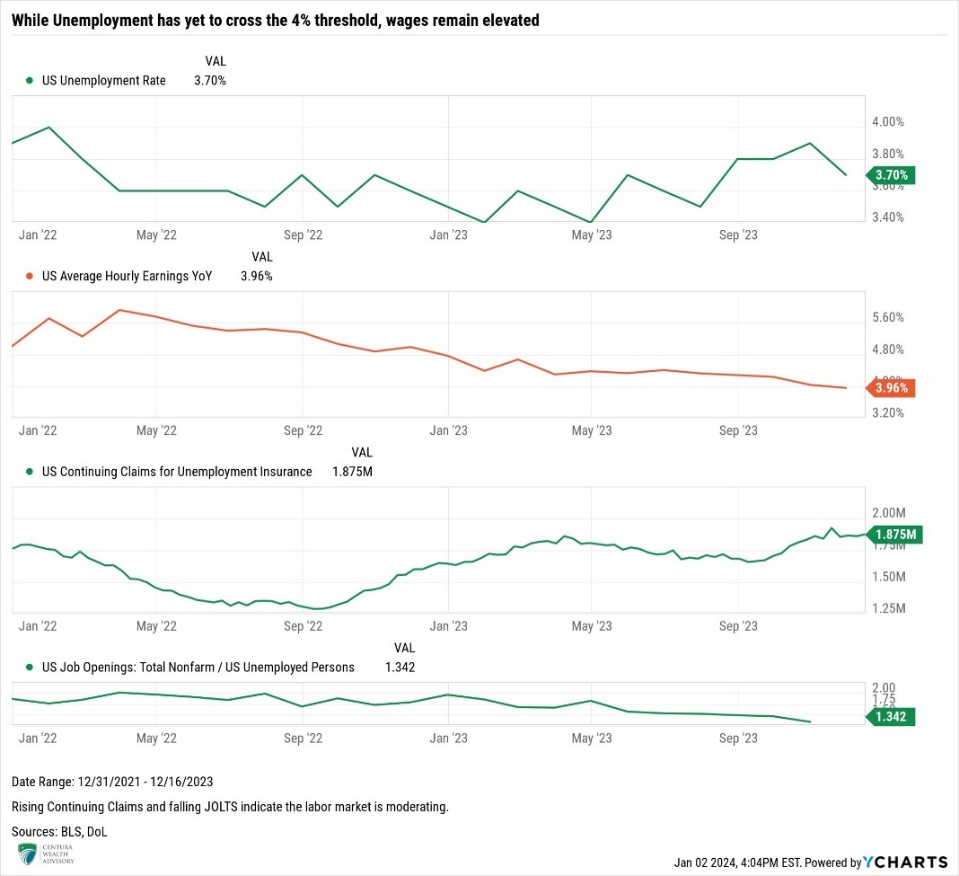
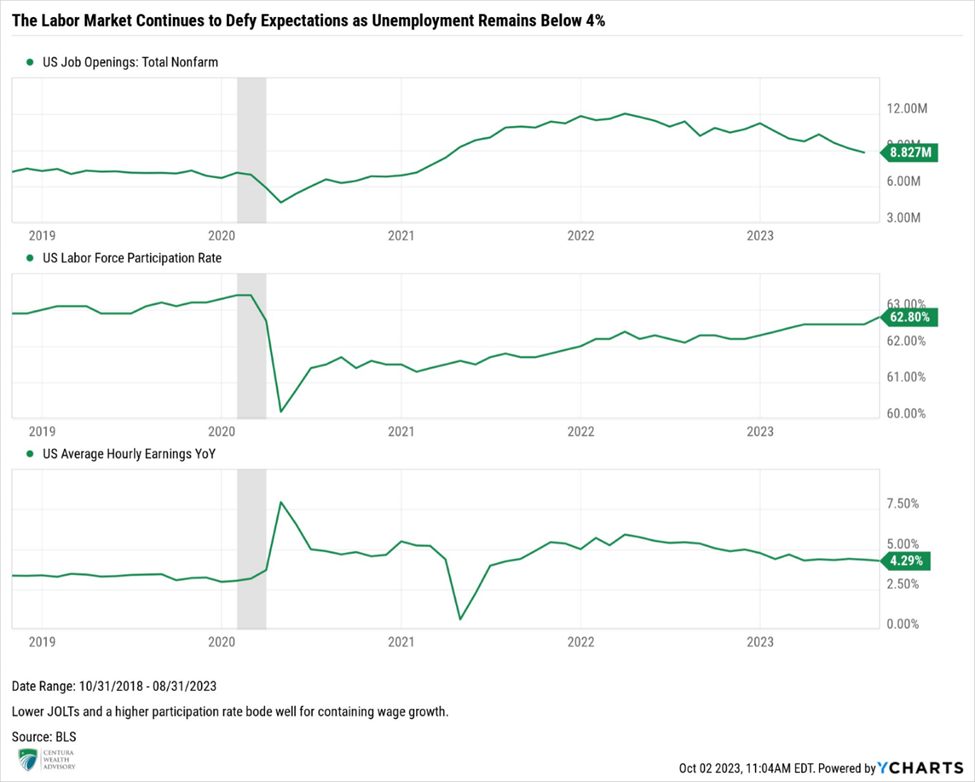
February’s unemployment rate also marked the 27th consecutive month unemployment has held below 4%, which is the longest streak since the 1960s. The labor market continues to post robust results. While trending lower since peaking in 2022, job openings (JOLTs) have been a mixed bag from month-to-month, and still remain elevated at 8.86 million. This brings the ratio of job openings to those unemployed to 1.371. While the ratio of 1.37:1 is still considered elevated above levels historically witnessed, the ratio has fallen significantly from nearly two job openings for every job posting in 2022. This indicates slack is working itself out of the system and the labor market is showing signs of tightening. The number of open jobs has fallen, while the number of unemployed job seekers has trended higher, as evidenced by the additional 334,000 unemployed persons from January to February.
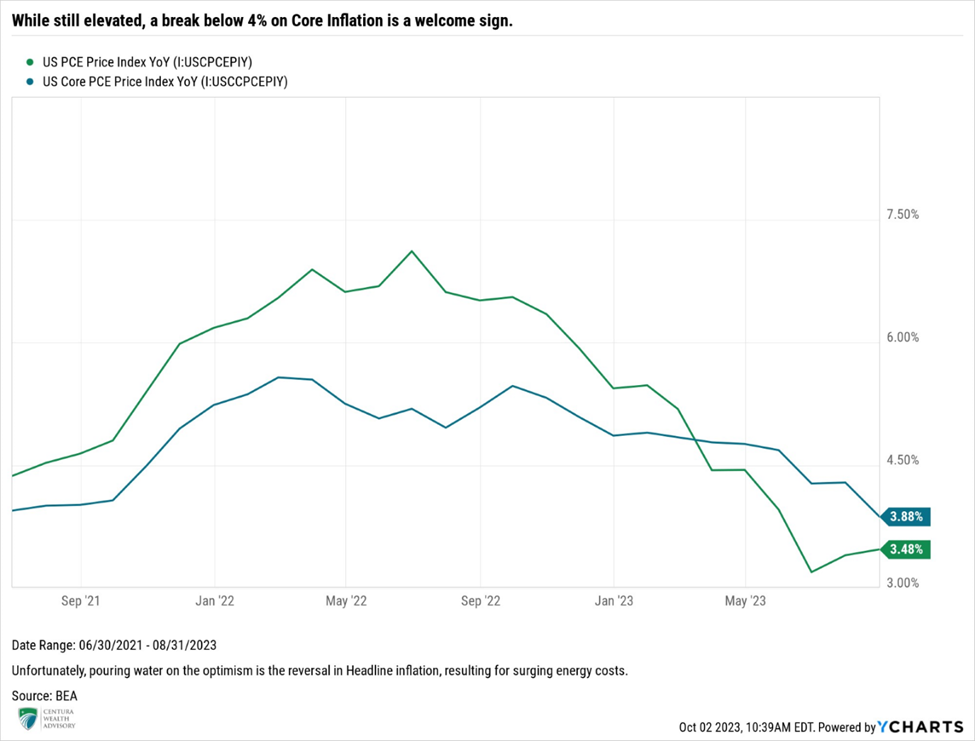
For now, the strength and resiliency of the labor market has given the Fed the confidence to keep rates higher for longer. However, sticky wage growth continues to give the Fed anxiety, as this metric has been effectively stuck around 4.3% since October 2023. While persistent and elevated wage growth brings fears of an inflation resurgence, any break below the 4% threshold would temper those fears and be well received by the Fed.
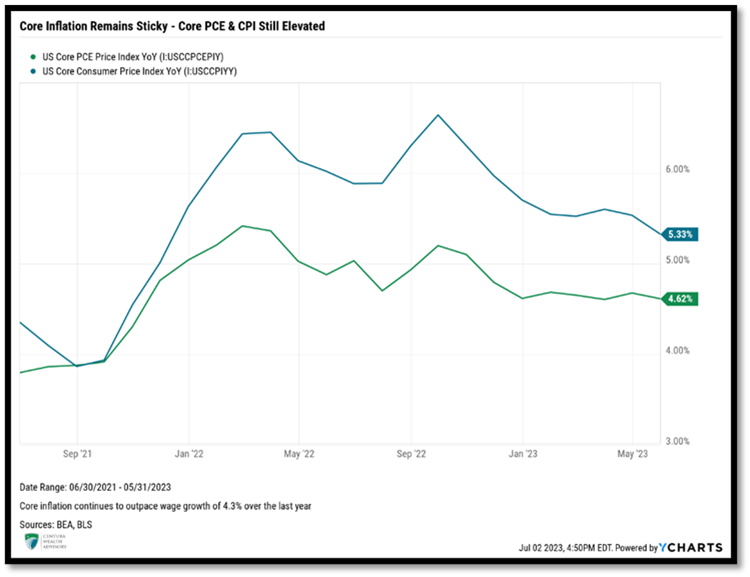
Inflation
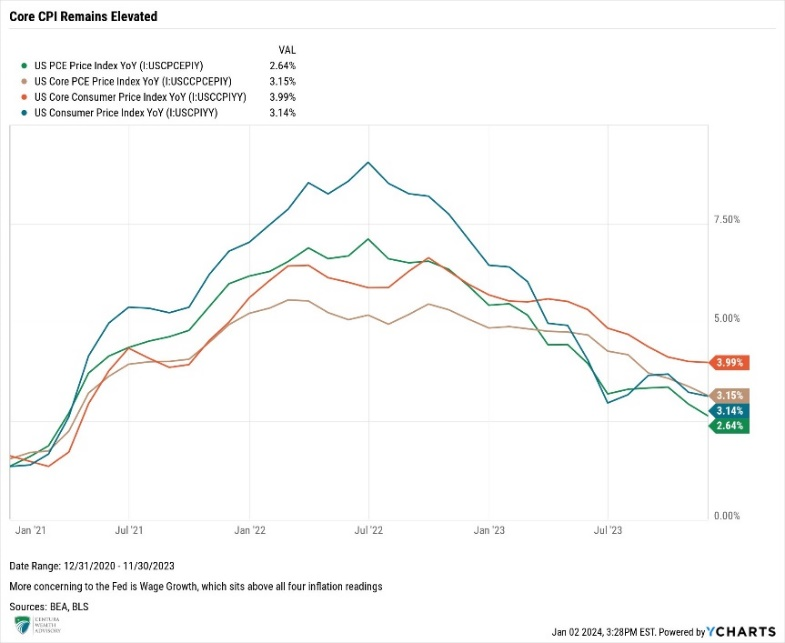
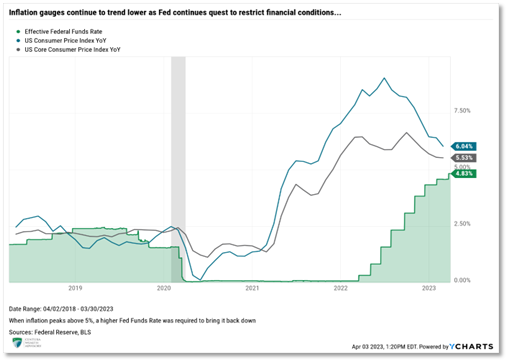
The Fed appears to be winning their battle against inflation, as pricing pressures look to be tamed and headed towards the Fed’s 2% target – though it is still too early for the Fed to declare their victory lap. On the surface, all major inflation readings reside below 4%, with both PCE readings printing below 3% over the last year, through February.
Shelter and gasoline represented approximately 60% of the monthly gain in Headline CPI in February, with additional pricing pressure from used cars, apparel, motor vehicle insurance, and airfares at the highest levels since May 2022. Boeing woes are forcing airlines to cut their flight capacity and we expect further pricing pressure on air travel over the next several months. Additionally, we anticipate continued upward pressure on energy prices, leading to volatility on the headline CPI numbers as we progress through the summer months.
Just as elevated wage growth remains troublesome to the Fed, the stickiness of core services, particularly shelter costs, supports their decision to exercise patience before cutting rates. The rolling three-month core CPI is running at an annualized rate of 4.2%, which is the highest since June 2023.
Too Soon to Pivot
Defying market expectations of a March rate cut, the Fed met twice in the first quarter and left rates unchanged, illustrating their unflagging commitment to bring inflation back to its long-term target of 2%. Since initiating rate increases in March 2022, the Fed raised rates eleven times, bringing the target range for the Fed Funds rate to the current range of 5.25% to 5.50%. During this period, Fed Chair Jerome Powell has also been reducing the Fed’s balance sheet by $95 billion per month, resulting in a decrease in assets of nearly 16.5%, or approximately $1.48 trillion, since its peak in April 2022.
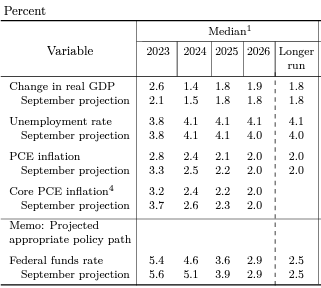
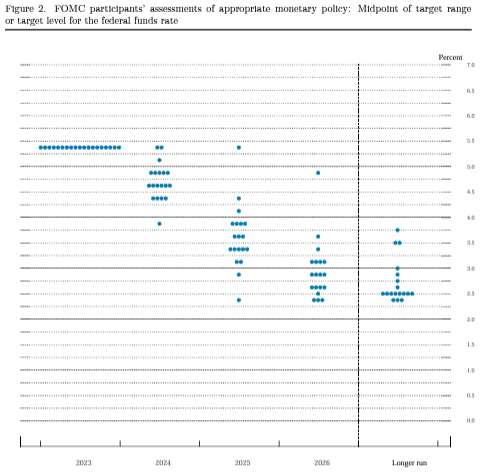
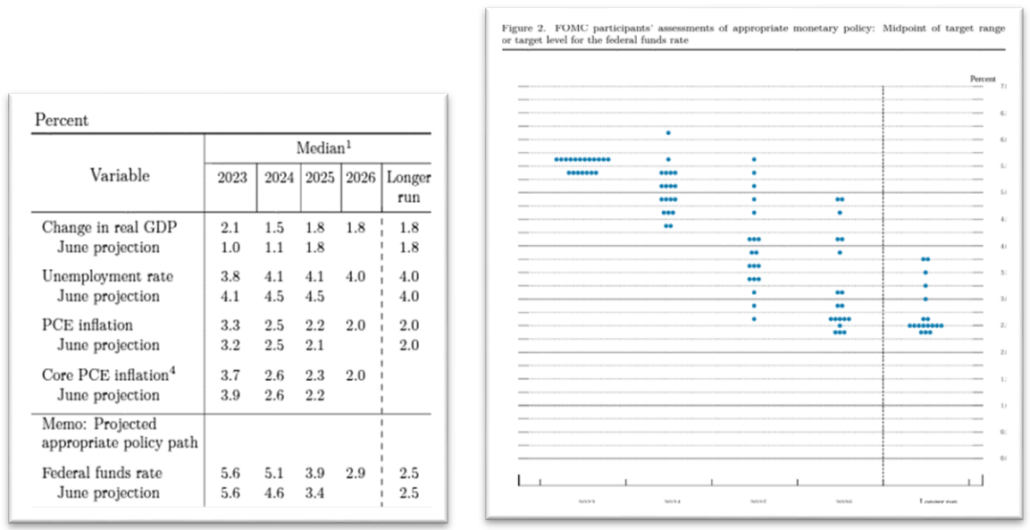
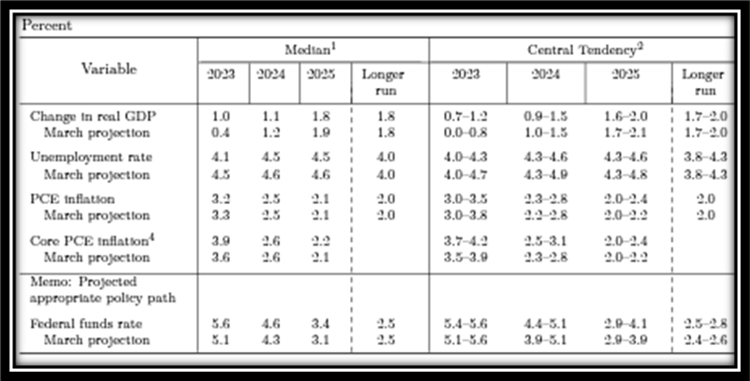
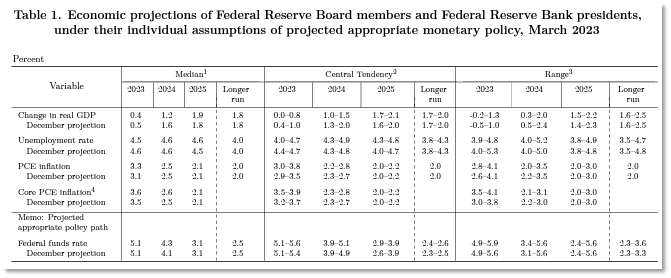
The Federal Open Market Committee (FOMC) elected to keep rates unchanged in March for the fifth consecutive meeting. While the Fed’s decision was largely expected, the big news was the Fed’s changes, or lack thereof, to their Summary of Economic Projections. Of particular interest was their median projection for rate cuts, which policymakers held unchanged at three cuts in 2024. Only two Fed officials projected no cuts in 2024, while two anticipated only two cuts. Only one member voted in favor of more than three rate cuts in 2024, signifying a stark contrast to the Fed’s December 2023 projections where five members anticipated more than three cuts in 2024. We also saw the Fed lift economic projections, like GDP, for 2024, while also increasing their 2024 inflation expectations and revising their 2025 path of rate normalization.
Powell recognized that inflation has been stickier than anticipated the last couple of months, though the latest data “haven’t really changed the overall story, which is that of inflation moving down gradually on a sometimes-bumpy road towards 2%.” He further reiterated “we’re not going to overact…to these two months of data, nor are we going to ignore them.”
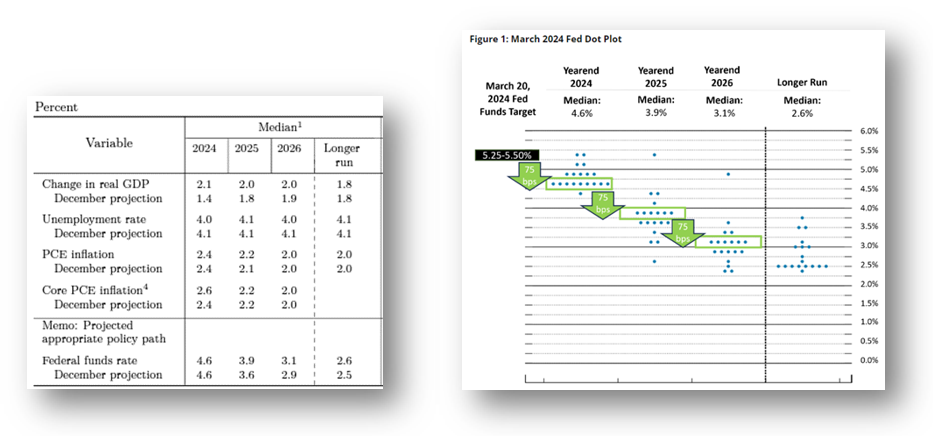
Source: US Federal Reserve Summary of Economic Projections, March 20, 2024
Barring any resurgence of inflation, we believe the Fed has finished its rate-hiking campaign and are nearing their first rate cut. Given the Fed’s steadfast commitment to bringing inflation down, our base case assumptions from the last several quarters have not changed. We continue to believe the earliest the Fed will cut rates is June, which now aligns with current market expectations. However, any prolonged stickiness or resurgence of inflation would likely push our expectations for rate cuts into the third quarter of this year.
Centura’s Outlook
The Fed’s goal to lower inflation back to its 2% mandate and avoid recession is now the base outcome expected by the Fed and most market participants. The successful delivery of lower inflation and Fed policy normalization should bode well for both equities and bonds. However, we continue to believe the market appears priced to perfection, and investors should proceed with caution as any resurgence or sustained stickiness of inflation could result in monetary policy uncertainty and lead to bouts of market angst or volatility.
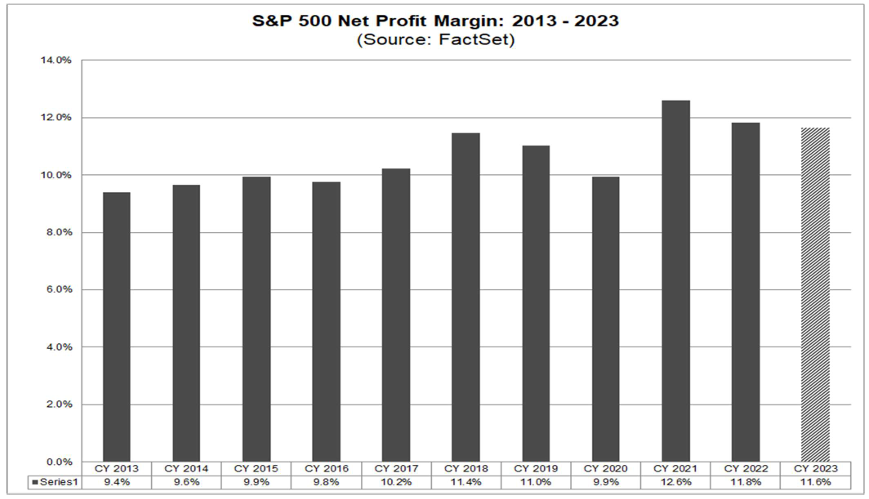
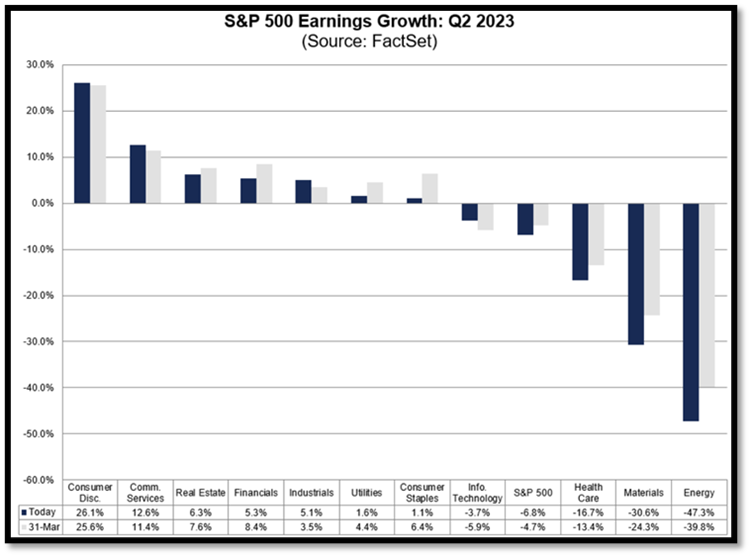
In the face of higher borrowing costs, corporate profits have remained surprisingly resilient as the S&P 500 posted positive earnings growth for the second consecutive quarter in the fourth quarter of 2023, rising 4.2%. Interestingly, those companies with more than 50% of their revenue generated outside of the U.S., generated better profits than companies generating most of their profits domestically. As margins continue to face pressure, FactSet has witnessed revisions for first quarter earnings, dropping from 5.8% on December 31 to 3.6% as of March 28.
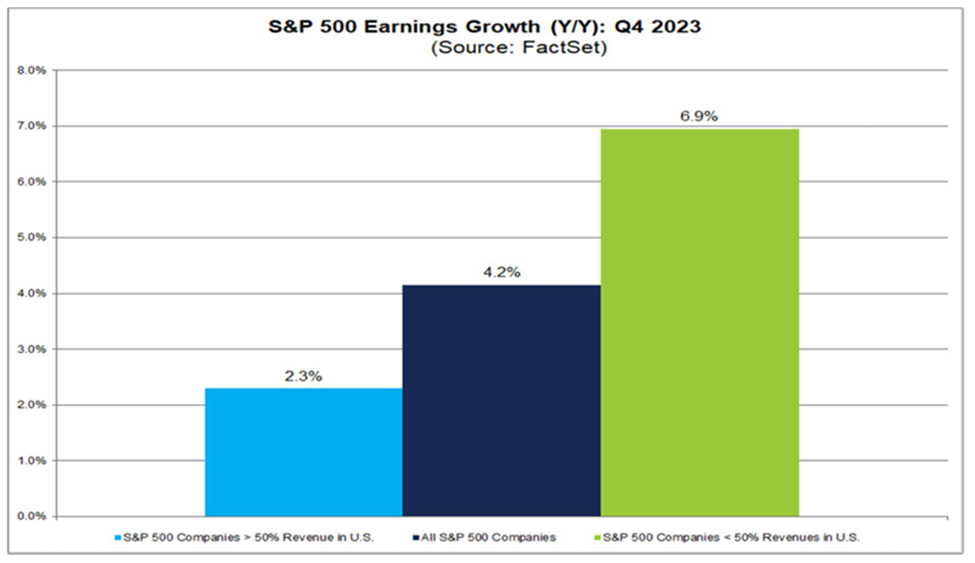
Source: FactSet Earnings Insight
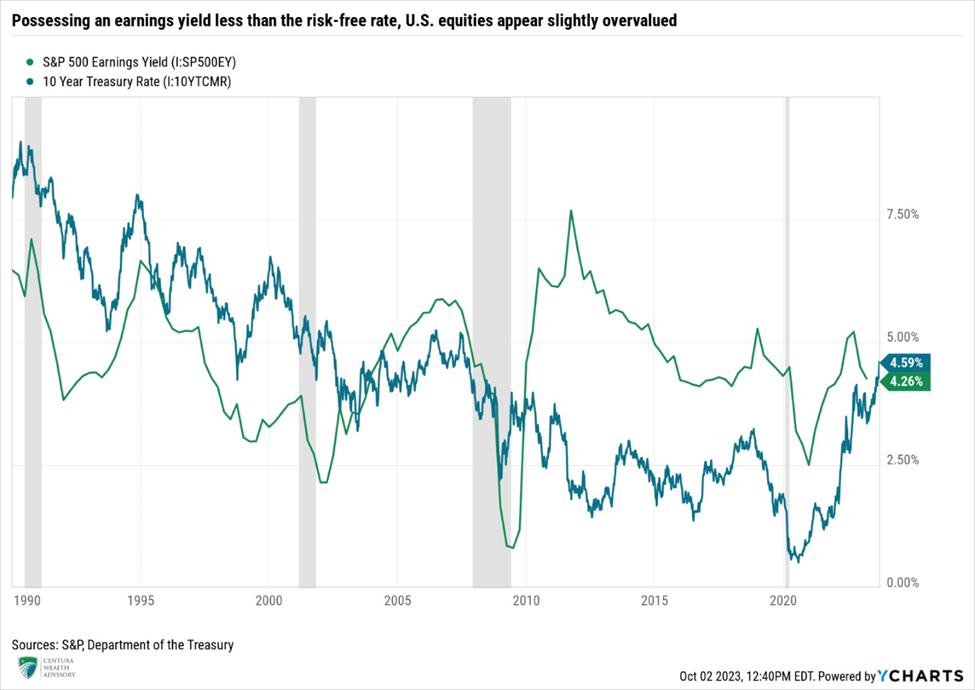
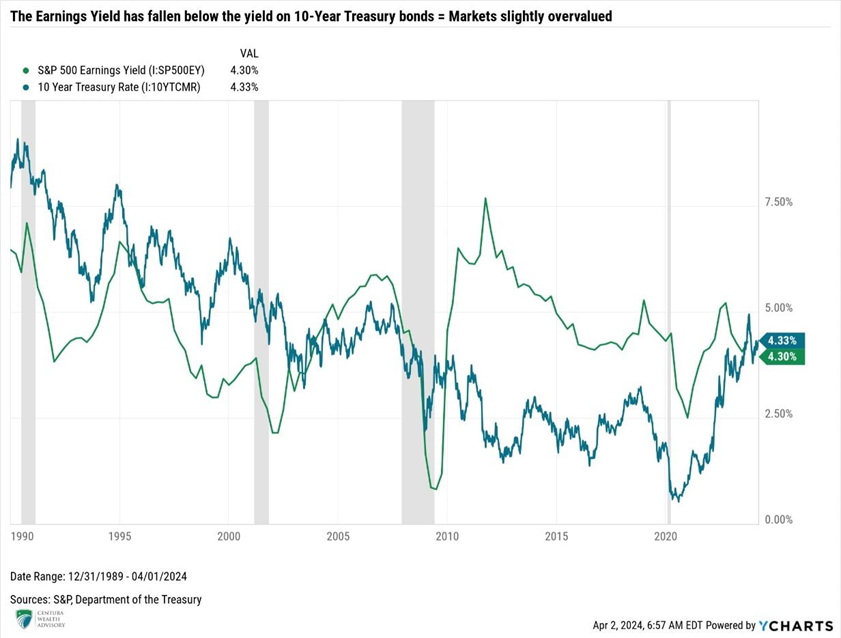
Forward 12-month P/E ratios are approximately 20.9x, above both their five-year and ten-year averages of 19.1x and 17.7x, respectively. This indicates that equities are slightly overvalued and thus priced to perfection. For further confirmation, the earnings yield relative to the yield on the 10-Year U.S. Treasury also indicates that equities are relatively valued today, as the S&P 500 earnings yield (Earnings/Price) is 4.30%, compared to the yield of on the 10-Year U.S. Treasury of 4.33% as of April 1.
The market remains too dependent on the Fed, which has become dependent on poor economic data; with worsening conditions, the more likely the Fed is to pivot and cut rates sooner. However, we believe economic activity will continue to surprise to the upside, realistically extending the timing of the widely anticipated rate cut. Should expectations shift from June to later in the year, we would expect markets to react negatively, and volatility would ensue.
We entered the year with our allocations aligned with our long-term targets. While higher rates will continue to cause issues for some companies, earnings are expected to grow from 2023 levels in 2024. While equities generally produce a positive return during election years, we expect volatility will likely increase as we approach the election in the third and fourth quarters. However, the improving market breadth, as evidenced by the roughly 70% of S&P 500 companies trading above their 200-day moving averages, gives us optimism that markets should continue to grind higher. Outside of Fed policy-related market volatility, we are more fearful of potential exogenous events that are harder to predict.
As expected, yields rose to start the year as the market repriced its expectations surrounding Fed rate cuts. When yields reversed higher, we took the opportunity to further extend the duration of our fixed income allocations. While the path may be bumpy, ultimately, we believe yields should continue to grind lower over the course of the year, presenting attractive opportunities to produce asymmetric returns in bonds. Extending duration should allow investors to clip an attractive yield, while also providing them with the opportunity to experience capital appreciation for a total return exceeding what they will clip sitting in money market funds or short-term Treasury bills.
Elevated interest rates continue to punish private real estate returns, with further slight downward valuation adjustments expected from their previous marks. Real estate is an interest rate-sensitive asset class, meaning as rates move lower, we anticipate a pick-up in activity, and a subsequent reversal of valuations over the next several years. While we believe we are nearing the light at the end of the tunnel for several real estate sectors like multifamily and industrial, unfortunately, we believe more pain will be experienced, particularly with the underlying debt that real estate operators hold. There is a reason S&P Global just downgraded five regional banks based on their commercial real estate loan exposure. Like S&P Global, we anticipate a pickup in defaults across several real estate sectors, which will likely result in further pain across both public and private markets.
Private credit presents an opportunity to earn attractive returns, given private credit is predominantly floating and tied to a base rate such as the Secured Overnight Financing Rate (SOFR), closely linked to the Fed Funds overnight rate. Yields on private credit should remain at their current levels until the Fed begins to cut rates. Even as the Fed cuts rates, the floating rate on private loans does not adjust immediately. Rather, there is a delay before the loan terms reset lower, typically every three months. Barring a catastrophic event, the Fed is likely to lower rates more methodically than they hiked them, supporting higher yields in private credit. Fortunately, private companies have weathered the elevated rate storm better than anticipated. As Cliffwater recently shared with us, borrowers demonstrated strong performance, as evidenced by the 15% year-over-year revenue growth and 13% EBITDA growth. Lower rates should support improved health of borrowers and support attractive returns, relative to traditional fixed income going forward. Combining traditional bonds with private credit should produce a balanced and diversified approach toward income production and total return in 2024.
Thank you for your continued confidence and support. If you have questions or concerns, please contact your Centura Wealth advisor.