Market Month in Review – April 2026

At a Glance
Macro Indicators: Inflation remains a key macroeconomic risk, with March headline CPI and PCE showing prices rising 3.3% and 3.5% on a YoY basis, respectively, due to increased energy prices related to the Iran conflict. The advance estimate for 1Q 2026 GDP printed at 2.0%, driven by AI investment spending, after 4Q 2025’s near-flat growth. The labor market continues to plod along, with unemployment claims continuing to tick down and the unemployment rate at 4.3% as of March.
Trump 2.0: Tariffs remain on the docket, contingent on Congressional approval in mid-July. Geopolitical tensions remain heightened in the Middle East despite the April 8 ceasefire. The fiscal year 2027 federal budget was released in April, proposing a 42% increase in defense and a subsequent 10% decrease in non-defense spending.
Fed & Monetary Policy: At the April FOMC meeting, the Fed held interest rates steady with notable dissents, signaling an uncertain path forward for monetary policy. During his last FOMC press conference as Chair, Jerome Powell broke from tradition to announce he will stay on the Board after his Chair term ends, citing concerns over Fed independence. Kevin Warsh is expected to replace Powell in mid-May, barring confirmation from the Senate.
Capital Markets: Risk assets came back into favor over the month, with U.S. equities rallying to all-time highs, fueled by the tech sector and a strong 1Q earnings season. The dollar reverted to its pre-Iran conflict trend of weakening, helping push international equity markets higher. Credit spreads remain tight and U.S. Treasury yields drifted toward 4.4% on oil-driven inflation concerns. Brent crude oil prices ended the month around $114/bbl.
Asset Class Performance
Markets turned positive in April as geopolitical concerns abated. After underperforming in prior months, U.S. equity markets ran at pace with international equity markets in April but continue to underperform on a YTD basis. High yield fixed income markets showed positive performance as spreads tightened over the month.
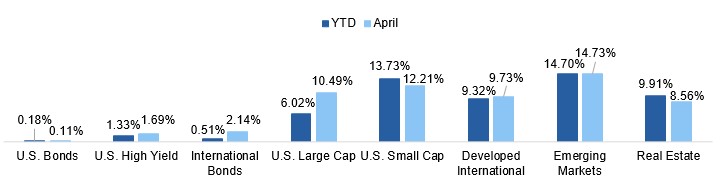
Source: Source: YCharts. Asset class performance is presented using total returns for an index proxy that best represents the respective broad asset class. U.S. Bonds (Bloomberg U.S. Aggregate Bond TR), U.S. High Yield (Bloomberg U.S. Corporate High Yield TR), International Bonds (Bloomberg Global Aggregate ex-USD TR), U.S. Large Cap (S&P 500 TR), U.S. Small Cap (Russell 2000 TR), Developed International (MSCI ACWI ex US TR), Emerging Markets (MSCI EM TR), and Real Estate (Dow Jones U.S. Real Estate TR).
Markets & Macroeconomics
New Highs in Stocks and at the Pump
In April, global energy markets confronted one of the worst supply shocks on record. The conflict in the Middle East, which is now entering its third month, kept the Strait of Hormuz almost entirely closed, with the U.S. now blocking traffic in an effort to starve off Iran from continued toll-taking and further exports. The chokepoint handles roughly 20% of the world’s oil and LNG trades where approximately 20 million barrels typically transit the waterway daily. The issue is not isolated to Iran, as the conflict with Iran as well as spillover into neighboring countries forced Gulf producers to reduce total output by more than 14 millions barrels per day – totaling an approximately 440 million barrel expected supply loss thus far.
Exhibit 1: Brent Spot Premium over Futures
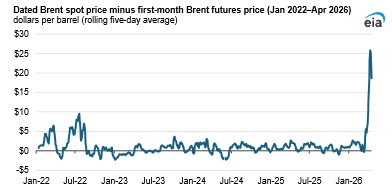
Sources: Source: EIA, Intercontinental Exchange, Thomson Reuters
While Brent crude futures peaked at around $120 near the end of April, those derivative contracts did not tell the whole story of the supply squeeze taking place. In the spot market (for those taking physical delivery of oil), actual transaction prices came in around $25 per barrel higher, illustrated in Exhibit 1. The market is pointing to genuine stress in the physical oil market – for context, during the Russian invasion of Ukraine in February 2022, this premium never peaked above $10. And even though the U.S. is now a net energy exporter, they are not fully insulated from the effects of higher energy costs globally.
Gas prices at the pump rose above $4.10 by month-end from $2.80 at the start of the year. The longer oil is not flowing through the Strait, the tighter the pressure on domestic consumption and the greater risk that input costs flow through to corporate margins.
Despite continued conflict and repeated failed attempts at peace talks, markets have looked through the noise and pushed to new highs on the back of a strong start to the 1Q earnings season. While markets are looking through the conflict, one question remains: whether or not the Federal Reserve will as well. The April FOMC meeting saw three governors oppose the inclusion of easing language in the statement. Expectations for PCE inflation have risen; however, importantly, expectations of long-run inflation remain anchored. While the consumer and broader economy have remained resilient, the risk of higher energy costs feeding through to core inflation creates a much more complex task for the expected incoming Fed Chair Kevin Warsh. As of month-end, Warsh has been approved by the Senate Banking Committee and should face a full Senate confirmation vote in May. Markets have historically tested a new Fed Chair, and the current environment appears ripe for history to rhyme once more.
Exhibit 2: 1Q’26 S&P 500 Earnings Growth (YoY)
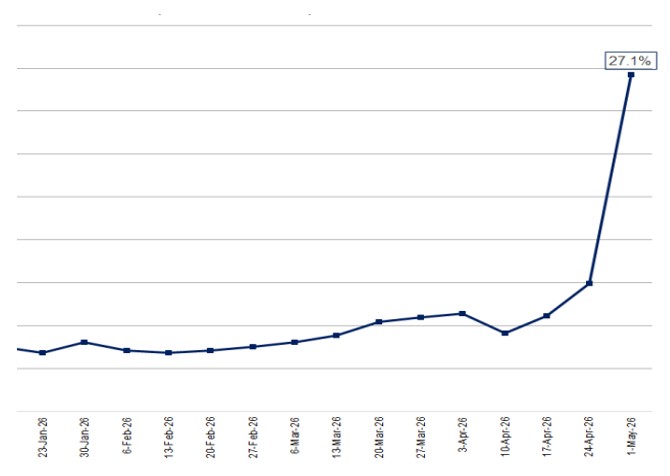
Source: Source: FactSet, Earnings Insights
The Bottom Line: April delivered a study in contradictions: equity markets climbed to new highs on the back of surging earnings growth, even as the worst oil supply shock since the Russian invasion of Ukraine sent gas prices soaring, reigniting inflation fears. The incoming Fed Chair is set to inherit a divided institution, an unresolved energy crisis, and a market with very little room for disappointment.
Looking Ahead
Navigating the Macroeconomic Fog
The two forces dominating the outlook heading into May are the same ones that defined April: an oil-driven inflation shock with no clear end date and a Federal Reserve entering a leadership transition at precisely the wrong moment. Together, these forces are creating a policy environment with fewer positive outcomes than markets may be currently pricing in. The Iran conflict that began February 28 has proven more durable than early consensus expected – going on 60+ days – with the Strait of Hormuz still effectively closed and oil prices around $114 to end the month, despite a ceasefire, illustrated in Exhibit 3. This means that the energy shock is no longer a tail risk, but rather a base case. For the U.S. economy, every $10 rise in Brent adds roughly 0.2 to 0.5 percentage points to inflation and shaves 0.1 points off output growth. This stagflationary math is already showing up in the data: core PCE accelerated to 3.2% in March, headline PCE touched 3.5%, and 1Q GDP growth came in at a modest 2.0%, below the 2.2% consensus. Beneath the headline data, the labor market continues to show sluggish growth and the IMF revised 2026 global inflation up to 4.4%. The Fed now faces a classic (and dreaded) dual mandate dilemma: fighting inflation could tip a slowing economy into contraction, but staying on hold could cause inflation expectations to become unanchored from the 2% target.
Exhibit 3: Brent Crude Oil YTD Spot Price ($/bbl)
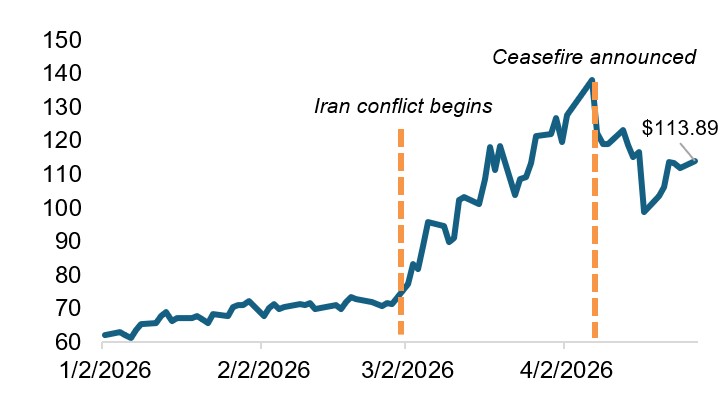
Source: EIA
Adding to the current environment’s complexity is the Fed’s leadership backdrop. Incoming Chair nominee Kevin Warsh cleared the Senate Banking Committee 13-11 on April 29 and now awaits a full Senate vote. The simultaneous April 29 FOMC decision to hold rates at 3.50-3.75% drew four dissents, the most divided vote since October 1992. As of month-end, markets are pricing a roughly 25% probability of one 25-bps hike over the next 12 months. Investors should expect elevated uncertainty around the Fed’s reaction function and a wider rate-path distribution in the forward-looking environment, particularly as concerns related to Fed independence remain heightened.
From a positioning standpoint, staying anchored to fundamentals remains crucial rather than trying to call the market top or dramatically reposition portfolios. Equities have recovered impressively from March lows, with the S&P 500 closing the month of April at a fresh all-time high of 7,193. However, this trend reversal means that valuations are once again stretched to historic levels. Historically, higher equity valuations tend to result in lower forward-looking returns, illustrated in Exhibit 4. While earnings growth projections look strong, the full pass-through of higher oil prices to corporate margins has likely not yet occurred. The fixed income market has seen yield curves steepen globally, with better risk-adjusted value in the belly of the U.S. curve and high-quality municipals than long duration sovereigns. Outside of these trends, quality, diversification, and duration discipline continue to be the right tools for the foggy environment ahead.
Exhibit 4: : S&P 500 Forward P/E & 1-Year Returns
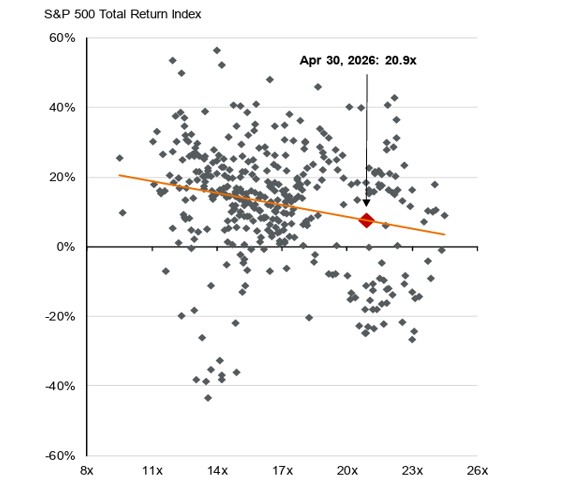
Source: JPM Guide to the Markets
The Bottom Line: The Iran conflict and Fed leadership transition have created a policy environment with few obvious answers for how to allocate portfolios. While a recession or a market breakdown is not largely expected, we are watching the duration of the oil shock and global interest rate divergence closely. The next two to three quarters will require patience and discipline as these forces work through the economy, allowing the macro fog to (hopefully) lift.
Capital Markets Themes
What Worked, What Didn’t
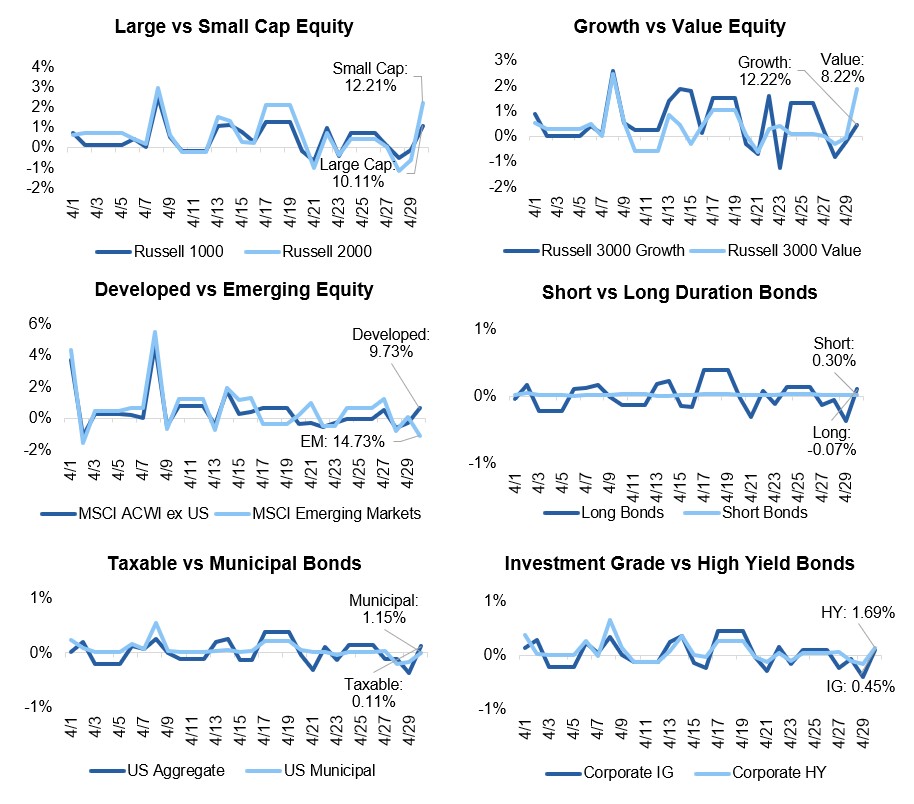
•U.S. Equity Markets Soar Back: U.S. equity markets posted a positive month, with large cap equities soaring to all-time highs and the more attractively valued small cap sector posting over 12% total returns, driven by both sentiment and a strong earnings season.
•Spreads Tighten: Credit spreads tightened over the month, prompting close to 2% returns in high yield bonds, another illustration of the return of the “risk on” attitude across markets.
•International Outperformance Continues: International equities returned to their pre-conflict trend of outperformance, strengthened by a weakening dollar and a ceasefire in the Middle East that helped partially reopen the Strait of Hormuz, easing oil prices.
Source: YCharts. Data call-out figures represent total monthly returns.
On Alternatives
Following the Capital, Missing the Returns
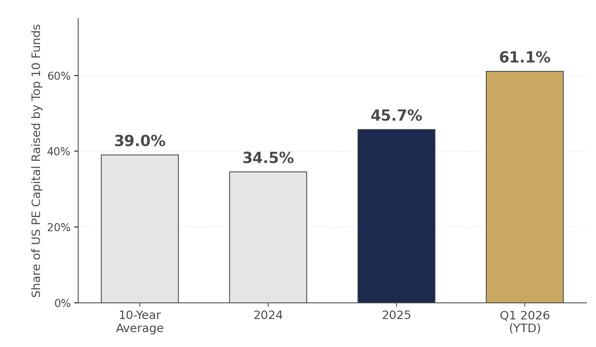
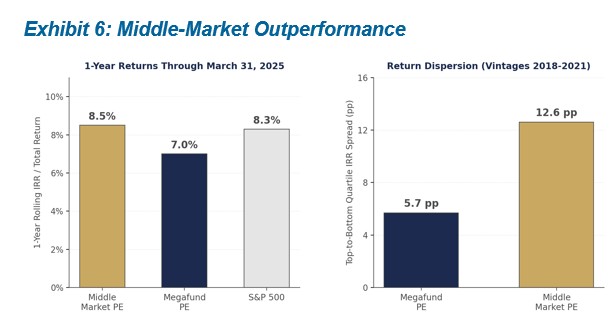
The 10 largest U.S. Private Equity (PE) funds raised in 2025 captured almost half (45.7%) of all PE capital, well above the 10-year average of 39%. Through mid-April 2026, the top 10 funds have captured 61.1% of capital ($60.2B of $98.5B), illustrated in Exhibit 5, though that share will likely moderate as more funds close throughout the year. With this much capital flowing into so-called megafunds, one would assume they would outperform the rest of the PE market, but the data tells a different story. One-year rolling IRR through March 31, 2025 was 8.5% for middle-market managers, narrowly outpacing the S&P 500 at 8.3%, while megafund managers came in at just 7.0%. PitchBook’s research shows the same at the manager level: emerging managers have outperformed established managers across the most recent vintages. Middle-market funds have demonstrated a consistent ability to outperform their larger counterparts over time, yet LP inflows continue to favor scale over performance.
Exhibit 5: Megafund Concentration Surge
Source: PitchBook
Exhibit 6: Middle-Market Outperformance
Source: PitchBook
Why have LP inflows favored megafunds? The answer lies in dispersion of returns. The performance gap between top- and bottom-quartile middle-market managers has run about 12.6% in recent vintages, more than double the 5.7-point spread seen among megafunds, illustrated in Exhibit 6. Middle-market managers offer more upside but realizing that upside requires better manager selection. For most LPs, consolidating with larger, established managers is the more practical path, even if it means giving up some of that upside.
Why are middle-market managers outperforming the megafunds and their nearly unlimited resources? The large-cap space is simply more efficient, leaving less room to drive alpha. In the lower- and middle-market, managers can access niches and deals that megafunds cannot reach due to their size, and their specialized teams can exploit those inefficient pockets. The large buyout space, by contrast, has come to resemble public equity exposure, just with added fees and illiquidity. With so much capital chasing a limited set of large deals, megafunds end up bidding against each other for the same assets, ultimately compressing investor returns.
The Bottom Line: The data shows that the more inefficient corners of the PE market add more value to investor portfolios, but this warrants an emphasis on rigorous manager selection on GPs with a proven ability to drive alpha. While mega PE funds have attracted more capital recently, we prefer to reserve our large-cap equity exposure for the public market, where we receive daily liquidity for a similar return profile.
Asset Class Performance Quilt
Markets are ever-changing, making diversification across asset classes and sectors a critical component to portfolio construction. As illustrated below, a Balanced 60/40 portfolio provides greater consistency of returns and less volatility over time.
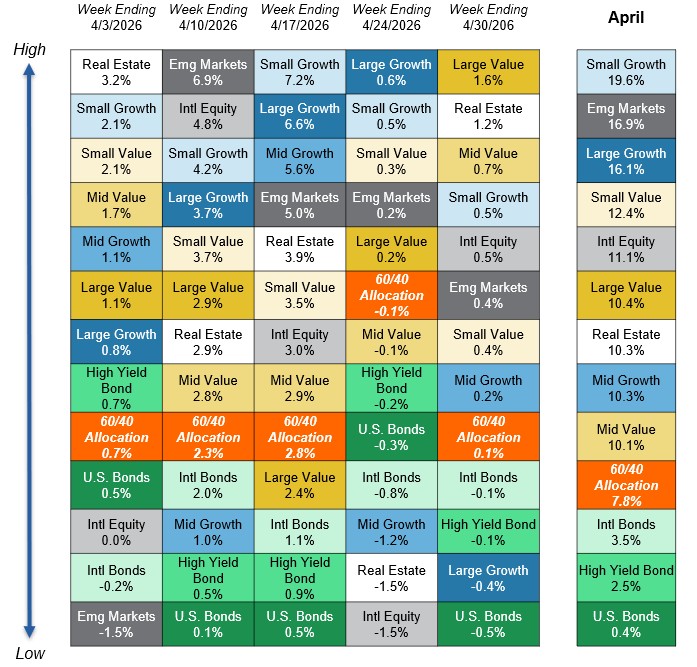
Source: YCharts. Asset class performance is presented using market returns from an exchange-traded fund (ETF) proxy that best represents its respective broad asset class. Returns shown are net of fund fees for and do not necessarily represent performance of specific mutual funds and/or exchange-traded funds recommended by Centura Wealth Advisory. The performance of those funds may be substantially different than the performance of broad asset classes and to proxy ETFs represented here. U.S. Bonds (iShares Core U.S. Aggregate Bond ETF); High Yield Bonds (iShares iBoxx $ High Yield Corp Bond ETF); Intl Bonds (Invesco International Corporate Bond ETF); Large Growth (iShares Russell 1000 Growth ETF); Large Value (iShares Russell 1000 Value ETF); Mid Growth (iShares Russell Mid-Cap Growth ETF); Mid Value (iShares Russell Mid-Cap Value ETF); Small Growth (iShares Russell 2000 Growth ETF); Small Value (iShares Russell 2000 Value ETF); Intl Equity (iShares MSCI ACWI ex US ETF); Emg Markets (iShares MSCI Emerging Markets ETF); and Real Estate (iShares US Real Estate ETF). The return displayed as “60/40 Allocation” is a weighted average of the ETF proxies shown as represented by: 40% U.S. Bonds, 12% International Stock, and 48% Large Blend.
