Market Wrap: Anyone For a Game of Tug-of-War?

For the past several quarters, the market has seemingly ignored communications from the Fed, particularly the point that interest rates will continue to rise and remain elevated for as long as it takes to restore inflation to their 2% target. This trend persisted up until August in the aftermath of Chairman Powell’s Jackson Hole speech and the subsequent September Federal Open Market Committee (FOMC) meeting. After over a year of repetition from Chair Powell, the market finally appears ready to listen to sentiment coming from the Fed.
Successful childhood tug-of-war matches typically rewards the side with the best anchor. In a quest to predict the future, both the economy and the Fed have entered into a game of tug-a-war, with the market as the rope. Good news is no longer good news, rather, good news is bad news, and bad news is good news. The market hates uncertainty and must predict whether the Fed will raise rates again and, perhaps more importantly, when they will begin lowering. Good news signals that the Fed can continue increasing rates and likely prolongs the duration that rates must remain elevated. Conversely, bad news signals conditions are softening, and the Fed is likely done raising rates, with a pivot to rate cuts shortly to follow. The struggle is finding a better anchor than the side wielding the most power – the Fed. Hence why they said, ”Don’t fight the Fed.” With this constant push-and-pull between monetary policy deployed by the Fed and economic reality, it is hard to predict what will happen next.
Market Recap
Equities – The combination of stronger economic data and revised projections from the Fed has finally gotten through to market participants. The Fed does not intend to repeat the mistakes made during the Volcker regime. The Fed will keep rates elevated longer to stifle inflation and ensure prices do not reverse course and reaccelerate. The market acceptance of the Fed’s thesis, coupled with higher Treasury yields, has finally chinked the armor of the interest rate ‘sensitive,’ tech-heavy NASDAQ-100.
While the index was flat for the quarter, the NASDAQ-100 was down 6.61% since the yield on the 10-Year U.S. Treasury first began to surge on July 31st. This effectively erased the gains the index enjoyed during the quarter’s first month, bringing the index’s 2023 return to 34.51%.
On the other hand, recent performance of the S&P 500 has been characterized by the ten largest stocks, which currently comprise more than 30% of the overall index. In fact, 90% of the benchmark’s return has been driven by those large constituents, which are mostly Big Tech. This is the highest level of concentration the index has seen with data going back to 1990.
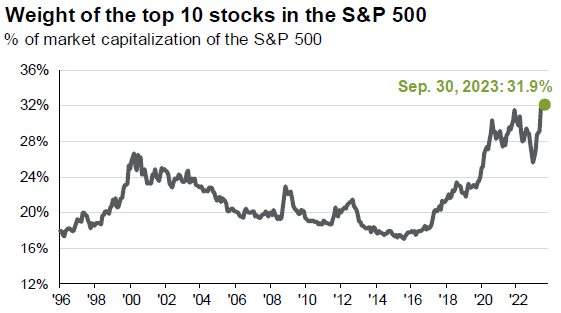
Source: FactSet, Standard & Poor’s, J.P. Morgan Asset Management. The top 10 S&P 500 companies are based on the 10 largest index constituents at the beginning of each month. As of 9/30/2023, the top 10 companies in the index were AAPL (7.0%), MSFT (6.5%), AMZN (3.2%), NVDA (3.0%), GOOGL (2.2%), TSLA (1.9%), META (1.9%), GOOG (1.9%), BRK.B (1.8%), XOM (1.3%), and UNH (1.3%). Guide to the Markets – U.S.
Through three quarters, the S&P 500 is up 11.68%, while the average stock, represented by the S&P 500 Equal Weight ETF (RSP), is up a mere 0.17% through September. Elevated rates, tighter financial conditions, and more stringent lending standards continue to dampen the outlook for smaller companies, as the small-cap Russell 2000 index sold off 10.89% amid the late July 10-Year U.S. Treasury yield surge, bringing the small company gains to 1.35% for the year.
Talk of the most anticipated recession has quickly evaporated, and a ‘soft landing’ is all but expected. The market appears to have accepted the ‘higher for longer’ mantra the Fed has been telegraphing all year. Participants are digesting the data and reacting counterintuitively to the good news is bad news and bad news is good news drum. As we enter what is traditionally a strong quarter for equity markets, investors in the fourth quarter will look for clarity from the Fed as they start to shift focus and position portfolios for 2024.
Bonds – As yields spiked, bonds continued their downward trend, adding to losses accumulated since August 2020. On the heels of a U.S. credit downgrade from Fitch and stronger-than-expected economic data, the demand for U.S. Treasury securities continues to wane, failing to absorb supply and forcing yields much higher. The U.S. Department of Treasury’s spending spree of nearly $1.7 trillion in U.S. debt since early June is also adding to the supply glut and forcing yields higher. The yield on the 10-Year U.S. Treasury surged 0.78% in the third quarter, seeing its highest yield since 2007. Bonds, as measured by the Bloomberg U.S. Aggregate Bond Index, fell 3.23% in the third quarter, dragging the performance for the year to -1.21%.
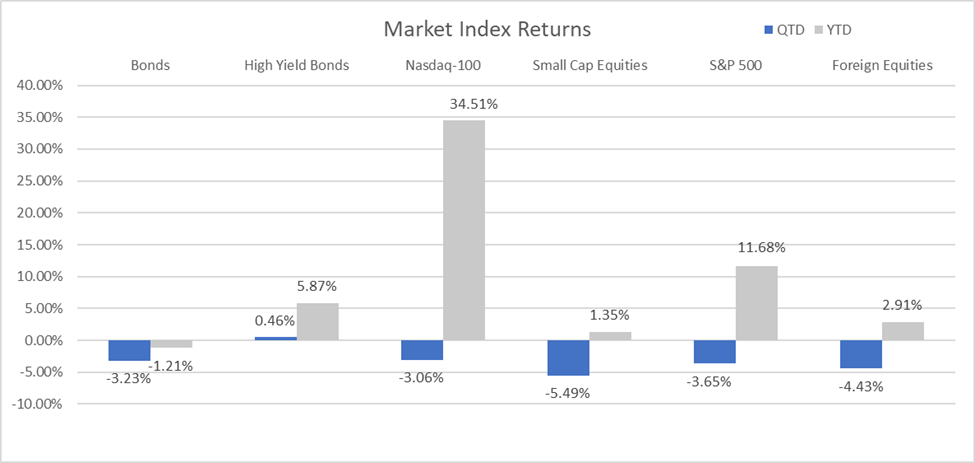
Source: YCharts. The Bloomberg US Aggregate Index was used as a proxy for Bonds; the Bloomberg US High Yield 2% Issuer Capped Index was used as a proxy for High Yield Bonds; the Russell 2000 Index was used as a proxy for Small Cap Equities; and the MSCI ACWI Ex USA Index was used as a proxy for Foreign Equities.
With stronger economic data, expectations have quickly gone from a certain recession to a high expectation that the Fed will successfully pursue a ‘soft landing’, avoiding a recession altogether. While the data has continued to surprise to the upside, many growth metrics continue to moderate.
Economy: Still Waiting on that Recession?
Defying expectations, the last week of September delivered the final, unchanged revision to second-quarter GDP growth of 2.1%. The September GDP reading saw strong fixed business investment of 7.4%, and upward revisions to inventories and net exports to help offset an unexpected slowdown in consumer spending. Early projections for second-quarter growth saw personal consumption cut in half as consumer spending was revised from 1.7% to 0.8% — the weakest advance in our nation’s primary economic driver in over a year. While consumer behavior is important to monitor, the slowdown does not appear troublesome to the Fed. After reaching 5.8% in mid-August, the Atlanta Fed’s GDPNow model for the third quarter was pushed lower to a robust 4.9%, signaling continued economic strength.
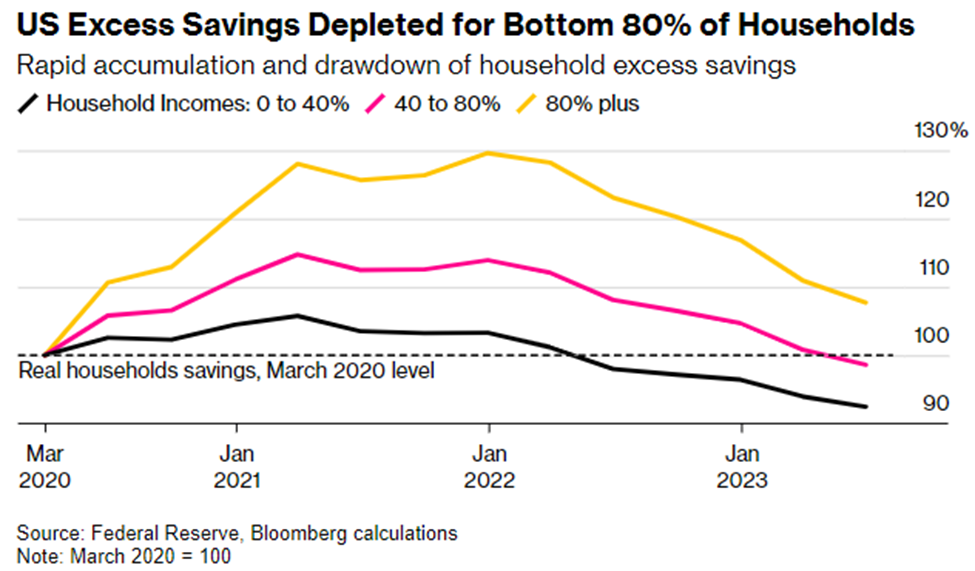
While real GDP may be growing moderately, several factors have the potential to push growth lower. Battling 40-year high inflation has applied pressure to consumers. According to Bloomberg, outside of the wealthiest 20% of Americans, the consumer has run out of extra savings. Consumers have less cash on hand than they did when the pandemic began. Adding to budgetary constraints, 40 million people collectively owe more than $1.6 trillion in student loans, and these individuals are starting to make payments on student debt for the first time since the onset of the pandemic. Given the lack of savings, the payments of $300 on average are causing concerns that discretionary spending will continue to trend lower. Not to mention, credit card debt has risen to record highs, exceeding $1 trillion and underscoring the severity of this consumer strain. With approximately 70% of our growth tied to the consumer, their financial health should be seen as a harbinger of what could unfold.
Inflation & Interest Rates
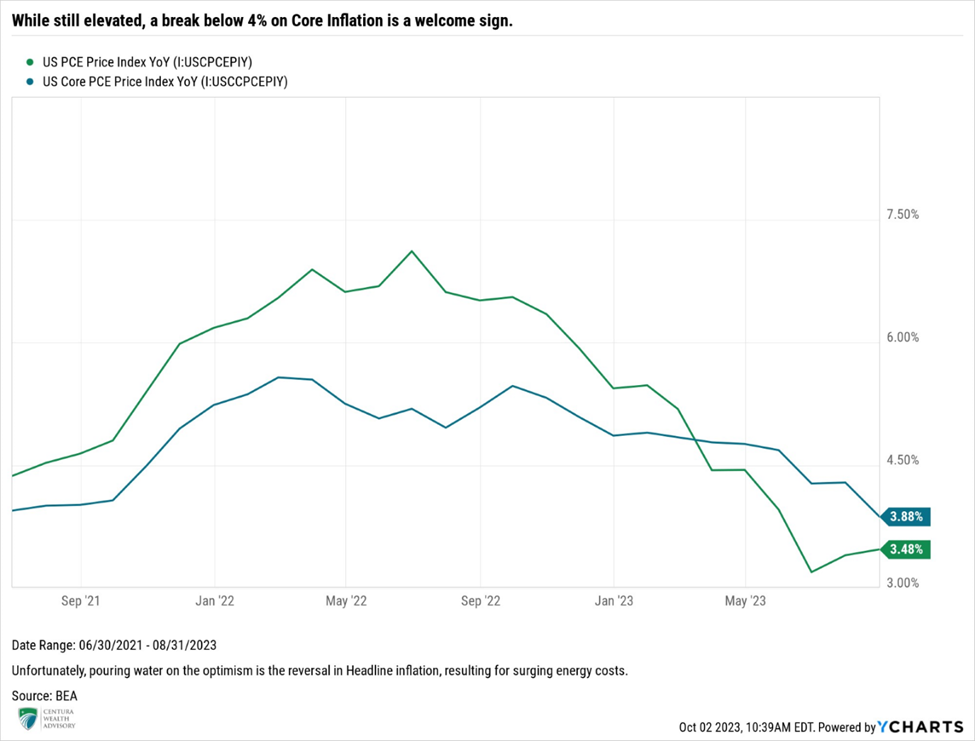
Inflation remains elevated, though the downward trends are welcome. August’s headline Consumer Price Index (CPI) came in at 3.67%, while core CPI (excluding energy and food) remained above the 4% threshold, registering 4.39% year-over-year. The once persistent pricing pressure on core services, particularly, shelter, appears to have finally broken lower. Shelter represents about 1/3 of CPI, making the variable impactful on the overall basket of goods. Given the Fed’s focus on core inflation, the downward trend is seen as positive. However, dampening excitement is the sharp reversal of energy. Gasoline and energy rose 5.6% and 10.6%, respectively, in August, from the prior month, forcing headline inflation to reverse course and go higher.
While the downward trend in CPI is a reason for optimism, we are more concerned with the Fed’s preferred inflation gauge, the Personal Consumption Expenditures (PCE). After remaining mostly flat at 4.62% for the first half of the year, the gauge finally broke below the 4% level, to 3.88%. Breaking through the 4% milestone has many economists and market participants anticipating the possibility that the Fed is done raising rates for the year.
Just like the debt ceiling negotiations consumed headlines through June, the government shutdown dominated chatter leading up to the close of the government’s fiscal year on September 30th. Like the debt ceiling, the proverbial can was kicked down the road, avoiding a shutdown at the eleventh hour. While negotiations were essentially a non-event, one of the most meaningful outcomes has been the U.S. government’s subsequent issuance of new debt, which has been ongoing since June 5th.
Following the debt ceiling extension, markets anticipated the issuance of $1 trillion in new Treasury securities by the end of the third quarter, however, their estimates were off the mark. Surpassing expectations, the U.S. Treasury has issued approximately $1.7 trillion of new debt just since June 5th, pushing the nation’s deficit beyond $33.125 trillion. Issuance of new securities floods the market with new supply and, with few buyers, this massive issuance serves as additional quantitative tightening to support higher yields.
‘Higher for Longer’
The Fed is undoubtedly committed to doing whatever is necessary to bring inflation back to its long-term target of 2%. After embarking on their most aggressive tightening cycle in March 2022, the Fed has raised rates eleven times over eighteen months, bringing the target range for the Fed Funds rate to 5.25% to 5.50%. During this period, Federal Reserve Chairman Jerome Powell additionally led a $95 billion monthly balance sheet reduction. This reduction shed nearly 11%, equivalent to $960 billion, off the federal balance sheet, illustrating that the Fed is willing to deploy any and all tools in their war on inflation.
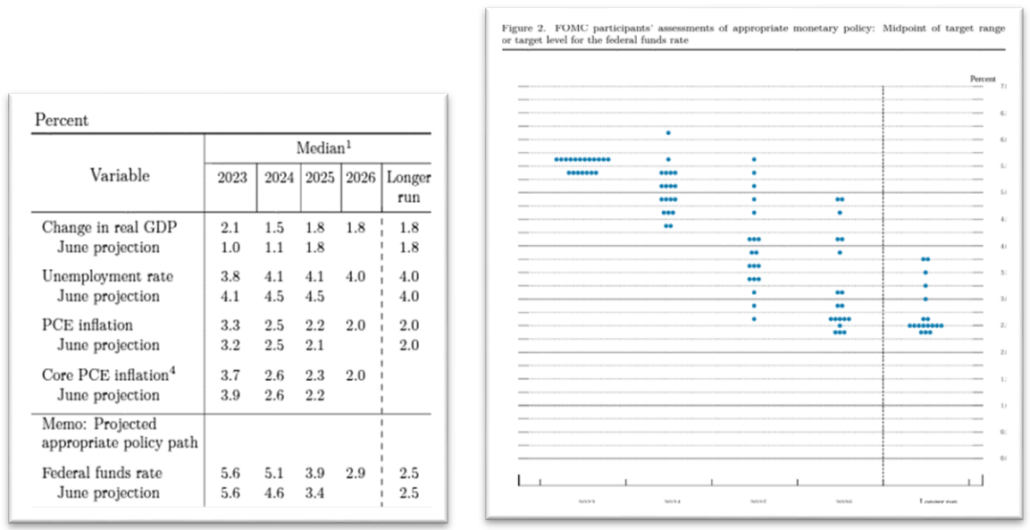
After pausing rate hikes in July, the September Federal Open Market Committee (FOMC) meeting marked the second time since March last year that the FOMC voted not to hike rates further. The decision to pause was all but expected, but revisions to the Fed Dot Plot and forward-looking expectations for the Fed Funds rate sent markets reeling. Their September projections adjusted what was previously 1.0% of rate cuts expected in 2024 to only 0.50% and subsequently raised their projections for rate cuts in 2025 by 0.50%. These upward revisions indicate to the market that the Fed intends to keep rates elevated and will plan to slowly lower them over time to ensure their fight to pull inflation back to their long-term target of 2% is successful.
September’s FOMC release and updated economic projections show a target peak Fed Funds rate unchanged at 5.6%, indicating another 0.25% of increases in 2023, though the market is anticipating the Fed is finished raising rates for now. Following the Fed’s September decision and updated Dot Plot, the market is finally accepting our base case and listening to what the Fed has been saying: rates will remain elevated for the foreseeable future, and barring a catastrophic event, cuts won’t likely come until mid-2024.
Source: Federal Reserve
Unemployment
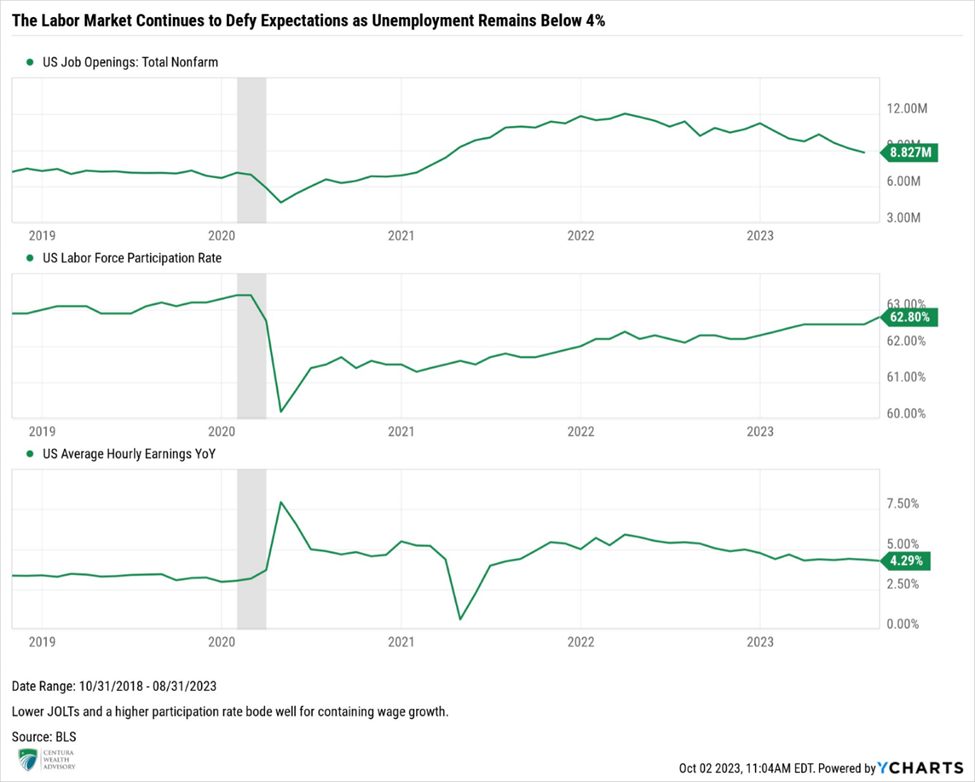
One of the Fed’s primary concerns continues to be wage growth. Although wage inflation has been trending lower, it remains elevated at 4.3%, which at the time of this writing is now higher than both PCE inflation readings, causing some anxiety for the Fed. Strong wage inflation increases the risk of a wage-price spiral, increasing the likelihood of a reacceleration of inflation or at the very least, persistent, elevated inflation.
August’s Labor Market Report registered the 32nd consecutive month of job gains, showing signs of optimism for the Fed. Estimates called for 170,000 jobs added in August. Instead, markets were hit with the addition of 187,000 jobs. Unemployment jumped 0.3% to 3.8%, matching the large monthly bounce in May. Perhaps the most comforting data point in August’s job report was the significant increase in the participation rate, which notched a 62.8% reading. When coupled with job openings (JOLTs) falling sharply below nine million, this data point brought the ratio of job openings to those unemployed to 1.5:1, a welcome reading from previous months. The Labor Force Participation is driven by two primary factors, the labor force, which is defined as those employed or actively seeking employment, and the working age population. More people entering the labor force coupled with fewer job postings means wage growth may not turn out to be a source of inflation. As supply continues to increase and demand for labor wanes, wage growth should start to subside; a welcome development by the Fed.
Centura’s Outlook
As the Fed remains committed to battling elevated inflation, interest rates have spiked to levels not seen since before the Great Financial Crisis and will likely continue to trend higher, or at least stay elevated for the foreseeable future. The Fed’s goal to tighten financial conditions and slow the economy just enough to lower inflation back to their 2% mandate and avoid recession is now the base outcome expected by the Fed and most market participants. However, if rates continue to march higher, we believe it could turn into a matter of not if, but when something in the economy will break.
Earnings for the second quarter were once again stronger than expected, leading many to believe higher rates and inflation aren’t wreaking as much havoc as initially feared. However, with consumer spending trending lower and margins being pressured by both inflation and higher rates, revenues were effectively flat and the -4.6% year-over-year contraction marks the third consecutive quarter of negative year-over-year earnings.
According to FactSet, the estimated earnings growth for the S&P 500 in the third quarter has been revised higher from the expected -0.4% in June to -0.1%. The negative forecast highlights companies’ challenges over the last year to produce profits. Given that higher rates are expected to persist, a company’s ability to service debt will remain negatively impacted, adding sustained pressure over the coming quarters.
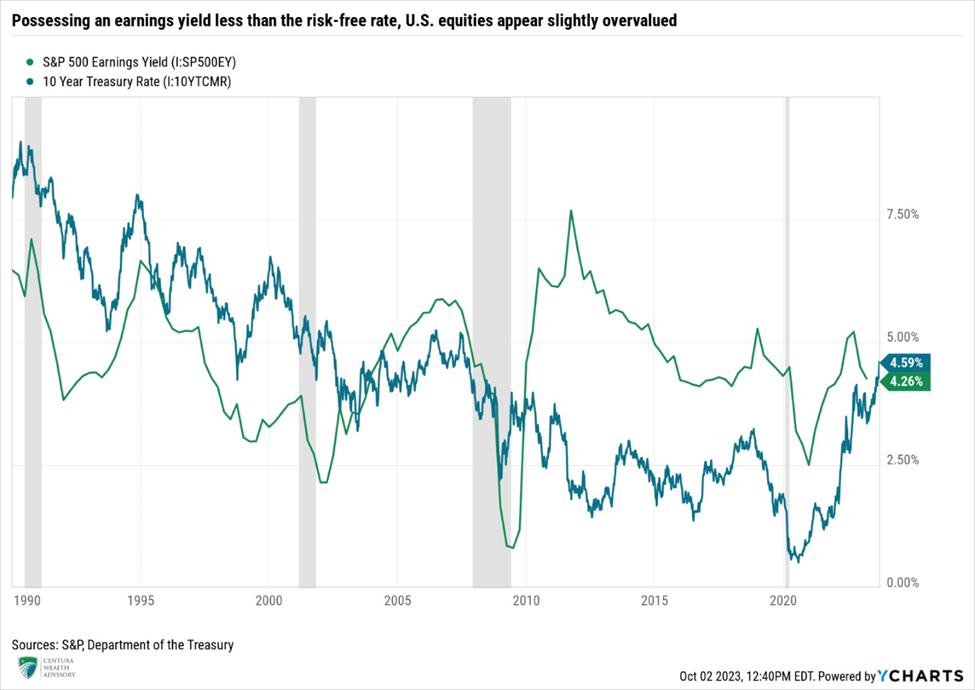
Forward 12-month P/E ratios are approximately 17.9x, slightly above their ten-year average of 17.5x, indicating that equities are slightly overvalued. The inverse of the P/E ratio is known as the earnings yield, which can be compared to the 10-Year U.S. Treasury yield to gauge the relative valuation of equities. A higher earnings yield would indicate equities are undervalued, while a lower earnings ratio indicates that equities may be overvalued, as equities should demand a risk premium above prevailing Treasury rates. With the earnings yield currently at 4.26%, versus the 10-year U.S. Treasury yield of 4.59%, equities appear slightly overvalued at this juncture, and additional drawdowns may be in store before equities become attractive from a valuation standpoint.
With recent Federal Reserve rhetoric and inflation still elevated, we remain cautious. The market is pinned to the Fed’s monetary policy tightening and has become dependent on poor economic data: the worse the economic conditions become, the greater the likelihood the Fed will pivot from their current posturing. Many variables in the third quarter surprised to the upside, and looking backwards, conditions appear somewhat stable. However, as all investors should know, past performance is not an indicator of future returns. As we look forward, the potential deterioration of consumer’s financial health gives us pause, as does the impact of prolonged elevated rates on corporate balance sheets. We believe the two largest risks to 2023’s economic and market rallies are a misstep or abrupt change to the expected Fed outcomes and a potential resurgence of inflation, both of which are closely intertwined. As communicated in , until inflation breaks lower, we remain cautious and anticipate that equities will continue to experience turbulence, particularly if inflation resurges.
We remain steadfast in our belief that markets are discounting the impact of the Fed’s aggressive monetary tightening actions. Defaults and bankruptcies continue to rise, and as rates go higher, we expect further stress on companies and consumers. However, the artificial intelligence craze led to robust gains in technology-based and growth-oriented companies, causing many investors to jump in the market for Fear-of-Missing-Out (FOMO) and creating a large disconnect between economic fundamentals and market technicals. Given these disconnects and overall uncertainty, we returned our portfolio allocations to their long-term neutral targets. In addition to removing our underweight to equities, we have been actively replacing underlying investments to enhance the focus on quality. To navigate the forward-looking environment, we have added actively-managed investments in asset classes where active management has a proven track record of delivering superior risk-adjusted returns relative to respective benchmarks.
Asset classes we believe warrant active management in this phase of the market cycle include international equities, large cap value, and fixed income.
Surging interest rates have hurt private real estate, with further downward valuation adjustments expected. We prefer to focus on real estate industries possessing favorable supply/demand imbalances, like multifamily and various types of industrial real estate. These imbalances should help mitigate losses relative to other real estate sectors not possessing similar disparities, though further paper losses are expected. Ultimately, we believe a focus on quality and conservative underwriting, coupled with diversification across real estate asset types, geography, and sponsors will only benefit client portfolios.
While higher rates negatively impact several financial markets, we continue to find great opportunities in private credit. Given private credit is predominantly floating rate with short durations, and generally lower price sensitivity to spiking interest, private credit should continue to deliver strong returns and high levels of income production over similar public credit instruments. Defaults are climbing but remain below historical averages. Our focus in private credit aligns with our focus across all major asset classes, which is a focus on quality and relative value, anchored in our core investing principles.
We recognize the uncertain backdrop may provide cause for concern. We remain vigilant in our process, with an emphasis on protecting clients’ wealth, while delivering value over multiple market cycles.
Thank you for your continued confidence and support. If you have questions or concerns, please contact your Centura Wealth advisor.

