Market Wrap: The Magnificent Seven Push Markets Higher

Move over, FAANG! The Magnificent Seven have taken over the markets. Representing the seven largest companies in the S&P 500, Alphabet, Apple, Meta, Microsoft, Amazon, Tesla, and Nvidia have been anointed by investors as leading the market and tech rally.
The first half of 2023 was powered by mega-tech stocks, with the rest of the companies in the S&P 500 contributing an incremental amount to the indices’ return. The NASDAQ Composite registered its strongest first-half performance in 40 years, with Apple stock paving the way for an all-time high closing price on June 30, 2023 of $193.97, becoming the world’s first $3 trillion company.
Like the dot-com euphoria, artificial intelligence (AI) has offered tailwinds for the tech industry. AI has sparked big investments by companies and investors wanting to capitalize on the Generative AI race. Meanwhile, the June 1st debt ceiling ‘deadline’ was practically a non-event. The final agreement passed by the House and Senate suspended the debt limit until after the next presidential election and restricted government spending through 2025. However, that hasn’t stopped them from increasing the deficit. As the markets look past signs of economic cooling, indices push higher in the year’s second quarter.
Market Recap
Equities – The Fed has remained steadfast in its fight against inflation, and the prospects of higher interest rates for longer have been unable to derail the tech-heavy NASDAQ 100 momentum, on its way to a second quarter return of 15.16%, bringing the index’s 2023 return to 38.75%.
Driven primarily by the returns of the index’s largest constituents, the S&P 500 has rebounded more than 20% since bottoming in late 2022, joining the bull market rally with the NASDAQ 100. Higher rates coupled with tighter financial conditions and more stringent lending standards have dampened the outlook for smaller companies. The small-cap Russell 2000 index has only gained 7.24% for the year, more than half of that occurring in the last week of the quarter.
While market participants expect the Fed to continue lifting rates and no longer anticipate a pivot this year, recent economic data and stronger earnings have given bulls optimism that a recession might be avoided. For now, with an eye on the future, it appears the market is discounting the lagged impact of monetary policy; gravitating to AI-centric companies; pushing interest-rate-sensitive equities higher; and creating a larger gap between market technicals and economic fundamentals.
Bonds – Bonds, on the other hand, have been sending conflicting signals. Driven by fears of a US government default and potential Fed-induced recession, bond volatility continued in the year’s second quarter, posting a -0.84% return; bringing the overall return on bonds to 2.09% in 2023. The current climate reminds us that while investing in ‘safe-haven’ Treasury securities removes credit risk, investors are still very much exposed to interest rate risk and ensuing volatility from changes in yields. Experiencing swings ranging from as high as 4.10% to as low as 3.37%, the yield on the 10-Year U.S. Treasury Note sits at 3.81%, or a mere 0.07% below where it started the year.
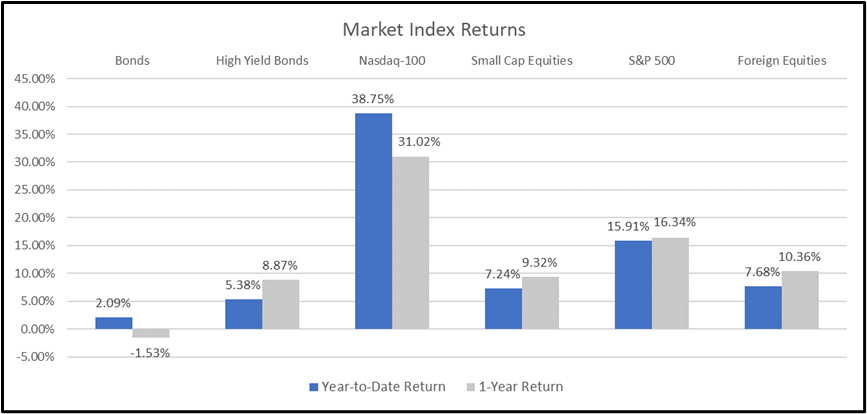
Source: YCharts. The Bloomberg US Aggregate Index was used as a proxy for Bonds; the Bloomberg US High Yield 2% Issuer Capped Index was used as a proxy for High Yield Bonds; the Russell 2000 Index was used as a proxy for Small Cap Equities; and the MSCI ACWI Ex USA Index was used as a proxy for Foreign Equities.
Despite declines in economic growth and activity, the economy has remained resilient as economists contend whether we are currently in or headed towards a recession.
Economy: What recession?
The economy continues to defy expectations and march higher in an environment with one of the most anticipated recessions in history. The last week of June delivered the final revisions to first-quarter GDP growth from 1.3% to 2%. Major gains came from robust consumer spending and surging exports, likely supported by the nearly 9% cost-of-living adjustment for Social Security participants. The 4.2% rise in consumer spending, as measured by personal consumption expenditures, was the fastest pace since the second quarter of 2021, and exports rebounded sharply, up 7.8%.
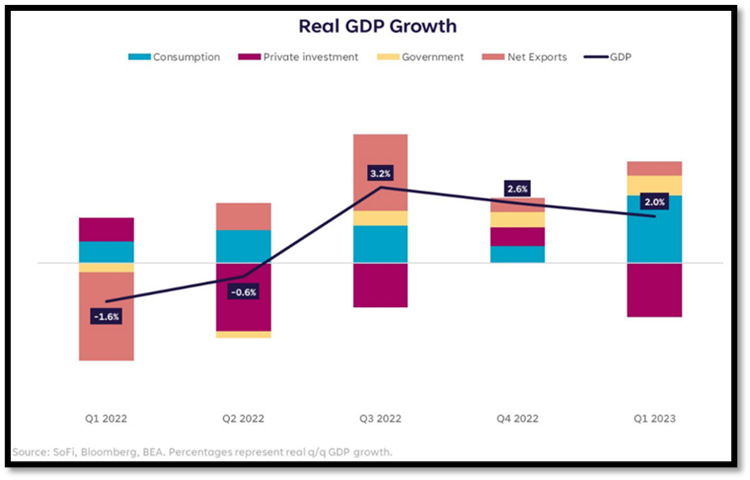
While Real GDP may be growing at a decent pace, several indicators point towards further contraction or possible recession.
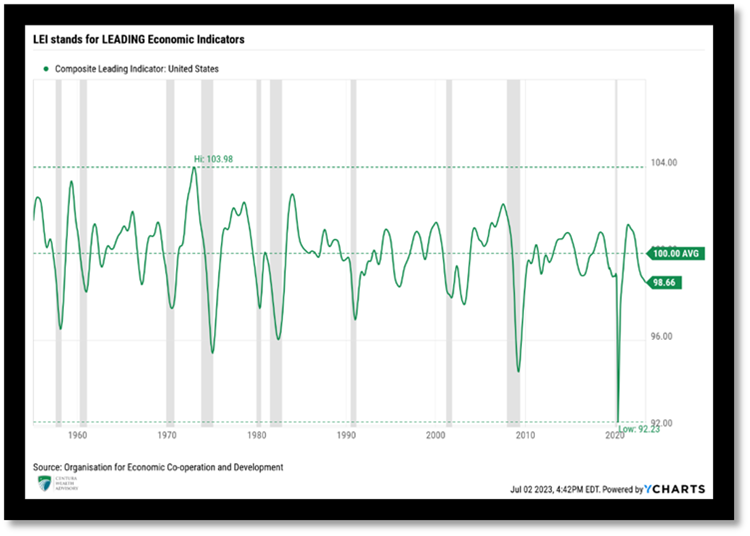
May marks the 14th consecutive month that the Conference Board’s Leading Economic Index (LEI) contracted, an early indication that a recession is all but certain. Senior Manager of Business Cycle Indicators at The Conference Board Justyna Zabinska-La Monica said:
“The US Leading Index has declined in each of the last fourteen months and continues to point to weaker economic activity ahead. Rising interest rates paired with persistent inflation will continue to further dampen economic activity. While we revised our Q2 GDP forecast from negative to slight growth, we project that the US economy will contract over the Q3 2023 to Q1 2024 period. The recession likely will be due to continued tightness in monetary policy and lower government spending.”
While Treasury Secretary Janet Yellen, President Joe Biden, and the Fed all believe a recession will be avoided, the question is not whether we will enter a recession but, rather, when and how deep the recession will be.
Inflation & Interest Rates
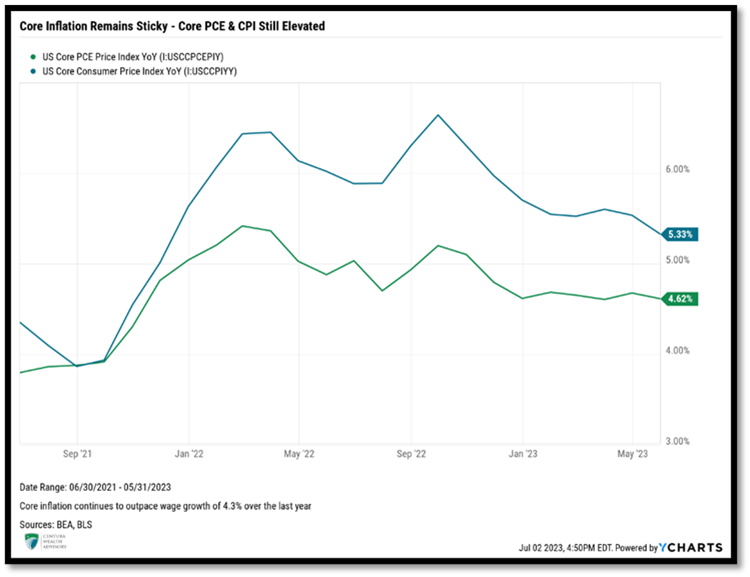
April and May’s headline Consumer Price Index (CPI) came in at 4.93% and 4.05%, respectively, while core CPI (excluding energy and food) registered 5.54% and 5.33% year-over-year readings over those same periods. The persistence of pricing pressure on core services, particularly shelter, has proven problematic. Shelter represents about 1/3 of CPI and has remained elevated, increasing 8% over the last year. Although the Fed’s restrictive monetary policy appears effective in bringing year-over-year inflation off its June 2022 peak of 9.06%, price pressures have proven painstakingly resilient and remain elevated more than the Fed prefers.
On a positive note, rents are coming down and home prices are off their June 2022 peak, indicating lower inflation readings ahead. While the downward trend in CPI is reason for optimism, we are more concerned with the Fed’s preferred inflation gauge, the Personal Consumption Expenditures (PCE), which has remained relatively flat at 4.62%, the same level reported in December 2022.
As highlighted in the previous quarterly market overview, uncertainty regarding the Fed’s inability to dampen inflation while avoiding an economic contraction has led to an almost certain harbinger of a recession: an inverted yield curve. Inverted yield curves occur when yields on longer-dated bonds are lower than yields on short-term notes and have proven to be solid predictors of recessions.
Debt ceiling negotiations, or lack thereof, consumed headlines through June. While the negotiations were essentially a non-event, one of the most meaningful outcomes has been the US government’s subsequent issuance of new debt since June 5th, which received little recognition in the media.
It was anticipated that a whopping $1 trillion of new Treasury securities would be issued by the end of the third quarter. Surprisingly, those estimates were off. The U.S. Treasury has already issued approximately $800 billion of new debt in less than a month, pushing the nation’s deficit beyond $32 trillion. Issuance of new securities serves as additional quantitative tightening to support higher yields and may lead to an equity pullback and widening of credit spreads according to both Citigroup and JPMorgan.
Don’t Expect a Pivot
True to their word, the Fed is committed to doing whatever is necessary to bring inflation back to its long-term target of 2%. In March 2022, the Fed embarked on its current Quantitative Tightening (QT) cycle, resulting in ten consecutive rate hikes over fifteen months and a federal funds rate of effectively 0% to 5%. During this period, Federal Reserve Chairman Jerome Powell additionally led the $95 billion per month balance sheet reduction, shedding approximately $625 billion since assets peaked in April 2022.
June’s Federal Open Market Committee (FOMC) meeting marked the first time since March last year that the FOMC voted not to hike rates further. The decision was telegraphed and highly anticipated. The Fed also conveyed that they are likely not finished raising rates, further tightening is likely required to lower inflation, and their June decision should be considered nothing more than a pause.
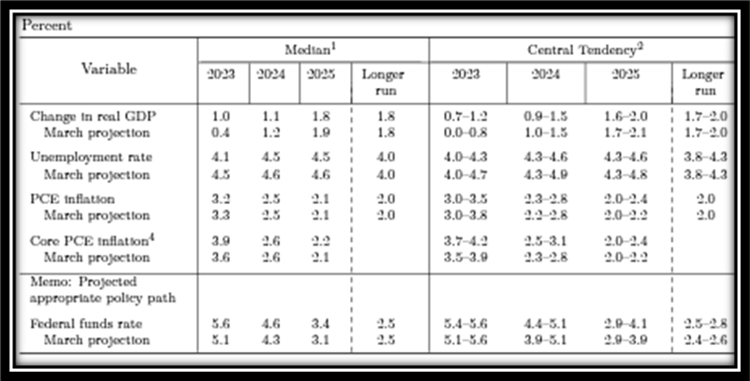
June’s FOMC release and updated economic projections showed a target peak Fed Funds rate of 5.6%, indicating another 0.50% of increases in 2023. Following the Fed’s June decision and updated Dot Plot, the market finally accepted our base case and what the Fed has been saying all along: rates will remain elevated to ensure inflation is under control. Barring a catastrophic event, no Fed pivot is expected in 2023. The first rate cut is now expected in early 2024.
Source: Federal Reserve
Unemployment
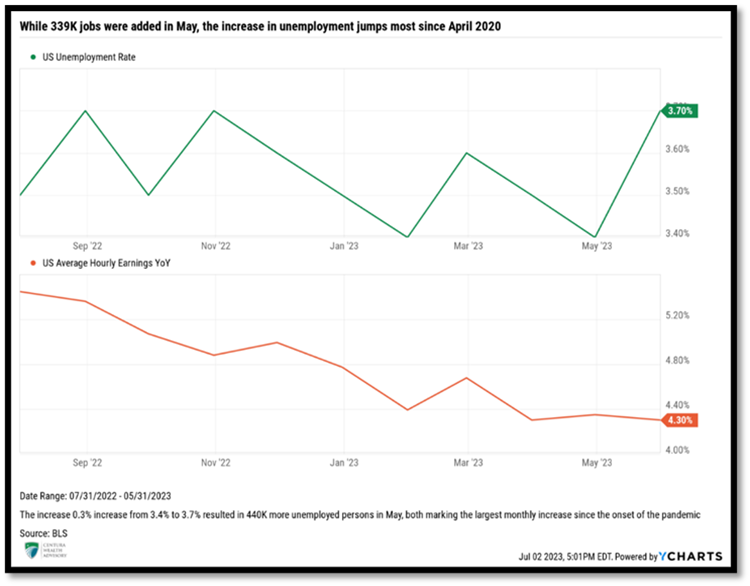
One of the Fed’s primary concerns is wage growth. Although wage inflation has been trending lower, it remains elevated at 4.3%, which worries the Fed. Strong wage inflation increases the risk of a wage-price spiral that could prolong elevated inflation. While May’s CPI print showed headline CPI back below wage growth, core inflation measures remain higher, indicating that earnings are not keeping pace with cost-of-living increases.
The labor market remains robust, despite some conflicting signals. May’s Labor Market Report registered the 29th consecutive month of job gains, though it showed signs of tightening. Estimates called for 195,000 jobs added in May and the market surprised to the upside with 339,000 jobs. Unemployment jumped 0.3% to 3.7%, marking the largest monthly bounce since April 2020. More than 440,000 people entered the unemployment market in May, also matching the largest monthly loss since the onset of the pandemic.
Surprisingly, as measured by the JOLTS, job openings unexpectedly reversed course and surged back over 10 million. Due to the higher number of unemployed, the ratio of job openings to those unemployed remained relatively flat at 1.65:1.
Centura’s Outlook
The Fed remains resolute in combatting 40-year high inflation, despite ‘pausing’ for a break, not letting concerns of a potential recession derail its tightening efforts. Interest rates remain at levels not seen since the Great Financial Crisis and will likely move higher over the next couple of months. The Fed’s goal to tighten financial conditions and slow the economy just enough to lower inflation back to their 2% mandate is a move that will likely force a recession.
Earnings for the first quarter were stronger than expected, leading many to believe higher rates and inflation aren’t wreaking as much havoc as initially feared. However, higher rates for longer periods spells lingering bank liquidity concerns and potential economic recession have prompted analysts to revise earnings forecasts lower.
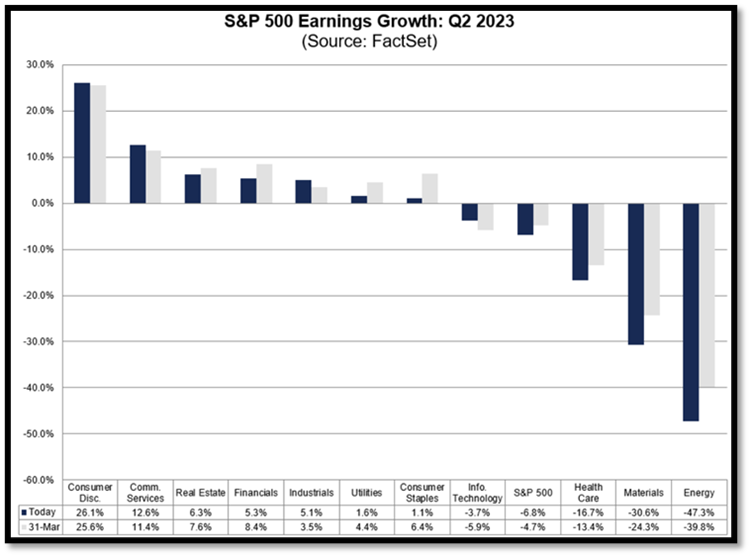
According to FactSet, the estimated earnings growth for the S&P 500 in the second quarter has been revised lower from the expected -4.7% in March to -6.8%. If accurate, this would represent the largest decline the index delivered since the second quarter of 2020 of -31.60%. These negative revisions highlight companies’ challenges in 2023 to produce profits. Given that higher rates are likely to persist, additional pressure may be applied over the coming quarters.
A company’s ability to service debt is negatively impacted by elevated rates. The road ahead will likely remain a challenge given the increased cost of labor and companies’ struggle to pass increased cost of goods onto consumers.
Forward 12-month P/E ratios have risen to approximately 18.9, slightly above their five-year average of 18.5. This indicates that equities are slightly overvalued and additional drawdowns may be in store before equities become attractive from a valuation standpoint. When banks kick off earnings season in mid-July, executive managements’ comments on the health of their companies’ and consumers’ balance sheets should prove insightful, particularly as it pertains to banks’ revisions to loan loss reserves. This should provide an indication of the direction and magnitude of companies’ future expected defaults, which we expect to increase.
Until inflation breaks lower, we remain cautious and anticipate that equities could experience turbulence in the second half of the year, particularly if inflation remains elevated or resurges. We also believe the market is discounting the impact of the Fed’s aggressive monetary tightening actions. Bankruptcies are quietly rising, and defaults are starting to tick up. As rates go higher, we expect further stress on companies and consumers.
Conversely, we also recognize that the market is forward-looking, often pricing in future economic recoveries before they occur and that investors are irrationally exuberant. While we do not subscribe to, or make investment decisions based on FOMO (Fear of Missing Out), it exists and can often be the catalyst a market needs to continue to push higher. Through our experience, we have found when a large disconnect between economic fundamentals and market technicals exists, we should consider shifting allocations towards our neutral strategic allocations.
Like many institutional investors, our cautious outlook has guided our allocations and we remain underweight to respective equity targets in client portfolios. [MT3] [CO4] Our quality bias, which served investors well in the angst of 2022, has served as a headwind in the first half of the year. Given the strength of the equity market recovery since late last year, we began bringing some of our equity positioning back toward our long-term target allocations. We intend to exercise caution while also monitoring opportunities to capitalize on any future market dislocations.
Our fixed-income allocation has seen a reduction in non-traditional fixed-income investments that served portfolios well, as interest rates rose sharply. With end-of-rate increases in sight, over the last several months, we have been extending duration and increasing the quality of underlying bonds, emphasizing U.S. Treasury and investment grade fixed income securities. At this stage in the cycle, we believe this positioning should provide long-term benefits to portfolios and be benefactors of a ‘flight to quality’ that may ensue with any equity market volatility.
We continue to succeed in improving returns and reducing risk by incorporating many private and liquid alternative investments into our allocations. Spiking interest rates have impacted private real estate, and we expect additional downward valuation adjustments across many sectors and markets. Our focus on real estate industries possessing a largely favorable supply/demand imbalance, like multifamily real estate, should help mitigate losses relative to other real estate sectors not possessing similar disparities. Despite the expected challenges in the real estate market, we maintain our dedication to exercising patience and selectivity in our decision-making process. For example, we are finding great opportunities in private credit. Most private credit is floating rate, possessing short durations and experiencing lower price sensitivity to spiking interest rates than similar public credit while also delivering a high-level of income production. We are beginning to observe defaults increase in the market, though they remain well below historical averages. With higher rates expected, additional pressure on borrowers’ ability to service debt will be applied. As such, our focus is on partnering with high-quality managers who have a proven track record of reducing loss. While we face significant uncertainties, we remain anchored by our core principles. Thank you for your continued confidence and support. If you have questions or concerns, please contact your Centura Wealth advisor.

