
2026 Mid-Year Market Review

Prepared July 2026
Public Markets | Fixed Income | International Equities | Private Markets
The first half of 2026 was defined by a tension between resilience and risk. The U.S. economy kept expanding, corporate earnings kept climbing, and equity markets kept setting records – yet each of these gains arrived alongside a genuine source of fragility: a Federal Reserve navigating a leadership transition and a re-acceleration of inflation, an equity market whose returns depend on an increasingly narrow set of mega-cap technology names, a Treasury curve steepening for reasons that are not entirely reassuring, and private-market structures – from buyout portfolios to semi-liquid credit funds – straining under the weight of deferred liquidity. The second quarter sharpened each of these threads. An energy-driven inflation shock tied to the Middle East conflict, a more hawkish Fed under new Chair Kevin Warsh, a brief but sharp mega-cap tech drawdown in early June, and continued stress in non-traded private credit vehicles all came into clearer focus over the quarter, even as headline index levels and reported returns remained broadly positive. The eight sections that follow examine U.S. macro conditions, public equity and fixed income markets, international equities, and the three major private-market asset classes in turn, each closing with the key issue investors should carry into the second half of the year.
U.S. Macroeconomic Developments
The U.S. economy expanded at a solid pace through the first half of 2026, with growth supported by resilient consumer spending and an extraordinary wave of AI-related capital investment. That resilience, however, has coincided with a re-acceleration of inflation. The Middle East conflict pushed energy and input costs higher, core PCE inflation drifted up toward the mid-3% range, and a leadership change at the Federal Reserve introduced fresh uncertainty into the policy outlook. Kevin Warsh was confirmed as Fed Chair in May and used his first meetings to shorten the Committee’s public communications and launch reviews of the balance sheet, data infrastructure, and the inflation framework, while keeping the policy rate on hold. Momentum in the second quarter tilted toward stickier inflation and later, a more uncertain easing path than markets expected at the start of the year.
Key Market Drivers
- The Fed’s central dilemma: a new chair, a still-elevated above-target core inflation rate, and a labor market resilient enough (unemployment ~4.3%) that the case for near-term cuts has weakened; futures pricing has shifted from cuts to a real possibility of a 2026 hike.
- An energy-driven supply shock from the Middle East conflict lifted near-term inflation expectations and drove a two-sided repricing of Treasury yields, complicating the Fed’s dual mandate.
- AI-linked capital expenditure remains the single largest swing factor in growth, offsetting softer consumer and housing-sector momentum and keeping GDP growth (~2.2% projected for 2026) ahead of expectations from earlier in the year.
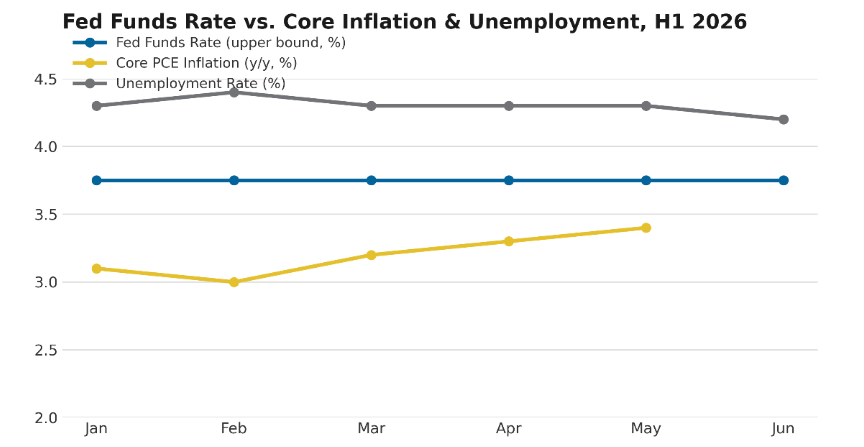
Source: Federal Reserve, FOMC Statement and Summary of Economic Projections (June 17, 2026); Federal Reserve H.15 Selected Interest Rates; Bureau of Economic Analysis, Personal Consumption Expenditures Price Index, data through June 2026.
Issues Facing the Fed
Chair Warsh inherited a committee split between members still focused on taming above-target inflation and others more attentive to labor-market softening, and the June dot plot showed nine participants projecting at least one 2026 hike – a notable hawkish shift from earlier projections of cuts. Warsh has favored shorter, less prescriptive policy statements that preserve optionality, and he has launched task forces on the balance sheet, communications, data reliability, and the inflation framework itself, signaling that the 2% target’s implementation, not just the policy rate, is now in play. The Fed must weigh a supply-driven, energy-linked inflation shock – which classical central bank practice says should not usually trigger a hiking response – against elevated headline pressure and a political environment that has openly debated the appropriate pace of cuts. The net effect has been a Fed that is on hold, more hawkish than consensus expected in the spring, and navigating a credibility test on both its inflation target and its independence.
Bottom Line: A new Fed chair, resilient growth, and an energy-driven inflation shock have pushed the Fed’s easing timeline out and reintroduced two-sided rate risk; a fully data-dependent, higher-for-longer stance is now the working base case.
U.S. Equity Markets
U.S. equities extended their advance through most of the first half, with the S&P 500 setting repeated record highs in April and May before volatility returned in June as AI-infrastructure spending questions and rate uncertainty weighed on sentiment. Leadership remained narrow: Technology and semiconductor names drove the bulk of index gains, while more cyclical and defensive sectors (Energy, Utilities, Consumer Staples) lagged or declined outright. The Magnificent Seven briefly shed roughly $2 trillion in market value in early June before a subsequent recovery, illustrating how concentrated the index’s risk profile has become. For the first half as a whole, the Magnificent Seven cohort modestly underperformed the broader S&P 500 – a reminder that mega-cap dominance is not guaranteed even in a favorable macro environment.
Key Market Drivers
- AI-driven capital spending and earnings strength in mega-cap technology names continued to anchor index returns, even as leadership narrowed further and rotated within the group itself.
- Elevated valuations in the largest names (mega-cap forward P/E near the low-to-mid 30s versus roughly 18-19x for the equal-weighted market) raised the bar for continued outperformance.
- Macro cross-currents – the Middle East conflict, tariff policy, and a more hawkish Fed repricing – drove episodic volatility and a sharp early-June drawdown in the largest tech names.
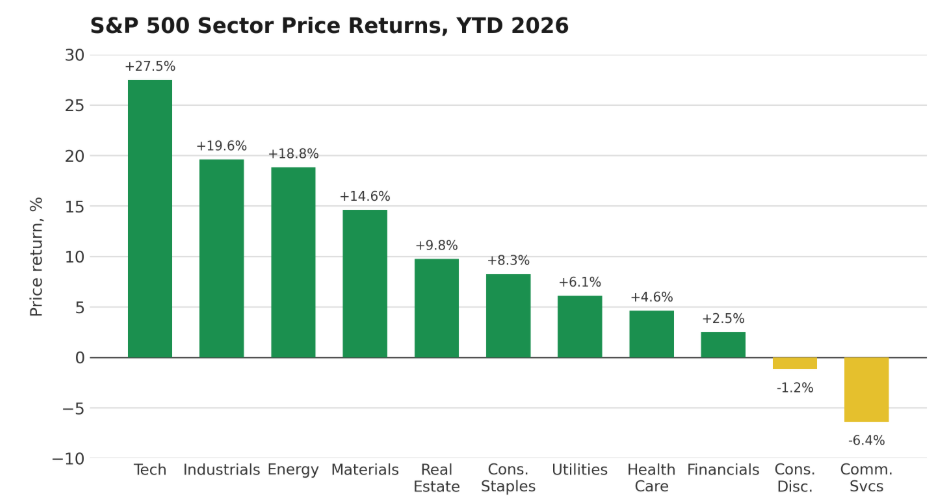
Source: State Street Sector Tracker (ssga.com), Select Sector SPDR ETFs. Price return only (dividends excluded), Dec 31, 2025 close to Jul 6, 2026 close. S&P 500 proxy (SPYM) price return over same period: +10.23%.
Valuations and Concentration Risk
The top ten S&P 500 companies now represent roughly 38-40% of the index’s market value, a level exceeding the peak of the 1999-2000 technology bubble (roughly 27%), though today’s leaders generate a materially larger share of index earnings (about 30-31%) than their bubble-era predecessors did. That earnings support is the central bull argument: unlike 2000, concentration has been driven largely by profit growth rather than pure multiple expansion, and the Magnificent Seven (ex-Tesla) have actually seen modest multiple compression even as prices rose. The bear case is structural and mechanical: a market-cap-weighted index forces passive flows into ever-larger positions in the same handful of names, so a stumble in AI monetization, a slowdown in hyperscaler capex, or renewed doubts about return-on-investment for AI infrastructure would likely disproportionately drag down the entire index, regardless of how the other ~490 names perform. Growing investor interest in equal-weight and value-oriented vehicles reflects this concern.
Bottom Line: U.S. equities remain near record highs, but returns are unusually dependent on a small number of mega-cap technology names; strong earnings support today’s premium multiples, but the market’s concentration leaves it more vulnerable than the headline index suggests to any AI-related disappointment.
U.S. Bond Markets: Treasuries, Credit & High Yield
Fixed income markets absorbed a genuine regime shift in the first half of 2026: the Treasury curve completed its exit from the historic 2022-2024 inversion and pushed further into a positive, if still modest, slope. Corporate credit was the standout performer on a risk-adjusted basis – investment-grade and high-yield spreads ground toward multi-decade tights even as underlying Treasury yields moved higher, reflecting resilient corporate fundamentals, strong technical demand, and confidence that default rates would stay contained. The 30-year Treasury yield briefly touched levels last seen in 2007, underscoring how much of the move has been concentrated at the long end of the curve rather than in short rates, which remain anchored by Fed policy.
Key Market Drivers
- A bear-steepening of the yield curve – long rates rising faster than short rates – driven by fiscal deficit concerns, heavier Treasury issuance, and a rising term premium rather than by improving growth expectations alone.
- Historically tight investment-grade and high-yield spreads, supported by solid corporate fundamentals and strong retail and institutional demand, even as issuance (including AI/data-center-linked supply) is expected to rise sharply.
- A more hawkish Fed reaction function, which has repriced the front end of the curve and pushed expected rate cuts further into 2027, adding to overall yield volatility.
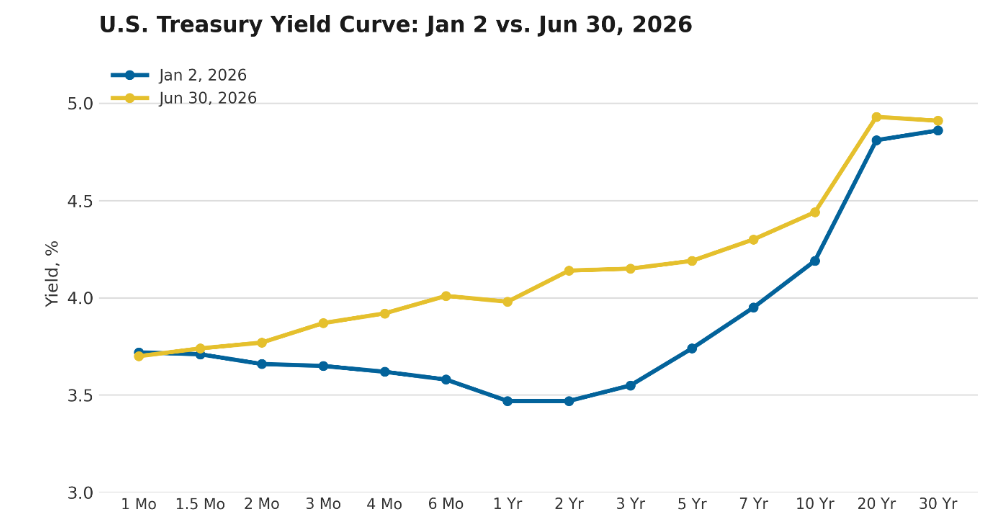
Source: U.S. Department of the Treasury, Daily Treasury Par Yield Curve Rates (home.treasury.gov). Par yields, Jan 2, 2026 and Jun 30, 2026 closes.
Changes in Yield Curve Shape
The 2s10s spread has moved from deep inversion in 2023 (roughly -108 basis points at its trough) to a positive but still historically narrow reading in the 25-55 basis point range through the first half of 2026, after briefly touching the high-50s in March before drifting back down. Unlike a classic post-recession steepening driven by anticipated Fed cuts, this move has been led by the long end: 10- and 30-year yields have risen on deficit and issuance concerns, while short rates stay anchored near the 3.5-3.75% policy range. The 3-month/10-year spread – the New York Fed’s preferred recession indicator – has oscillated around zero, turning briefly positive before slipping negative again, leaving recession-probability models in a genuinely ambiguous, late-cycle reading rather than in the all-clear.
Bottom Line: Credit markets are pricing in a benign default outlook and spreads remain historically tight, but the Treasury curve’s bear-steepening, driven by term premium and fiscal issuance rather than growth optimism, argues for caution on long-duration exposure and continued preference for short-to-intermediate maturities.
Overseas Equity Markets: Developed & Emerging
International equities outperformed the U.S. market for a second consecutive period, extending a trend that began in 2025. Emerging markets were the standout, led by South Korea and Taiwan on AI/semiconductor demand, alongside continued strength in India and pockets of Latin America. Developed international markets posted more modest but still respectable gains, helped by a softer U.S. dollar, Japanese corporate reform and fiscal stimulus, and a rotation among global investors away from concentrated U.S. mega-cap exposure. Investor positioning in EM remains comparatively light relative to the scale of outperformance, suggesting the rotation may have further room to run if global growth stays resilient.
Key Market Drivers
- A weaker U.S. dollar and easier global financial conditions provided a structural tailwind for emerging-market currencies, equities, and central-bank flexibility to cut rates.
- Semiconductor and AI-infrastructure demand disproportionately benefited North Asian markets (South Korea, Taiwan) and select EM technology exporters, driving outsized EPS growth versus developed markets.
- Persistent U.S. equity concentration encouraged global reallocation toward more attractively valued and more diversified international markets, though Europe remains constrained by weaker domestic growth and greater geopolitical exposure to the energy shock.
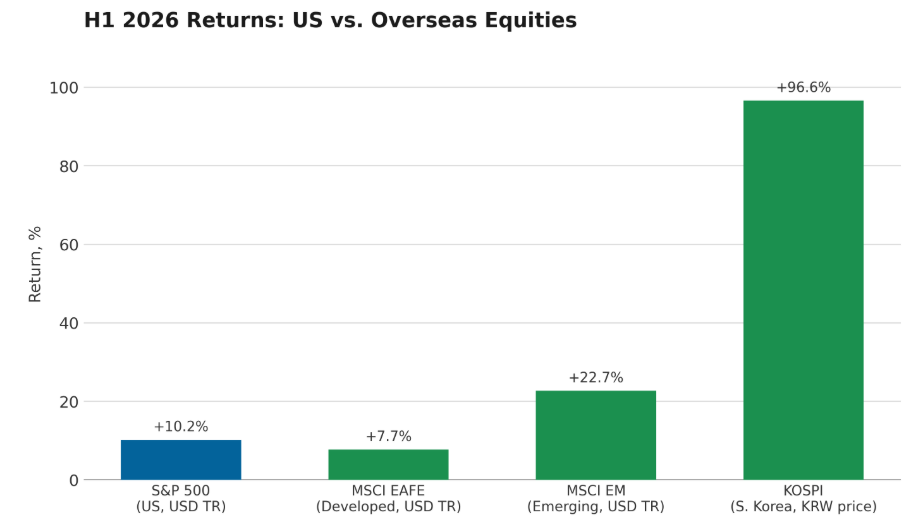
Source: MSCI EAFE and MSCI EM: mid-year 2026 investor outlook commentary citing MSCI USD total-return data, Jan 1-Jun 30, 2026. S&P 500: RBC Wealth Management H1 2026 equity recap, USD total return. KOSPI: Korea Exchange, price index, KRW, Jan 2 close (4,309.63) to Jun 30 close (8,476.48).
Outlook for Overseas Markets
The case for continued international outperformance rests on an earnings growth differential – consensus expects EM EPS growth of roughly 17-21% in 2026 versus the mid-teens for the U.S. and other developed markets – combined with valuation discounts that remain historically wide relative to U.S. mega-caps. Japan should benefit from continued fiscal stimulus and corporate-governance reform, while India is expected to remain the fastest-growing major economy, aided by central-bank easing. The principal risks are a reversal in dollar weakness, a re-escalation of tariff or geopolitical tensions, and China’s ongoing structural headwinds (weak consumer confidence and property-sector drag), which continue to differentiate China from the broader EM-ex-China growth story led by Korea, Taiwan, and India.
Bottom Line: Both developed and emerging international equities enter the second half with a constructive earnings and valuation setup relative to the U.S., but the rotation remains sensitive to dollar direction, geopolitical developments, and continued differentiation between China and the rest of the emerging-market complex.
Private Equity Market Developments
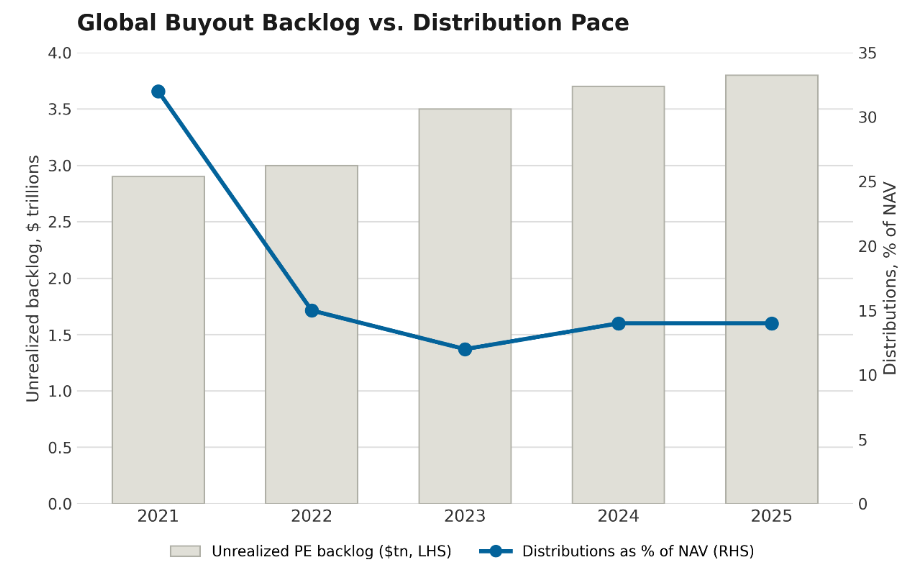
Private equity entered the second half of 2026 showing tentative signs of a durable recovery in dealmaking and exits, but the industry remains burdened by a historic backlog of unsold portfolio companies. Exit activity and distributions improved meaningfully in 2025 and into 2026, led by a reopening IPO market and a handful of large sponsor-led sales, but the improvement has been concentrated in the highest-quality, largest assets, leaving mid-market inventory largely stuck. GPs have leaned further into secondaries, continuation vehicles, and NAV-based financing to deliver liquidity to limited partners in the absence of a fully functioning traditional exit market.
Key Market Drivers
- A reopening, though still selective, IPO and M&A market, aided by lower near-term financing costs and improving sponsor and strategic-buyer confidence, has lifted exit values off their 2022-2023 lows.
- Limited partners have shifted decisively toward distributions-to-paid-in (DPI) as the dominant performance metric, intensifying pressure on GPs to realize cash returns rather than rely on unrealized marks.
- Record secondary-market volumes and GP-led continuation vehicles have become the default liquidity mechanism for aging assets that cannot clear the traditional market at acceptable prices.
Source: Bain & Company, Global Private Equity Report 2026 (and prior annual/midyear editions for historical figures).
Cash Disposals and Realization Events
The scale of the overhang remains extraordinary: an estimated 31,000 sponsor-owned companies valued at roughly $3.7 trillion remain unsold globally, with more than half held for four years or longer and median holding periods stretching past six years, the longest on record. Five-year rolling DPI as a share of total industry assets fell to roughly 10% in mid-2025, its lowest recorded level, even as realized exit value improved. Distributions have been heavily skewed toward mega-deals – roughly three-quarters of 2025’s exit value came from the largest transactions – leaving thousands of mid-market and aging 2020-2022 vintage assets without a clear realization path. Where traditional sales and IPOs remain unavailable, GPs have increasingly turned to continuation funds, NAV lending, and partial/dividend recapitalizations to generate liquidity, though average buyout secondary pricing has slipped to roughly 92% of NAV as more mature, harder-to-sell portfolios come to market – a sign that engineered liquidity is a partial, not full, substitute for genuine price discovery.
Bottom Line: Exit markets are genuinely improving, but the industry’s $3.7 trillion unsold backlog is too large to clear through secondaries and continuation vehicles alone; sustained normalization of cash distributions depends on the traditional M&A and IPO channels broadening well beyond today’s largest, highest-quality deals.
Private Credit Market Developments
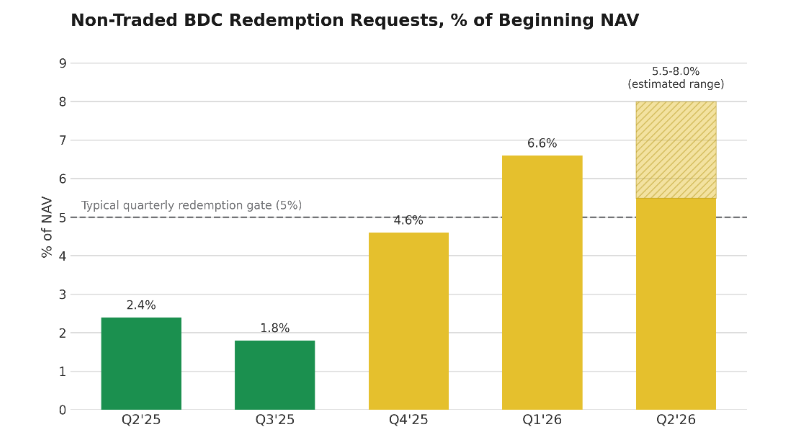
Private credit’s rapid growth over the past several years has been tested by a genuine liquidity event in the semi-liquid, retail-facing corner of the market. Elevated redemption requests at several large non-traded business development companies (BDCs) – driven more by investor sentiment around software-sector AI disruption than by actual credit deterioration – pushed a handful of funds toward their structural redemption gates in late 2025 and early 2026. Underlying credit fundamentals across the broader direct-lending market have remained comparatively resilient, with non-accrual rates still low by historical standards, but the episode has exposed a structural mismatch between the illiquid loans these vehicles hold and the quarterly liquidity they promise investors.
Key Market Drivers
- A maturity and liquidity mismatch inherent to the semi-liquid BDC wrapper – daily or monthly subscriptions into loans with five-to-seven year maturities and no secondary market – became acute once redemption requests exceeded typical 5% quarterly gates.
- Rising NAV-based leverage (“leverage on leverage”) and continued spread compression from intense competition among direct lenders have drawn increased regulatory and rating-agency scrutiny even as headline default rates stay low.
- A large leveraged-loan and private-credit refinancing wall concentrated in 2026-2027 adds a second layer of stress on top of the redemption-driven liquidity questions.
Source: Robert A. Stanger & Co., Stanger Chairman’s Report and Stanger Report (Non-Listed BDC editions), Q2 2025-Q2 2026.
Liquidity Issues in Private Credit
Redemption requests at the largest non-traded, evergreen private credit funds rose from roughly 5% of NAV in late 2025 to nearly triple that level in some vehicles by early 2026, with a few technology-focused funds seeing requests exceeding 20-40% of shares outstanding. Sponsors have responded with a mix of tools – raising redemption caps in some cases (one large direct-lending fund lifted its quarterly limit from 5% to nearly 8%), while others have gated redemptions outright or pursued fund mergers at NAV discounts that have drawn litigation. Rating agencies have generally characterized balance-sheet cushions across the sector as adequate to absorb an elevated, but not indefinitely sustained, wave of redemptions, and public BDC price-to-NAV discounts (around 17%, in line with 2022 lows) suggest the market has already priced in meaningful stress. The open question is second-order: whether a sustained redemption wave forces forced asset sales at depressed prices, and whether bank credit lines that support private-credit vehicles come under pressure if the cycle persists – a risk regulators are actively stress-testing in 2026.
Bottom Line: Private credit’s liquidity stress so far reflects a structural redemption/illiquidity mismatch in semi-liquid retail vehicles more than a fundamental credit event, but sustained elevated redemptions, thin balance-sheet cushions in some funds, and a looming refinancing wall warrant close monitoring through the second half of the year.
Private Real Estate Markets
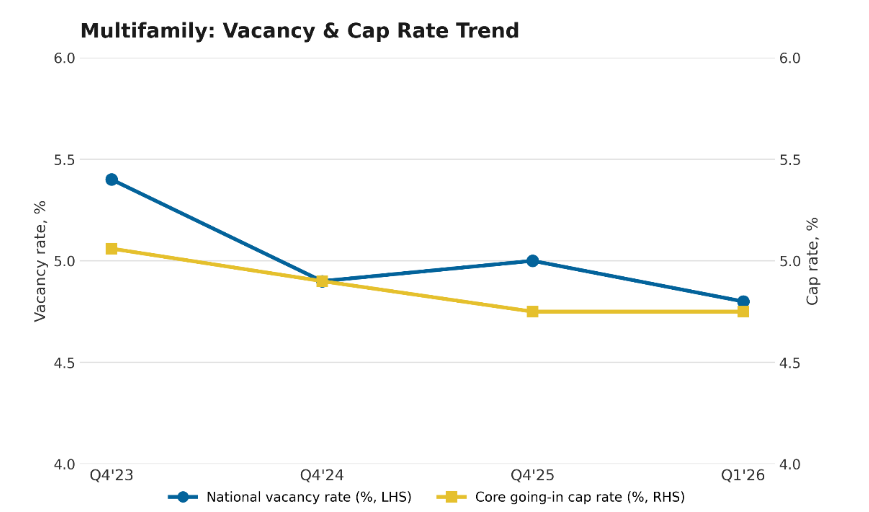
Private real estate broadly stabilized in the first half of 2026 after several difficult years, with the multifamily sector – the largest component of most institutional portfolios – showing the clearest signs of an approaching cyclical inflection. Investment volumes rose to a multi-year high, aided by greater clarity on interest rates and the tightest cap rates of any major property sector, even as the multifamily supply wave that began in 2021 continued to work through the system. Other property types showed more mixed rebounds, with commercial mortgage distress still working through resolution but past its worst point of the cycle.
Key Market Drivers
- A historic multifamily supply wave (the largest since the 1980s) is fading rapidly – construction starts have fallen more than 40% from 2023 levels – setting up a tighter supply/demand balance into 2027.
- Strong renter demand, driven by weak for-sale housing affordability and robust household formation (up roughly 2.7% year-over-year), continues to support occupancy even where rent growth remains muted.
- Elevated commercial real estate mortgage distress, concentrated among 2021-vintage acquisitions, is gradually resolving, freeing lender balance sheets and supporting a recovery in transaction volume and credit availability.
Source: CBRE Research. Vacancy rate from CBRE U.S. Multifamily Figures (quarterly). Cap rate from CBRE Multifamily Underwriting Survey, core/prime going-in cap rate.
Outlook for Multi-Family Real Estate
According to CBRE, national multifamily vacancy appears to have peaked just shy of 5.5% (estimates vary by data provider), with absorption expected to overtake new deliveries on a sustained basis in the second half of 2026 nationally, and as early as late 2027 in the most oversupplied Sun Belt and Mountain markets (Austin, Denver, Phoenix, Nashville). Rent growth remains sharply bifurcated by region and quality tier: supply-constrained Northeast and Midwest markets are posting rent growth in the 3-5% range, while high-supply Sun Belt metros remain flat to negative on new leases, though blended rent growth (including renewals, now 57% of all leasing activity) is holding up materially better than new-lease asking rents alone suggest. Cap rates have been broadly flat across 2025 into 2026 (roughly 4.5-5.6% for stabilized assets, higher for value-add), but most forecasters expect gradual compression as distress resolves, credit conditions ease, and renter demand growth continues to outstrip the shrinking supply pipeline – a setup that favors well-capitalized buyers able to acquire ahead of a broader repricing.
Bottom Line: Multifamily fundamentals are past their cyclical trough – vacancy has likely peaked and the supply wave is fading – setting up a gradual recovery in rent growth and cap-rate compression through 2027, though the timing remains uneven and Sun Belt/Mountain markets will lag the Northeast and Midwest.
Summary and Outlook
Taken together, the first half of 2026 leaves investors in a genuinely two-sided environment heading into the second half. On the public-markets side, the U.S. economy and corporate earnings have proven resilient, but that resilience is both increasingly narrow and dependent on continued AI-related capital spending that is manifesting in both equity and credit markets, a Fed that has turned more cautious under new leadership, and a Treasury curve that is steepening for reasons tied to fiscal issuance rather than growth optimism. International equities – both developed and emerging – have offered a genuine diversification benefit, outperforming the U.S. on stronger earnings growth and more attractive valuations, though that trade remains sensitive to the dollar and geopolitical developments.
On the private-markets side, the common theme across private equity, private credit, and private real estate is a liquidity reckoning. Private equity is sitting on a record $3.7 trillion backlog of unsold companies even as exit activity improves; private credit’s semi-liquid retail vehicles have faced a genuine test of the mismatch between quarterly redemption promises and multi-year loan maturities; and private real estate, led by multifamily, appears to be emerging from its supply-driven trough with a credible path toward better fundamentals in 2027. None of these are acute crises, but each argues for realistic expectations about the pace and timing of cash returns.
The issues most worth monitoring through year-end are: whether the Fed’s task forces and data reviews produce any meaningful change to policy communication or the inflation framework itself; whether AI-linked capital spending and earnings continue to justify current mega-cap valuations; whether the Treasury curve’s steepening remains orderly or accelerates on renewed fiscal or inflation concerns; and whether private-market realizations – via IPOs, M&A, or fund redemptions – broaden out beyond the largest, highest-quality transactions that have driven most of the improvement so far.
Sources
U.S. Macroeconomic Developments
1. Federal Reserve, FOMC Statement and Summary of Economic Projections (June 17, 2026); Federal Reserve H.15 Selected Interest Rates; Bureau of Economic Analysis, Personal Consumption Expenditures Price Index, data through June 2026. (Chart; GDP, unemployment, and dot-plot figures.)
2. Senate confirmation of Kevin Warsh as Federal Reserve Chair, 54-45 vote (May 13, 2026), sworn in May 22, 2026; widely reported, e.g. Reuters, The Wall Street Journal, NPR.
3. CME Group, CME FedWatch Tool (fed funds futures-implied policy rate probabilities).
U.S. Equity Markets
1. State Street Sector Tracker (ssga.com), Select Sector SPDR ETFs. Price return only (dividends excluded), Dec 31, 2025 close to Jul 6, 2026 close. S&P 500 proxy (SPYM) price return over same period: +10.23%. (Chart.)
2. Yahoo Finance analysis, Magnificent Seven market-cap decline of approximately $2 trillion in June 2026.
3. The Motley Fool, “The Magnificent Seven’s Market Cap vs. the S&P 500” (data as of Jul 13, 2026), for H1 2026 relative underperformance.
4. Armstrong Fleming & Moore, Inc., “Market Concentration and the ‘Magnificent Seven’” (2026); RBC Wealth Management, “The Great Narrowing: S&P 500 Concentration” (January 2026) — top-10 concentration, earnings share, and forward P/E comparisons versus the 1999-2000 peak.
U.S. Bond Markets: Treasuries, Credit & High Yield
1. U.S. Department of the Treasury, Daily Treasury Par Yield Curve Rates (home.treasury.gov). Par yields, Jan 2, 2026 and Jun 30, 2026 closes. (Chart.)
2. Federal Reserve Bank of St. Louis, FRED series T10Y2Y (2s10s spread, including the 2023 trough and 2026 range) and T10Y3M (3-month/10-year spread).
3. Federal Reserve Bank of New York, yield-curve recession-probability model (Estrella-Mishkin methodology, based on the 3-month/10-year spread).
Overseas Equity Markets: Developed & Emerging
1. MSCI EAFE and MSCI EM: mid-year 2026 investor outlook commentary citing MSCI USD total-return data, Jan 1-Jun 30, 2026. S&P 500: RBC Wealth Management H1 2026 equity recap, USD total return. KOSPI: Korea Exchange, price index, KRW, Jan 2 close (4,309.63) to Jun 30 close (8,476.48). (Chart.)
2. Lazard Asset Management, “Emerging Markets Outlook 2026” (February 2026); State Street Global Advisors, “Emerging Market Equities Outlook Q1 2026” — 2026 EPS growth consensus for EM versus developed markets.
Private Equity Market Developments
1. Bain & Company, Global Private Equity Report 2026 (and prior annual/midyear editions for historical figures). (Chart.)
2. Bain & Company, Global Private Equity Report 2026, “Welcome to a New Era” — buyout holding periods (~7 years) and the $3.8 trillion unrealized-value figure.
Private Credit Market Developments
1. Robert A. Stanger & Co., Stanger Chairman’s Report and Stanger Report (Non-Listed BDC editions), Q2 2025-Q2 2026. (Chart.)
2. J.P. Morgan Private Bank, “Private Credit Under the Microscope: Separating Headlines from Fundamentals” (March 2026) — public BDC price-to-NAV discount (~17%, in line with the June 2022 low) and Q4 2025 redemption levels (~5% of NAV on average).
3. CNBC, “Blue Owl caps private credit funds redemptions at 5% after steep request levels” (April 2, 2026); Blue Owl Capital shareholder letters, Q1-Q2 2026. Confirms the technology-focused fund cited is Blue Owl Technology Income Corp. (OTIC), which received redemption requests of 40.7% of shares outstanding in Q1 2026 and 38.1% in Q2 2026, both capped at the standard 5% quarterly limit. Blue Owl attributed the elevated requests to investor concern over AI-related disruption to software companies.
Private Real Estate Markets
1. CBRE Research. Vacancy rate from CBRE U.S. Multifamily Figures (quarterly). Cap rate from CBRE Multifamily Underwriting Survey, core/prime going-in cap rate. (Chart.)
2. CBRE Research, U.S. Real Estate Market Outlook 2026 – Multifamily. Confirms the 57% renewal share of leasing activity and the “stable in 2026, incremental compression in following years” cap rate outlook.
3. CBRE Research, “Annual Multifamily Investment Volume Up by 9%”. Confirms full-year 2025 multifamily investment volume of $161.6 billion, up 9.1% year-over-year, supporting the “multi-year high” characterization.
Disclosure
CCG Wealth Management LLC (“Centura”) is a registered investment advisor. Advisory services are only offered to clients or prospective clients where Centura and its representatives are properly licensed or exempt from licensure. The information provided is for educational and informational purposes only and does not constitute investment advice and it should not be relied on as such. It should not be considered a solicitation to buy or an offer to sell a security. It does not take into account any investor’s particular investment objectives, strategies, tax status or investment horizon. You should consult your attorney or tax advisor. The views expressed in this commentary are subject to change based on market and other conditions. These documents may contain certain statements that may be deemed forward looking statements. Please note that any such statements are not guarantees of any future performance and actual results or developments may differ materially from those projected. Any projections, market outlooks, or estimates are based upon certain assumptions and should not be construed as indicative of actual events that will occur. All information has been obtained from sources believed to be reliable, but its accuracy is not guaranteed. There is no representation or warranty as to the current accuracy, reliability or completeness of, nor liability for, decisions based on such information and it should not be relied on as such. No investment strategy or risk management technique can guarantee returns or eliminate risk in any market environment. All investments include a risk of loss that clients should be prepared to bear. The principal risks of Centura strategies are disclosed in the publicly available Form ADV Part 2A. Past performance is not indicative of future results, which could differ substantially. For additional information, please visit our website at https://centurawealth.com/.
