Executive Summary
The Baltic Dry Index (BDI) is a meaningful economic indicator that may return to its heyday as a predictor of future changes in market prices. At Centura, we believe the BDI is a great barometer for global economic health and is likely to be a useful data point as trade wars continue to escalate. Understanding how changes in global trade and key macro-economic factors may impact your portfolio is a key consideration related to portfolio planning and investment strategy.
For example, what does a trade war mean for your portfolio?
- Our models show that a repeat of 1930’s mistakes between the US and China could result in:
- US markets under-performing global markets
- Gold becoming an outperforming asset class
- BDI could be down 30%
- Alternately, successful resolution of the trade conflict with China could result in:
- US markets outperforming their global counterparts
- Gold becoming an underperforming asset class
- BDI could be up 5% or more
At Centura Wealth Advisory we specialize in constructing globally diverse portfolios and the Baltic Dry Index (BDI) is one tool we use to measure the current health of the global economy. We model the BDI in combination with other factors to learn how changes may impact markets & portfolios. When designing and managing our clients’ portfolios, we are careful to evaluate emerging trends (e.g., recent changes in BDI rates) to assess where there may or may not be opportunity and/or risk. Read our blog post on Trade Wars and the Baltic Dry Index to understand why we like this indicator and how it may be used by investors and advisors alike.
Introduction
In looking back on historical markets, one might find reference to an oft used leading economic indicator known as the Baltic Dry Index (BDI). For a long period of time prior to the Great Recession, BDI rates correlated with market moves and changes in the BDI rates came before moves in market prices. This made the BDI a valuable leading economic indicator. However, in 2009 structural shifts entered the shipping industry and a key global economy (China) softened demand. This combination of changes in both supply and demand caused changes in BDI rates to diverge with changes in the prices of other key global markets that were expanding (e.g., the US Equity Market). Since 2009, BDI shipping rates have been less useful for predicting price changes in most major markets although we believe they could become more meaningful again. This post will discuss why.
The Baltic Dry Index1
The Baltic Dry Index is reported daily by the Baltic Exchange in London. The index provides a benchmark for the price of moving the major raw materials by sea. The Baltic Dry Index is not restricted to Baltic Sea countries or to a few commodities like crude oil. Instead, the Baltic Dry Index accounts for 23 different shipping routes carrying coal, iron ore, grains and many other commodities.
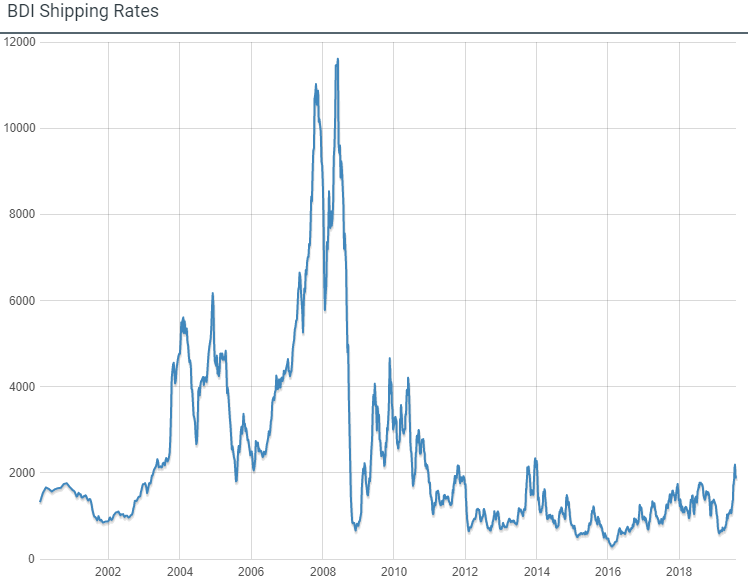
The Baltic Dry Index measures charter rates for dry bulk ships, which haul raw goods like iron ore, coal, and grains. Typically developed (and/or growing) nations provide healthy demand for raw goods when economic conditions are steady and/or improving. Additionally, the cost to fill a dry bulk carrier with raw goods is significant and nations typically do not order goods they do not expect to consume/refine. Chart 1 shows how the BDI has changed over time.
Chart 1 – Baltic Dry Index Shipping Rates2
What does BDI measure?
BDI rates measure the interplay between two unique aspects of the shipping market:
- Global demand for raw goods
- Size of the shipping fleet (supply)
These two dynamics interact to determine BDI rates on raw goods. For example, rising demand on a fixed supply of ships (ceteris paribus) means that BDI rates go higher; and vice versa. However, when shipping supply is no longer fixed (ceteris paribus) prices are subject to 2 changing factors and the rates themselves no longer reflect changes in demand alone. In our opinion, this is a key reason why BDI rates have diverged from market prices since 2009 and why some practitioners no longer use this tool.
Chart 2 – Baltic Dry Index Correlations to other asset classes since December 2008
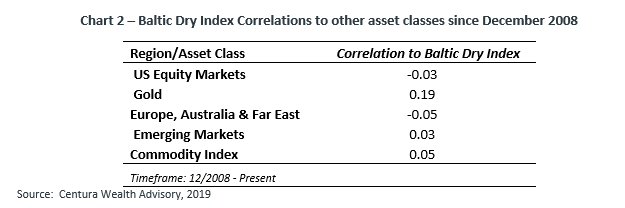
Our quantitative findings indicating low to no correlation amongst the BDI and various indices since 2009, are presented in Chart 2. These figures are in strong contrast to the higher correlations seen in prior periods, for example 2006 – 2009; see below.
Chart 3 – Baltic Dry Index Correlations to other asset classes 2006 to December 2008
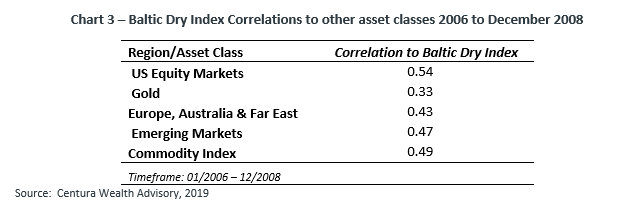
It is clear from these numbers that something is markedly different between these 2 periods of time in these markets. To support our quantitative findings, we will decompose both demand and supply as they relate to the Baltic dry index and evaluate what market conditions look like on a go forward basis.
BDI Market Decomposition: Demand
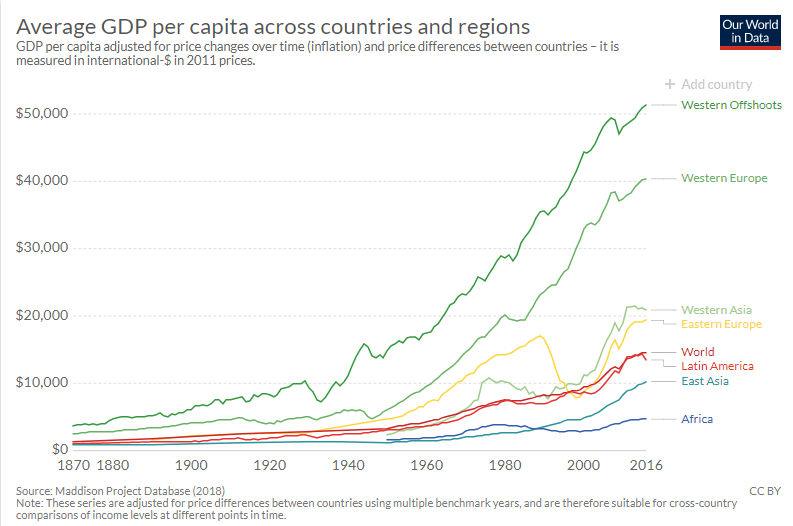
Dry bulk commodities are raw materials that are to be utilized in the global manufacturing and production process. When countries are building, growing and expanding they tend to provide strong demand for bulk dry goods. Demand for raw goods comes from growing countries and regions which are depicted in the chart below using average GDP per capita as a measure of economic prosperity over time.
Chart 4 – Average GDP per Capita3
BDI Market Decomposition: Supply
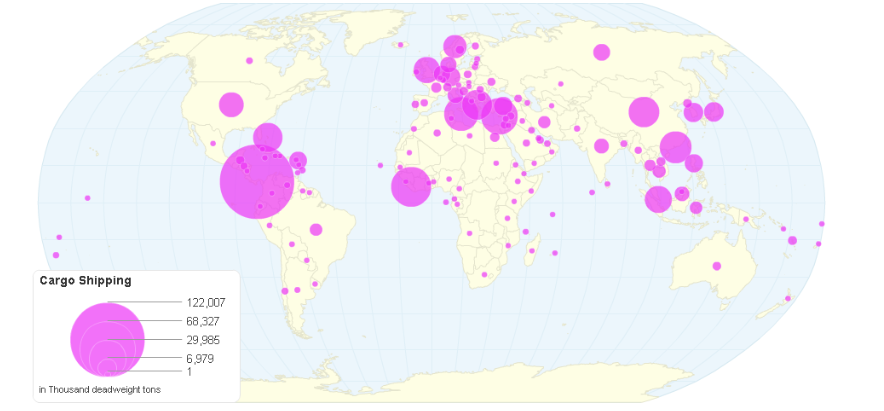
In turning to supply, we find that countries all over the world are engaged in cargo shipping with certain regions being more engaged than others; including many emerging markets (Chart 4). These countries/regions are typically commodity rich and benefit when exporting their primary good(s). However, they can also be economically volatile as their health is reliant upon that of developed nations and the global economy.
Chart 5 – Cargo Shipping by Country4
Another consideration as related to supply is not just the countries which supply raw goods, but also the vessels used to carry them. The sophistication, length of time and construction costs for bringing new dry bulk carrier ships to market provides high barriers to entry and tend to make vessel supply numbers easy to estimate. This means that during times of stable vessel supply, changes in historical BDI rates are more reflective of changes in demand as compared to changes in supply.
This was largely the case prior to 2002. However, beginning in 2003 and accelerating dramatically from 2007 to 2009 that changed, and a large new supply of dry bulk carrier ships began coming online, increasing competition and decreasing rates.
Chart 6 – World Tonnage on Order, 2000-2018 (thousands of dead-weight tons)5
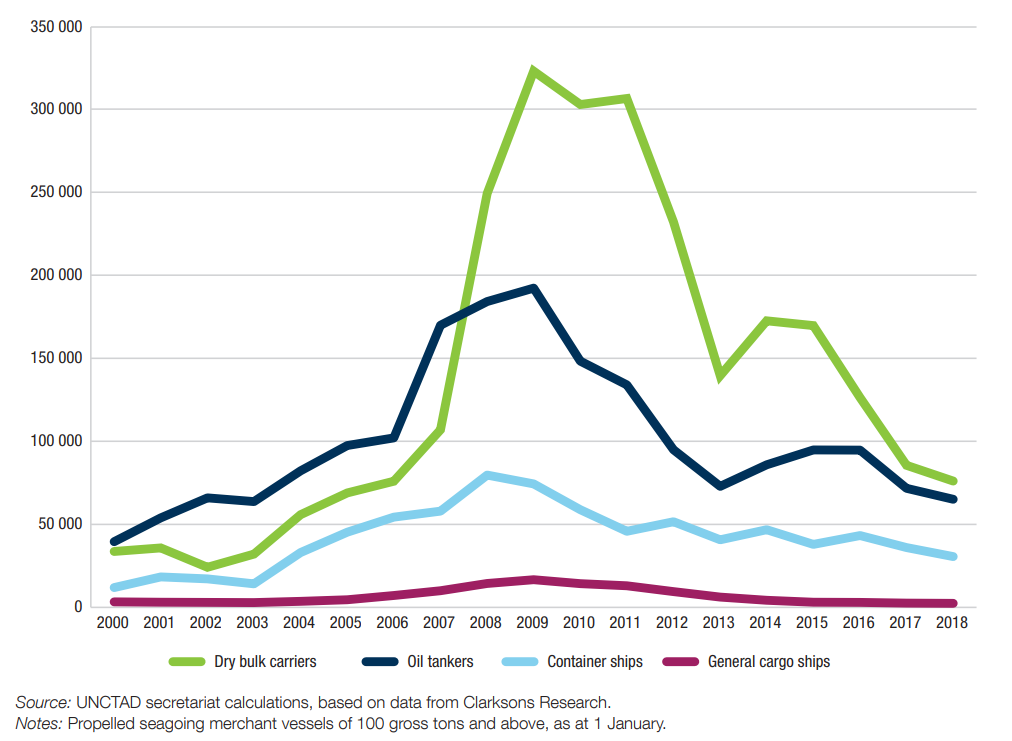
This dramatic threefold increase in the supply of dry bulk carrier ships meant that BDI rates were no longer reflective of demand alone, and when contextualized against historical rates, became meaningless. That said, orders for new ships has come down dramatically since peaking in 2009 and that has led to more stable vessel supply. Stable supply should return market dynamics to how they were prior to the 2007-2009 period and that means that on a go forward basis the BDI may be a more useful indicator for measuring changes in global demand for raw goods. If so, this will be helpful in many ways.
Relationships to Markets and Why It Matters Going Forward
Global markets are currently very tense, asset prices are at all-time highs and every headline has the potential to rattle markets. At Centura, we recommend keeping an eye on the Baltic Dry Index as a measure of global economic health. A healthy global economy is likely a boon for many markets around the world and any weakness may be forecasted in this leading economic indicator. We design portfolios to strategically take advantage of emerging themes like this one and use sophisticated technology to model and stress test potential changes in factors such as the BDI.
For investors who are uncertain how their portfolio will handle global market shifts, and to understand how changes in the BDI may impact your portfolio, contact Centura for a complimentary portfolio review and related stress test. We will help you evaluate your country/regional exposure as well as measure your portfolios sensitivity to changes in key variables across a wide variety of scenarios.
You will learn how your portfolio behaves and what it responds to; both positively and negatively. Many of our clients benefit from this type of information as it provides clarity, understanding and the framework to make sound investment decisions.
References
1 Trading Economics – Baltic Dry Exchange Index: https://tradingeconomics.com/commodity/baltic
2 Centura Wealth Advisory
3 ChartsBin – Cargo Shipping by Country: https://chartsbin.com/view/42162
4 Our World in Data – Economic Growth: https://ourworldindata.org/economic-growth
5 UNCTAD – Review of Maritime Transport: https://unctad.org/en/PublicationChapters/rmt2018ch2_en.pdf
Disclosures
Centura Wealth Advisory (“Centura”) is an SEC registered investment adviser located in San Diego, California. This brochure is limited to the dissemination of general information pertaining to Centura’s investment advisory services. Investing involves risk, including risk of loss.
Centura Wealth does not make any representations as to the accuracy, timeliness, suitability or completeness of any information prepared by any unaffiliated third party, whether linked to or incorporated herein. All such information is provided solely for convenience purposes and all users thereof should be guided accordingly.
We are neither your attorneys nor your accountants and no portion of this material should be interpreted by you as legal, accounting or tax advice. We recommend that you seek the advice of a qualified attorney and accountant.
For additional information about Centura, please request our disclosure brochure as set forth on Form ADV using the contact information set forth herein, or refer to the Investment Adviser Public Disclosure web site (www.adviserinfo.sec.gov). Please read the disclosure statement carefully before you engage our firm for advisory services.