At a Glance
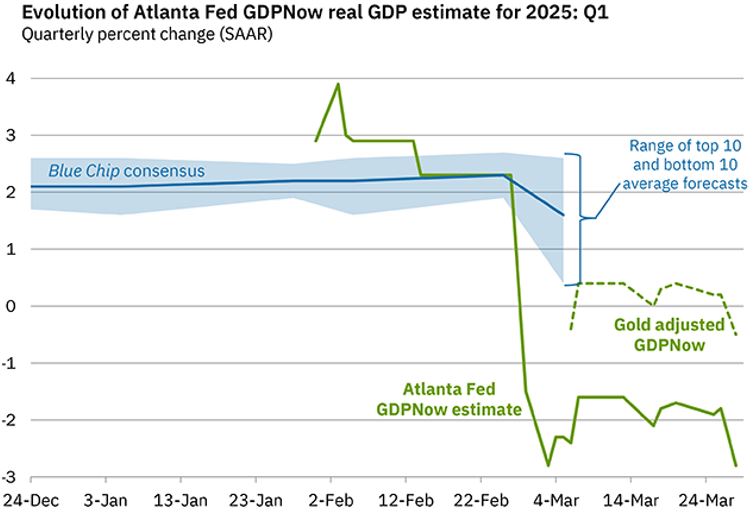
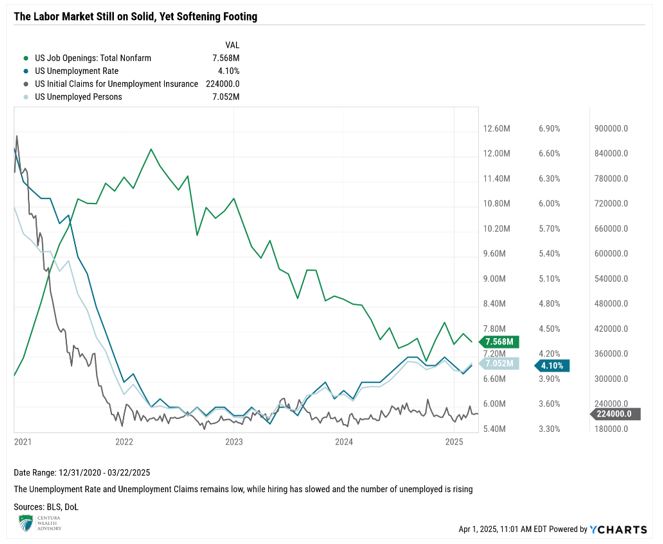
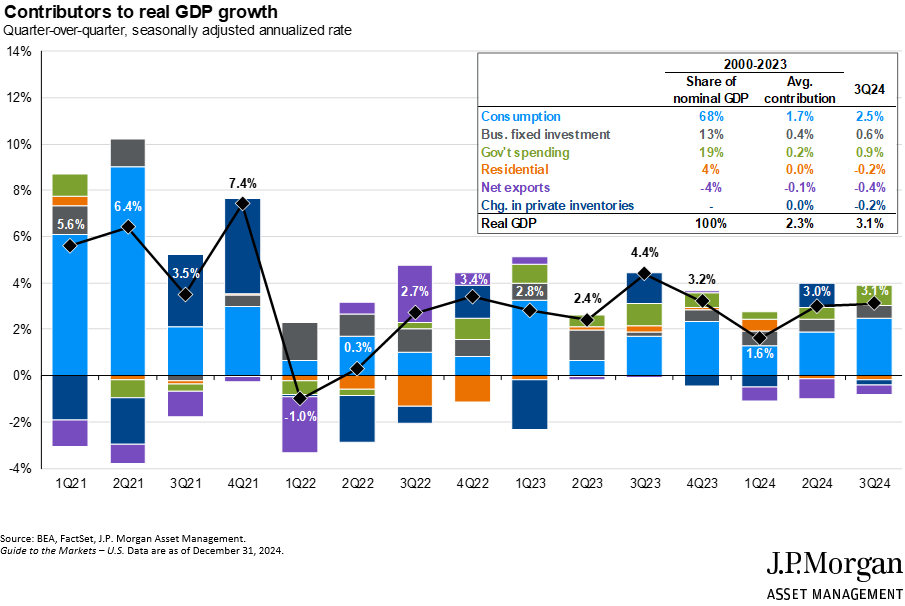
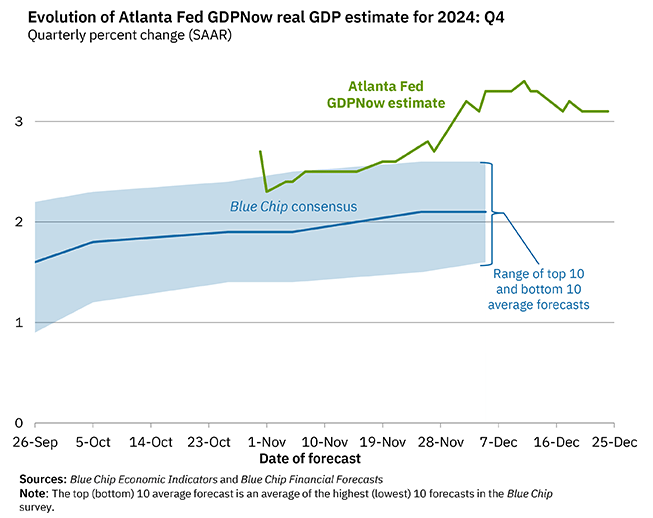
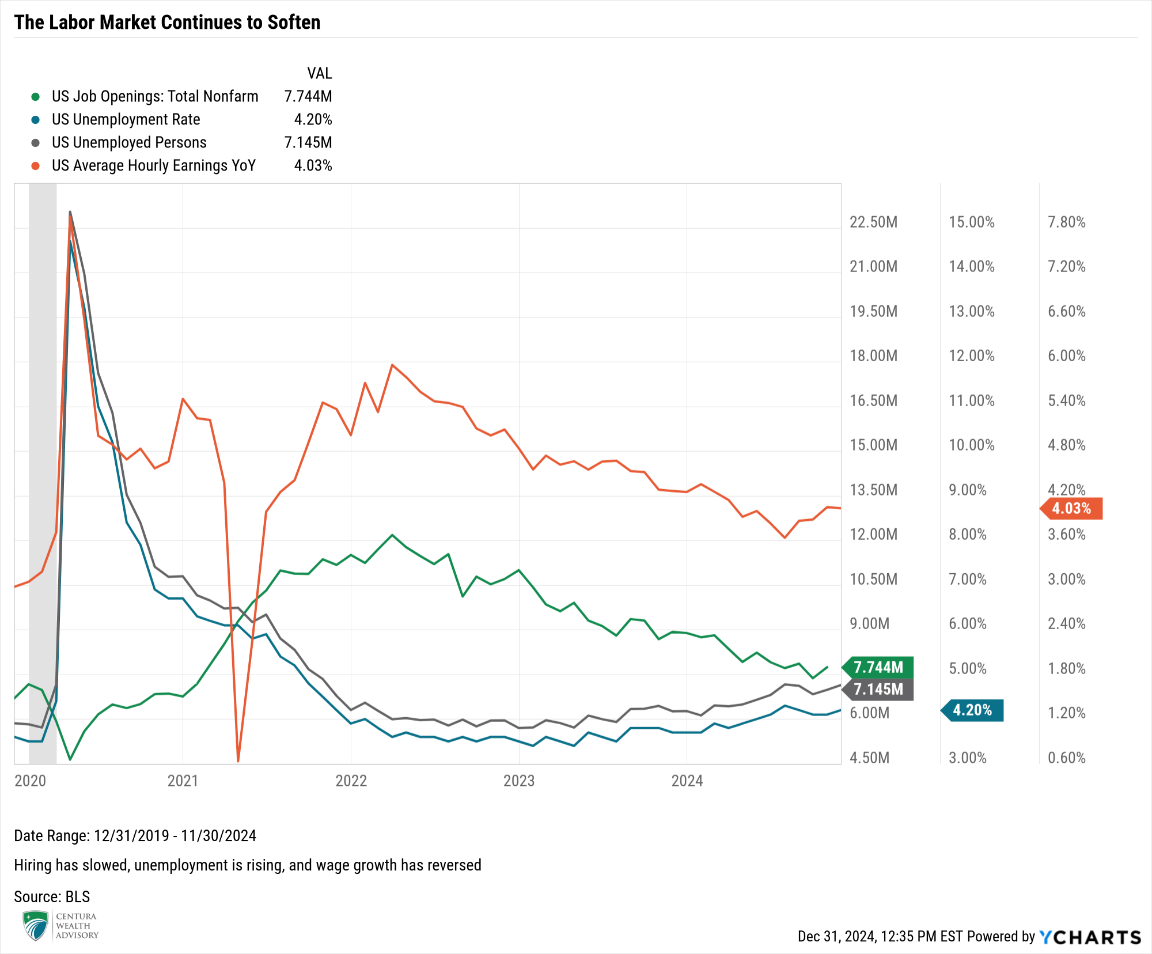
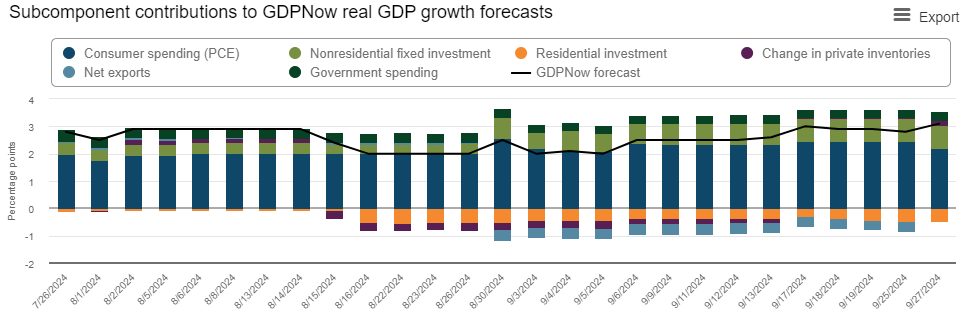
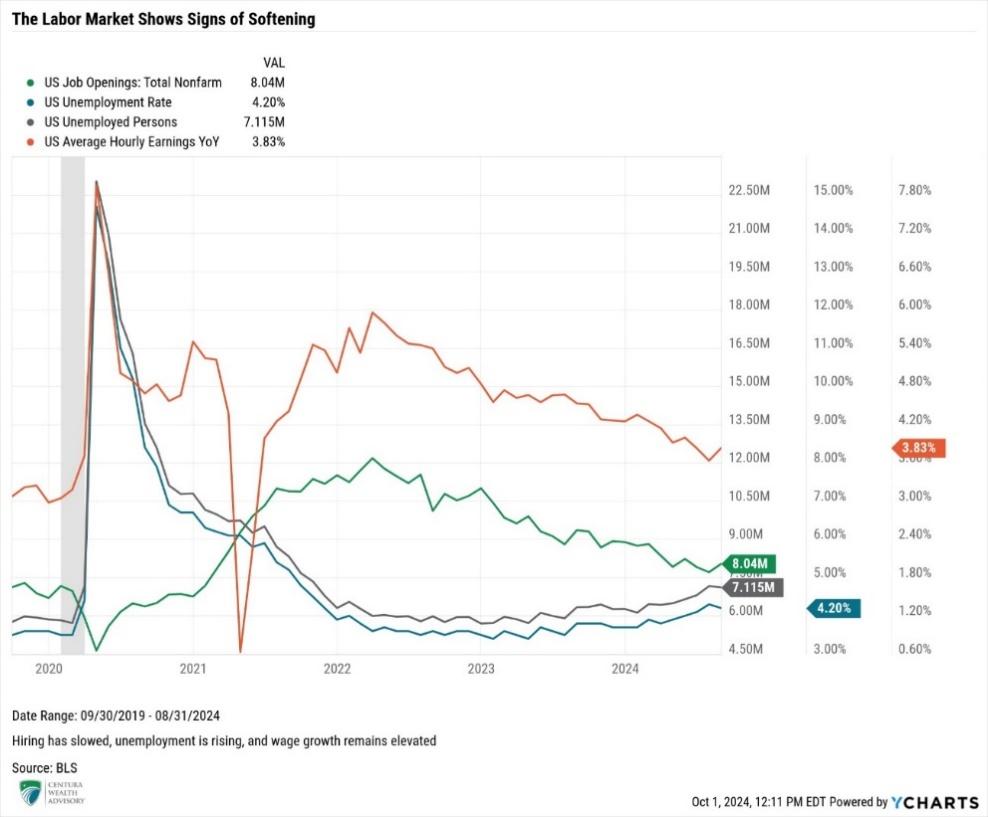
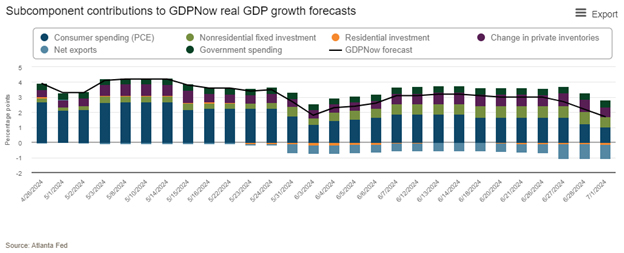
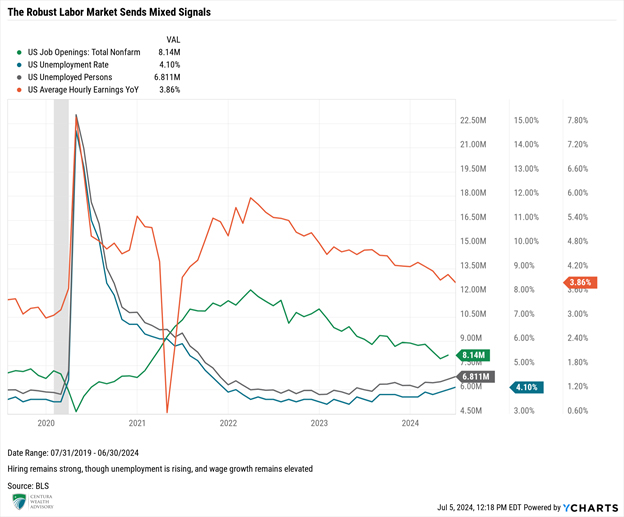
Macro Indicators: Headline and core PCE inflation rose by 2.1% and 2.5%, respectively, in April, a slight decline from March’s figures. The PCE data showed a slowdown in consumer spending and an increase in the personal savings rate, both reflecting a gloomier consumer outlook. Despite the gloom, the labor market remains on solid footing with jobs added in April exceeding expectations. GDP growth in 2Q also points to a rebound into positive territory according to the Atlanta Fed’s GDPNow tool, reversing 1Q’s negative reading that showed a surge in imports due to tariff front-running.
Trump 2.0: Trade negotiations continue to play out amid a recent federal judicial panel ruling that Trump’s tariffs are illegal. Chinese tariffs were slashed but trade talks remain on rocky footing. Meanwhile President Trump doubled down on steel tariffs, proposing to increase them from 25% to 50%. The budget bill, which also includes tax policy, was passed by the House and moved forward to the Senate, where it continues to face criticism for not doing enough to help balance the budget.
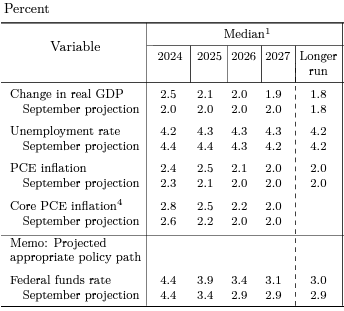
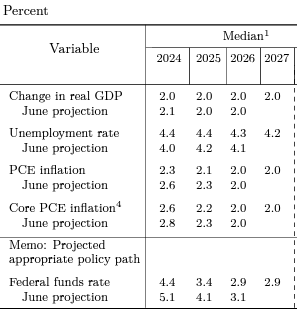
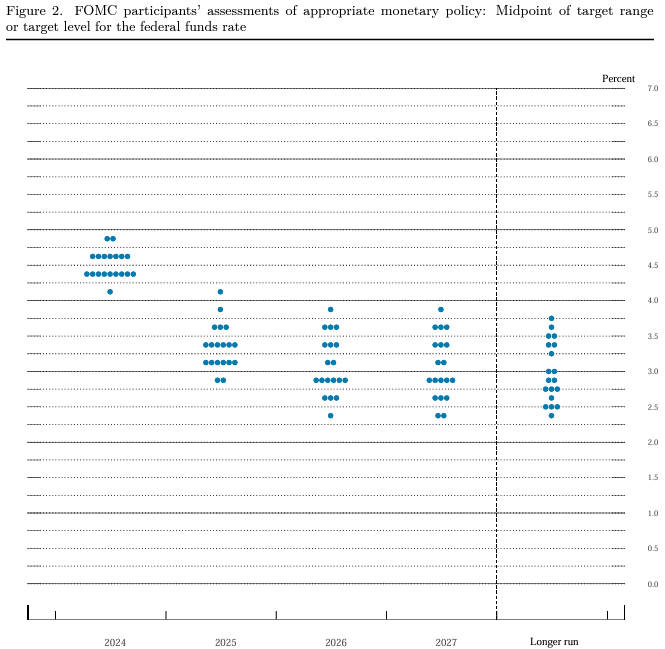
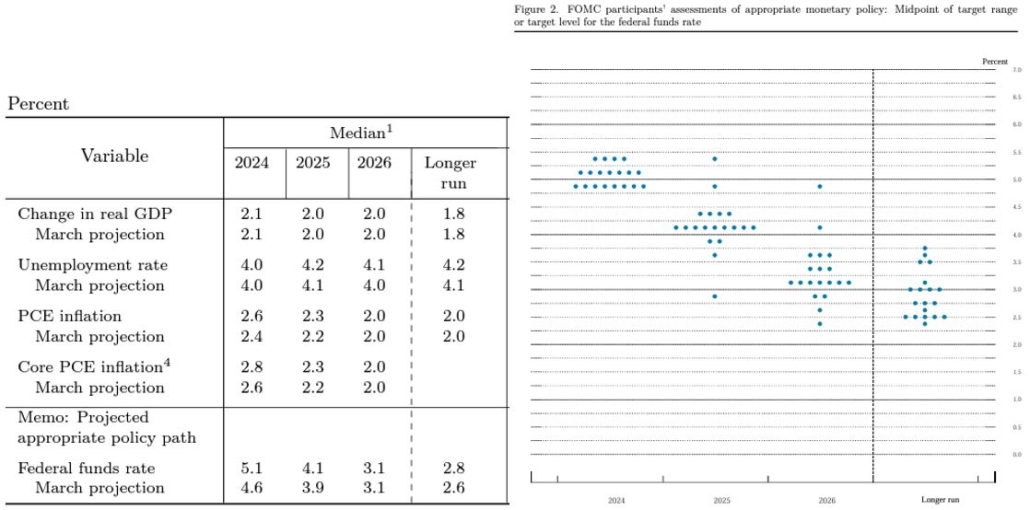
Fed & Monetary Policy: The Fed held rates steady at the May FOMC meeting, citing a continued concern in inflationary pressures surrounding tariff uncertainty. Expectations for interest rate cuts have been pushed out to later in the year, with the next rate cut anticipated in September according to CME Group’s FedWatch tool.
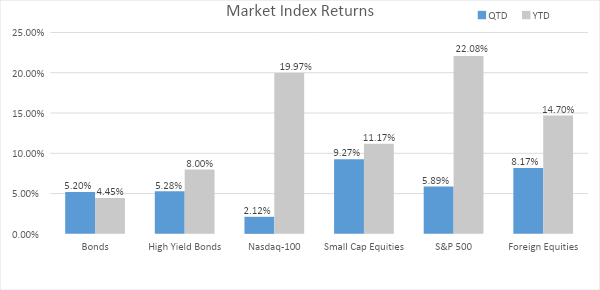
Capital Markets: After a rocky April, U.S. equities had their best May since 1990, with the S&P 500 up over 6% as trade talks progressed and some tariffs were alleviated. Tech stocks staged the largest comeback, with the Nasdaq-100 up around 9% for the month. On the other hand, fixed income markets saw greater volatility as uncertainty mounted related to the U.S. deficit and Moody’s published a downgrade in U.S. sovereign debt, both of which likely point to higher long-term interest rates moving forward.
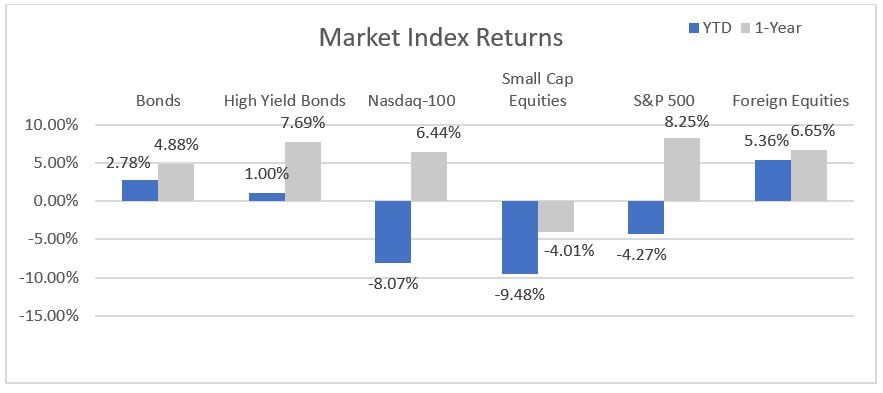
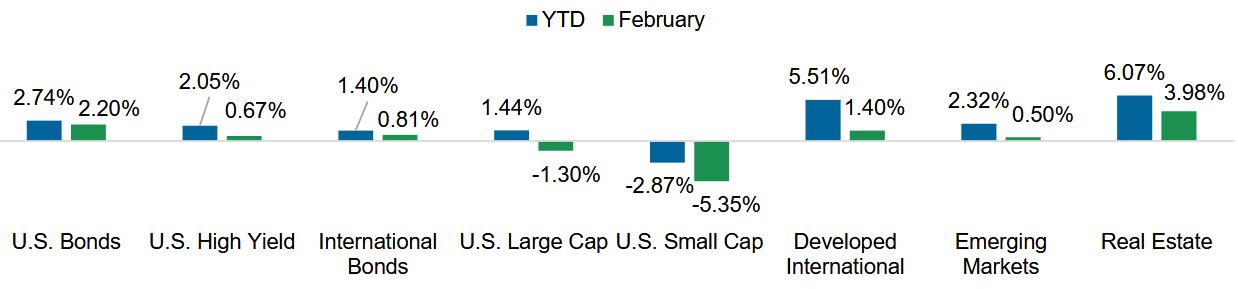
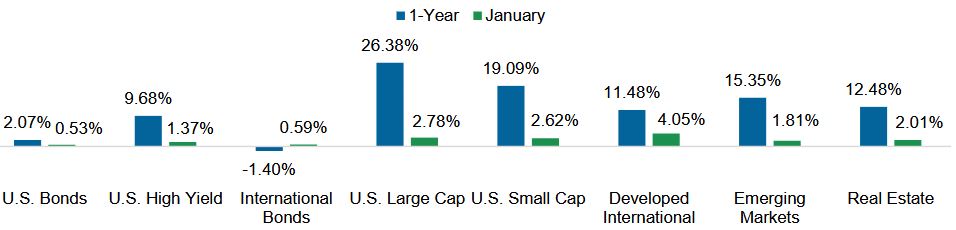
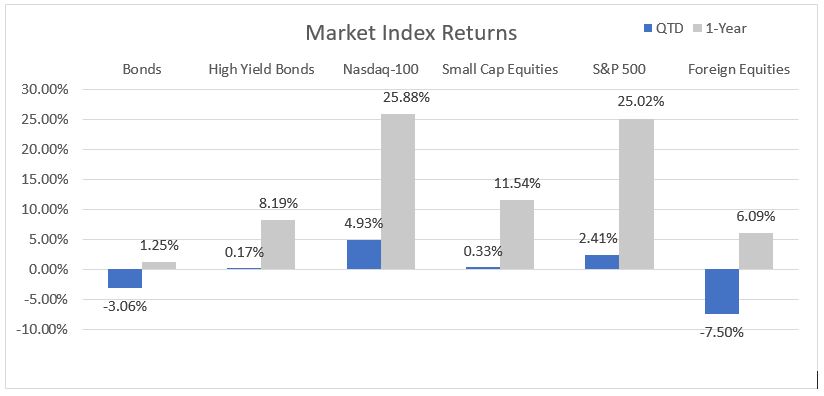
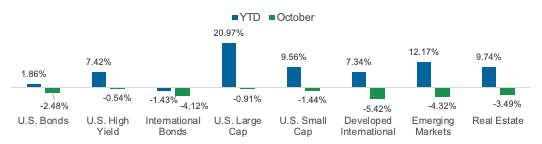
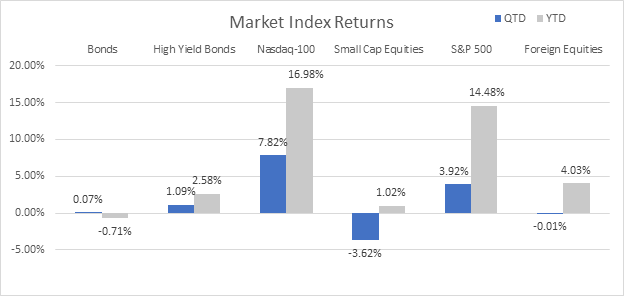
Asset Class Performance
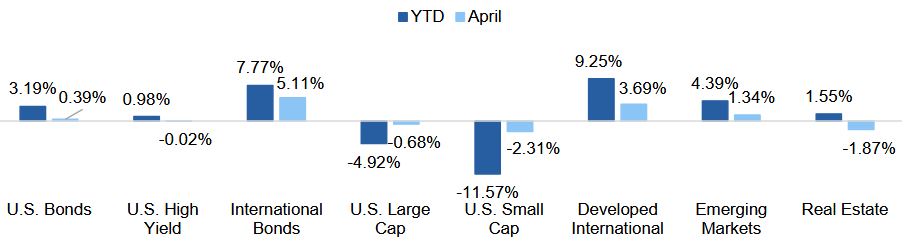
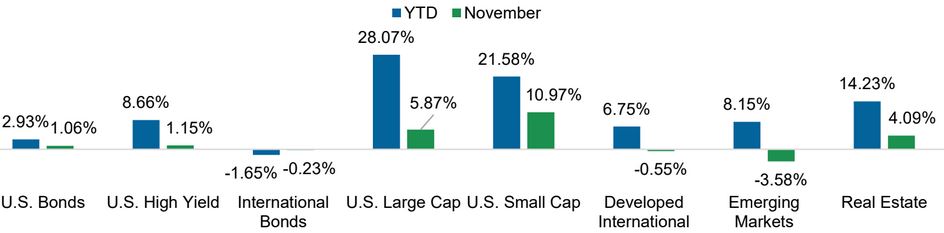
Equities bounced back in May, particularly within the U.S., with large caps and small caps up over 6% and 5%, respectively. International equities had a more muted month compared to the U.S. but continue to show strong positive returns on a year-to-date basis. Fixed income markets had more tepid returns in May, especially in the investment grade sector.
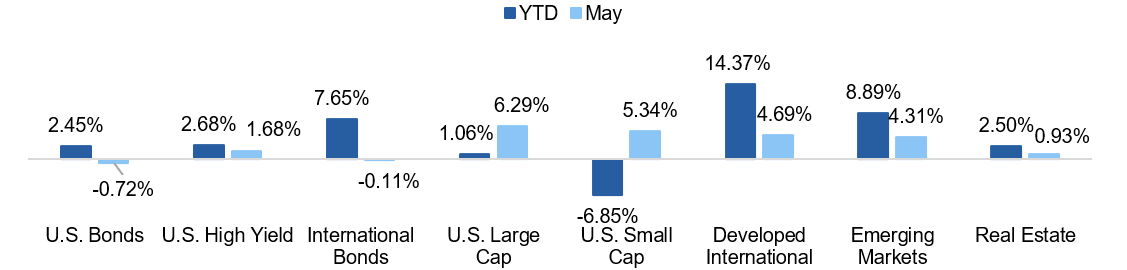
Source: YCharts. Asset class performance is presented using total returns for an index proxy that best represents the respective broad asset class. U.S. Bonds (Bloomberg U.S. Aggregate Bond TR), U.S. High Yield (Bloomberg U.S. Corporate High Yield TR), International Bonds (Bloomberg Global Aggregate ex-USD TR), U.S. Large Cap (S&P 500 TR), U.S. Small Cap (Russell 2000 TR), Developed International (MSCI ACWI ex US TR), Emerging Markets (MSCI EM TR), and Real Estate (Dow Jones U.S. Real Estate TR).
Markets & Macroeconomics
Why the Moody’s Downgrade Matters
On May 16, Moody’s became the last credit rating agency to strip U.S. sovereign debt of its AAA status, citing a decades-long increase in “government debt and interest payment ratios to levels that are significantly higher than similarly rated sovereigns,” like Denmark and Australia. The reasons for the downgrade should not have come as a surprise to markets, but the timing of the downgrade is significant. Credit rating agencies Fitch and S&P already downgraded U.S. debt in 2023 and 2011, respectively, but Moody’s decision to cement the downgrade at a time when the Trump Administration is working on a budget package seems poignant. This downgrade sent a clear signal to markets and policymakers that applying additional pressure to the federal deficit – specifically trying to add trillions of dollars to the deficit over the next 10 years, as analyzed by the Congressional Budget Office (CBO) via the current budget bill – will have consequences on the economy.
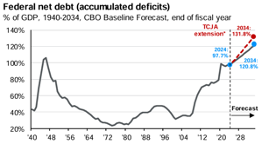
The key concern isn’t necessarily that the U.S. will default on its debt, but, rather, they will have greater difficulty in servicing their debt because of higher interest rates paid on the debt and ballooning U.S. interest costs. According to the CBO, the current debt-to-GDP ratio is ~100%, just shy of the level during World War II (106%), and projections are calling for this ratio to increase to nearly 120% in the next 10 years, illustrated in Exhibit 1. Servicing sovereign debt means garnering demand for it, and if the credit risk of U.S. sovereign debt is higher, as cited by (now) all three major credit rating agencies, two things could happen: there could be less demand for U.S. bonds than there historically has been, and/or investors could demand a higher yield for taking on the additional risk now associated with U.S. debt.
Exhibit 1: Federal Debt Held by the Public
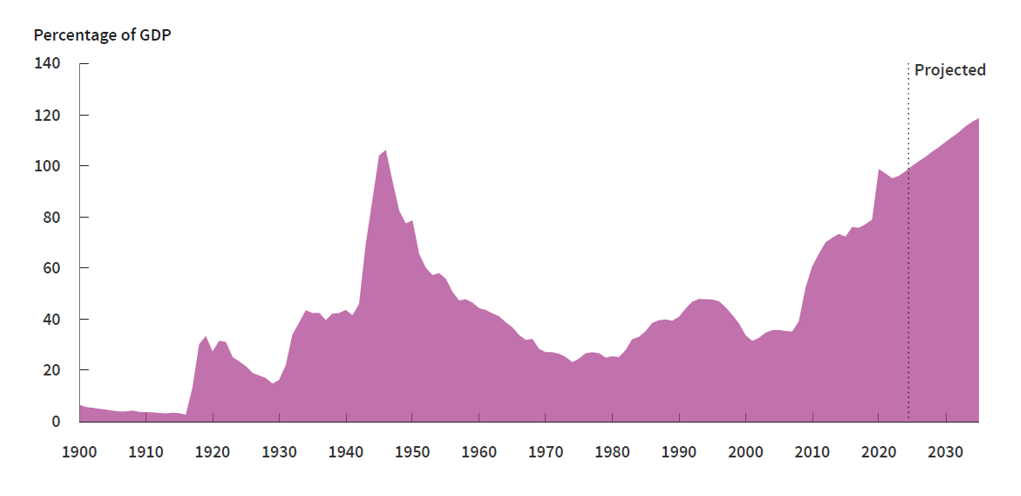
Source: Congressional Budget Office
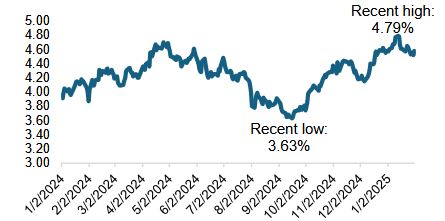
This is why Treasury auctions have become more interesting to watch. Even prior to the Moody’s downgrade, an auction for 20-year debt showed lackluster demand and caused longer-term Treasury yields to move higher. The 10-year yield touched above 4.5% and the 30-year yield breached 5.1%, its highest level since 2007, illustrated in Exhibit 2. Ultimately, the Moody’s downgrade has amplified concerns surrounding the “safe haven” status of the U.S. and its “risk-free” assets.
Exhibit 2: 10- and 30-Year Treasury Yields
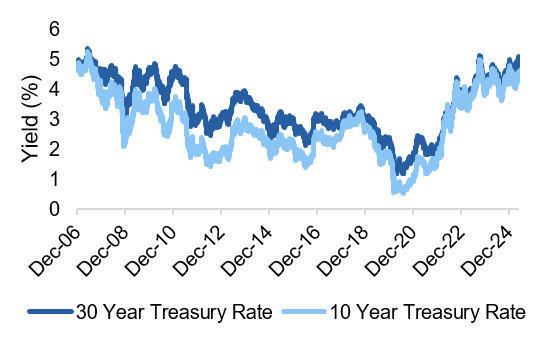
Source: YCharts
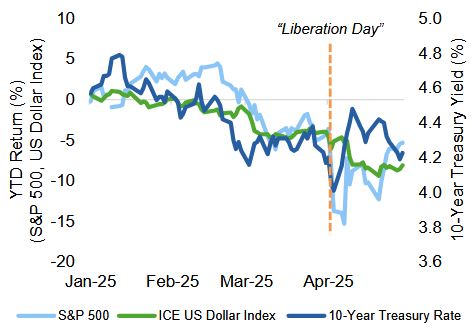
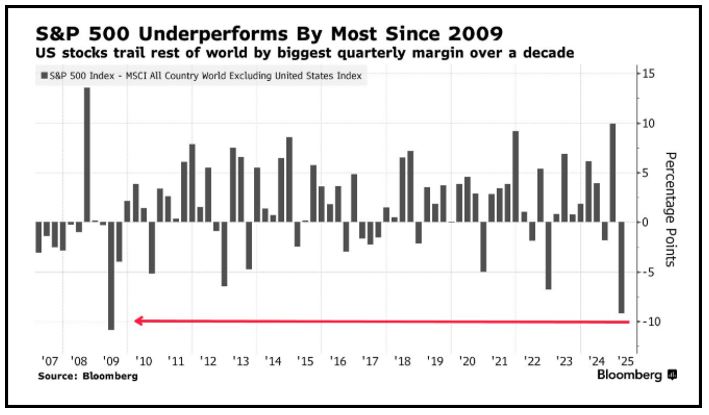
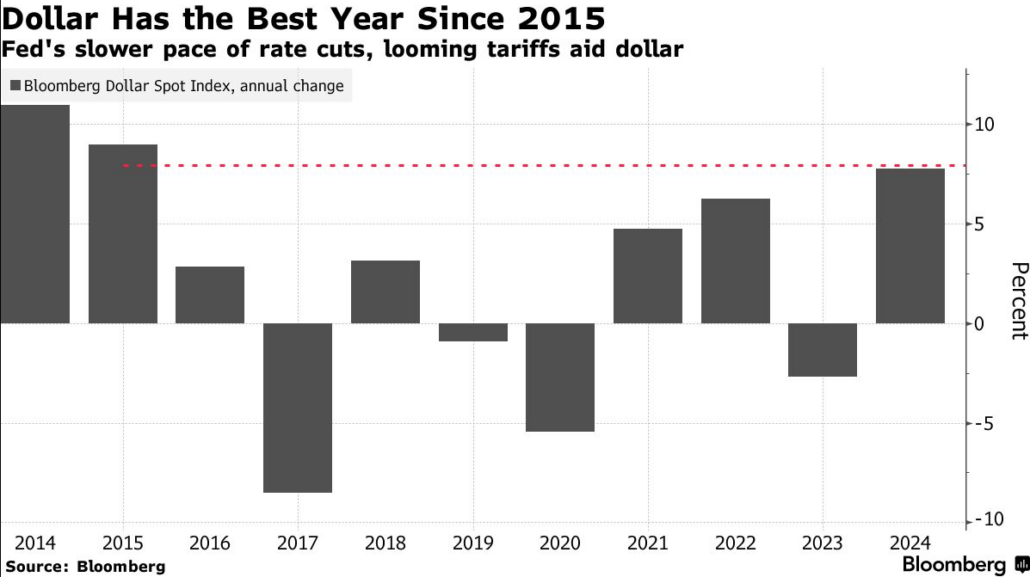
The lack of fiscal responsibility in the U.S. as well as the more recent protectionist stance resulting from tariffs is causing some investors to diversify away from U.S. assets. Like the credit rating agencies, some investors feel these recent trends make the U.S. less desirable for their investments than it has been historically. We are seeing this sentiment manifest in broader outflows from U.S. assets, like equity markets and the U.S. Dollar Index in the short-term, and it could result in Treasury yields fetching a higher premium moving forward. All in all, investors should watch the progress of the current budget bill floating in Congress and consider diversification in fixed income portfolios.
The Bottom Line: Moody’s downgrade of U.S. sovereign debt this month is an important reminder that America has become too complacent with its federal debt levels, and investors worried about knock-on effects could consider further diversification, particularly as budget bill negotiations play out.
Looking Ahead
Q1 Earnings Reveal Resilience For Now
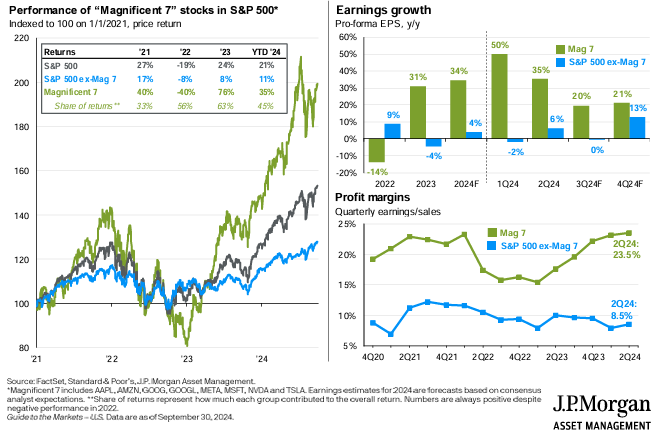
First quarter earnings season is coming to a close and earnings growth figures have stunned to the upside, growing 13.3% on a year-over-year basis, nearly double initial projections, showcasing the resilience of U.S companies. This quarter’s earnings announcements took place as tariff policy was roiling markets, providing a potentially stark contrast between strong current, and weaker future, business conditions, should policy uncertainty remain.
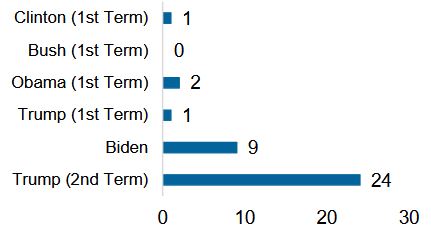
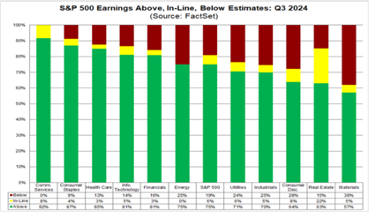
While the strongest earnings reports came from major technology companies who continue to outline capital expenditures in AI-related initiatives, there is no doubt that the uncertain macroeconomic backdrop is making forecasts for future earnings growth muddled, if not impossible, paralyzing companies until additional clarity is gained. According to FactSet research, only 3% of companies in the S&P 500 withdrew EPS guidance for fiscal year 2025, with those that did withdraw largely citing tariff uncertainty as the primary culprit. On the flip side, over 50% of companies who issued guidance for 2025 chose not to update them this quarter, illustrated in yellow in Exhibit 3, showcasing how tariffs have caused companies to pause amid the uncertainty. This reaction makes current projections potentially inaccurate as they are “pre-tariffs,” meaning we could see adjustments to the downside moving forward if tariffs remain a factor, putting even greater emphasis on future earnings seasons as a barometer for the broader U.S. economy.
Exhibit 3: S&P 500 Companies Who Issued 2025 Guidance
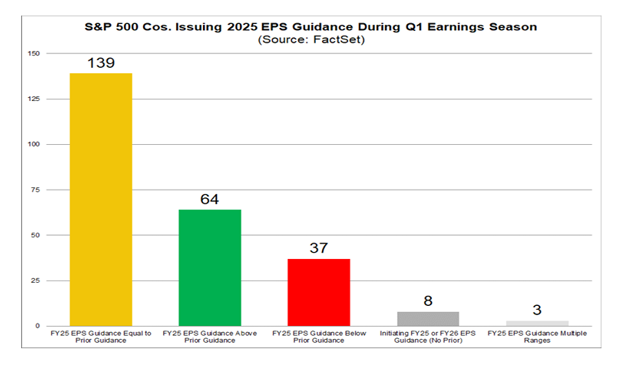
Source: FactSet. Data as of May 23.
A key factor at play directly impacting U.S. businesses is the health of the U.S. consumer, which is showing signs of weakening in survey data amid the macroeconomic uncertainty. A weaker consumer could spell trouble for consumer-led sectors, like consumer discretionary and even pockets of consumer staples, especially if margins are further strained from pending tariffs. Monitoring these businesses and their future earnings will provide important insights into whether policies, like tariffs, are impacting the economy and creating a pinched consumer. A prime example we have already seen is in the airline industry, with major airlines reducing the number of domestic flights offered as consumers cut back on travel.
Another tariff fallout that could challenge the resilience of U.S. companies is whether businesses are forced to implement cost cutting measures like layoffs or a reduction in capital expenditures to offset tariff price increases. The Q1 earnings season did reveal some layoffs from companies, but for more idiosyncratic or company-specific reasons, and, as of now, we aren’t seeing broader layoffs to offset the additional costs brought on by levies. All the more reason to continue watching labor market data moving forward.
Lastly, just like 1Q GDP growth, 1Q earnings illustrated a “pull-forward” in demand in anticipation of potential tariffs, which is expected to reverse in future quarters, potentially creating earnings volatility for those businesses more reliant upon international trade. As trade negotiations are carried out and we approach the initial 90-day deadline for “Liberation Day” tariff implementation in early July, commentary from U.S. companies will provide important insight into whether the earnings resilience we have witnessed in recent quarters will persist.
The Bottom Line: Looking ahead, earnings will be an important indicator of U.S. economic health, and the resilience displayed by U.S. companies in recent quarters is expected to be challenged by tariffs and the ongoing policy uncertainty in upcoming quarters, doubling the importance of monitoring future earnings announcements.
Capital Markets Themes
What Worked, What Didn’t
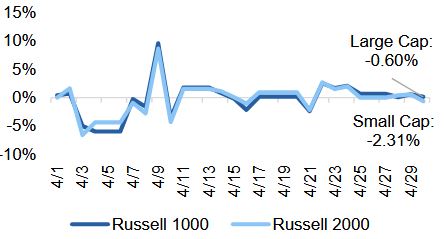
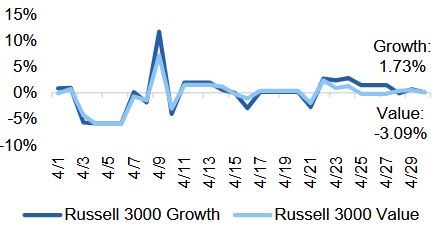
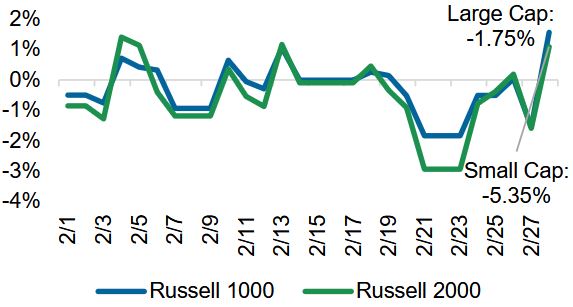
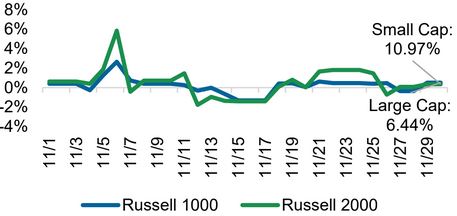
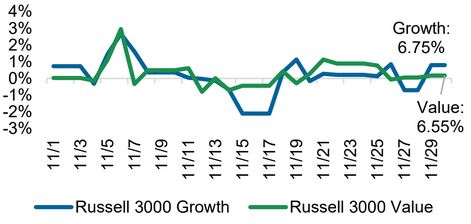
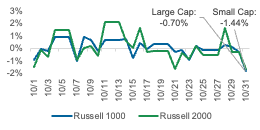
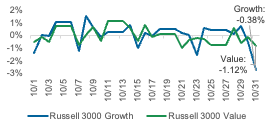
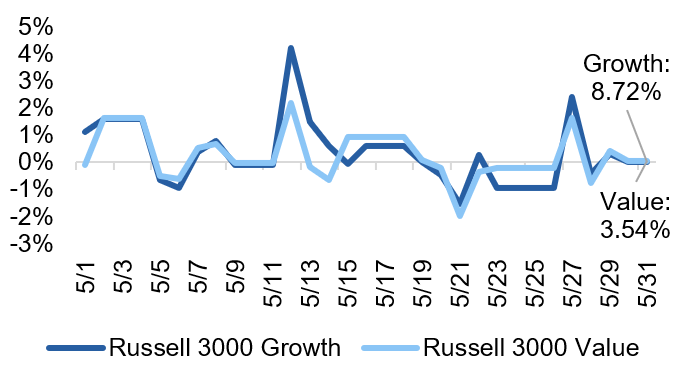
•U.S. Equities Stage Comeback: After a volatile April, U.S. equity markets made up ground in May as news of trade negotiations and tariff alleviations moved markets, with large cap stocks, particularly growth companies, making up the most ground.
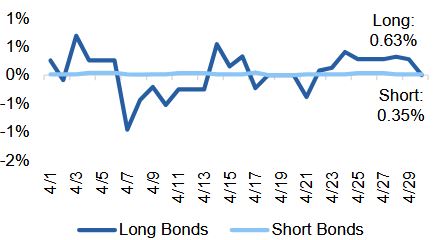
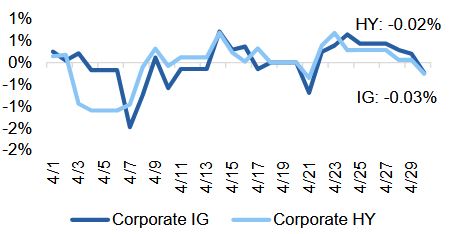
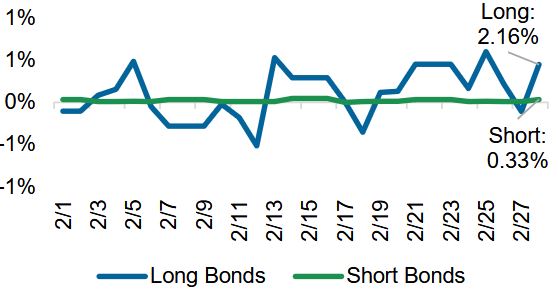
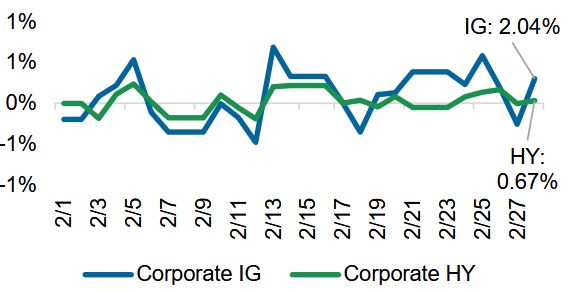
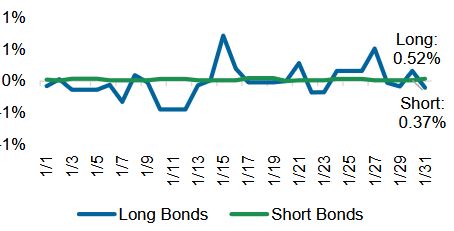
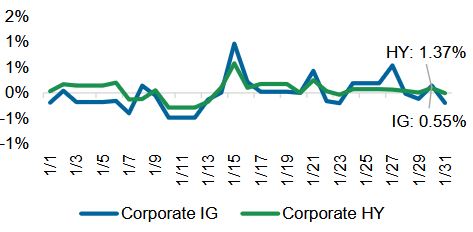
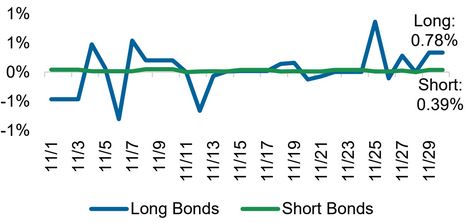
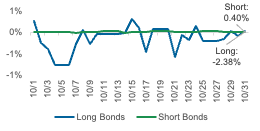
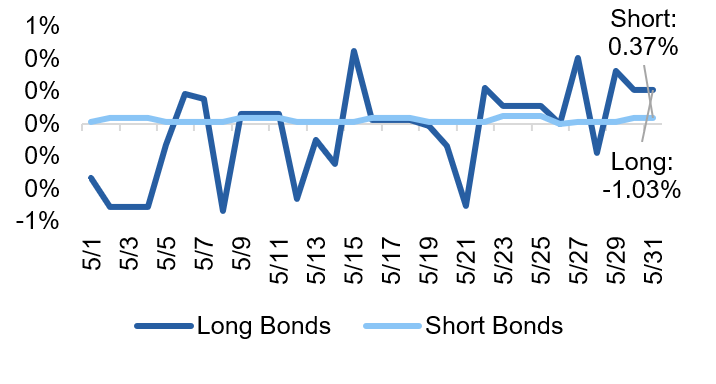
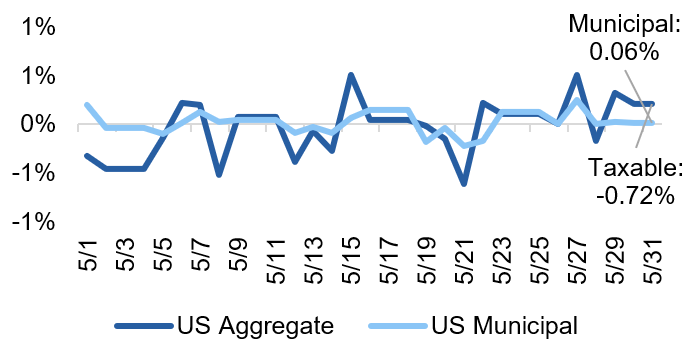
•Fixed Income Worries: News of the U.S. sovereign debt downgrade, the impending budget bill floating around Congress, and Fed concerns over rising inflation caused volatility in fixed income markets in May. Long duration bonds detracted over the month versus short duration bonds, and investment grade bonds underperformed their high yield counterparts as the “risk-on” appetite took hold.
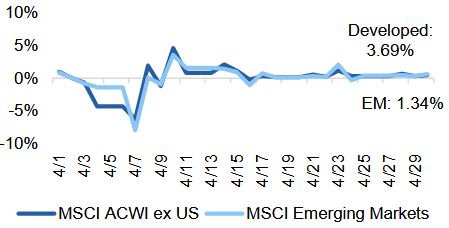
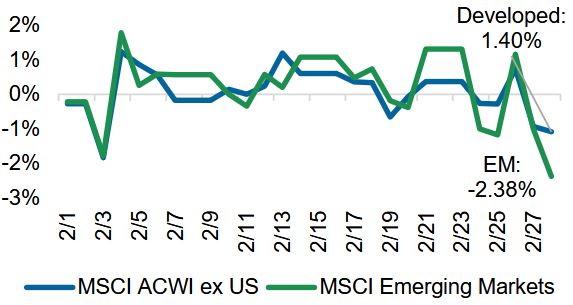
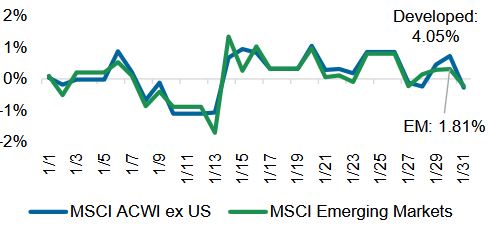
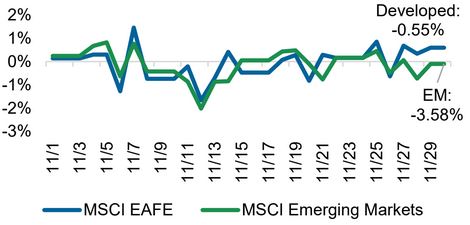
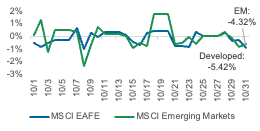
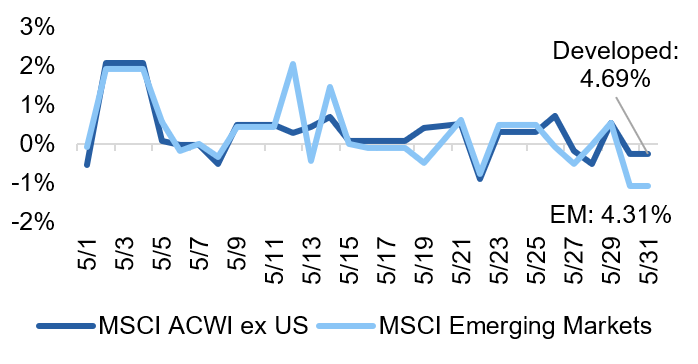
•International Equity Still Looks Strong: International equity markets, both developed and emerging markets, returned over 4% in May despite a retracement in U.S. equities into positive territory.
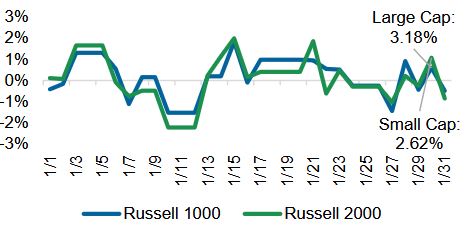
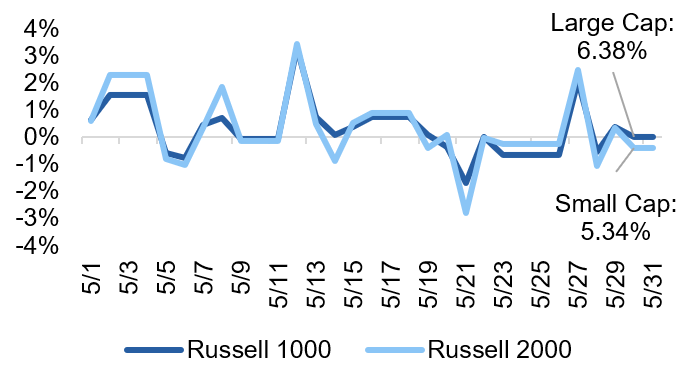
Large vs Small Cap Equity
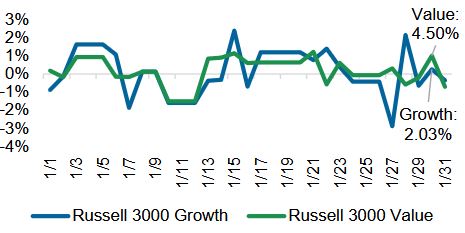
Growth vs Value Equity
Developed vs Emerging Equity
Short vs Long Duration Bonds
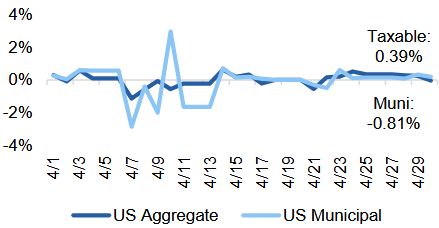
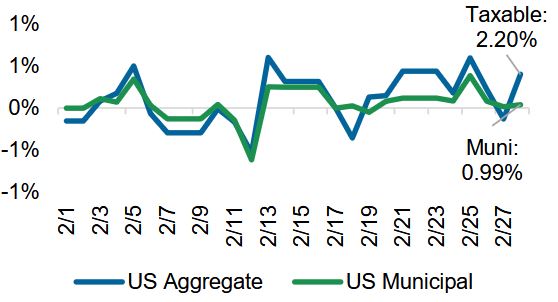
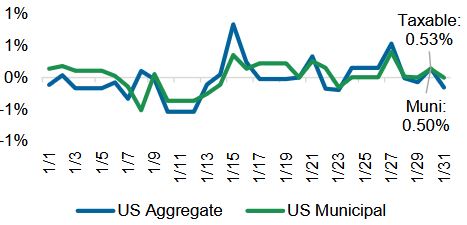
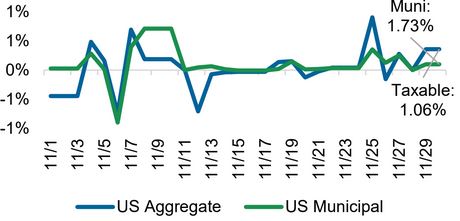
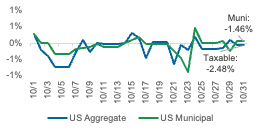
Taxable vs Municipal Bonds
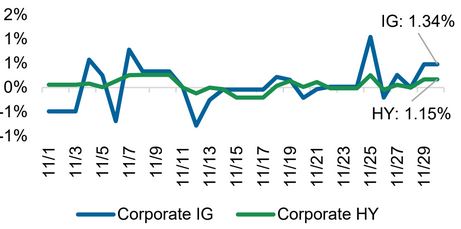
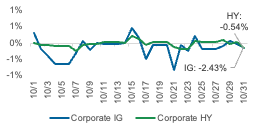
Investment Grade vs High Yield Bonds
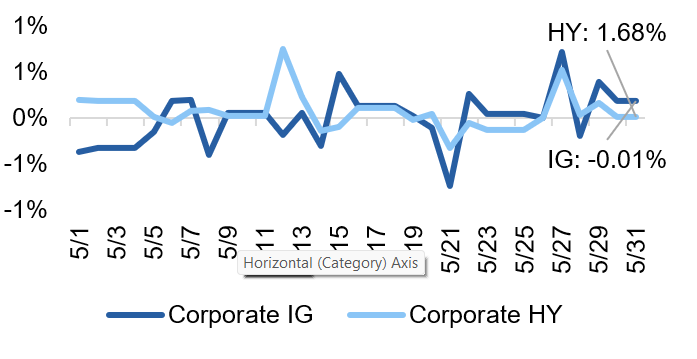
Source: YCharts. Data call-out figures represent total monthly returns.
On Alternatives
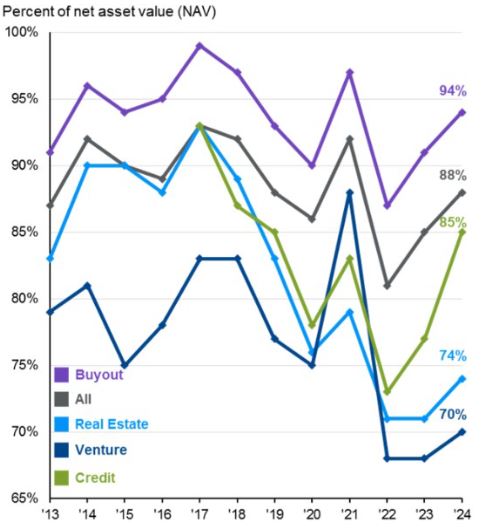
Finding Opportunities Within Private Equity
Coming into 2025, expectations regarding a thaw in the initial public offering (IPO) market were high, which has been roiled by high interest rates and a slow exit environment in recent years. Unfortunately, 2025’s monetary and fiscal policy uncertainty have thus far hampered a broader return in dealmaking activity. M&A activity is largely in-line with activity seen last year and this lack of activity is creating challenges for private equity investors, causing them to seek out other areas of the market that are providing more compelling opportunities or liquidity. One such place is the secondaries market, which witnessed transaction volume growth of 45% from 2023 to 2024, according to Jefferies and illustrated in Exhibit 4 below.
Exhibit 4: Total Secondaries Transaction Volume
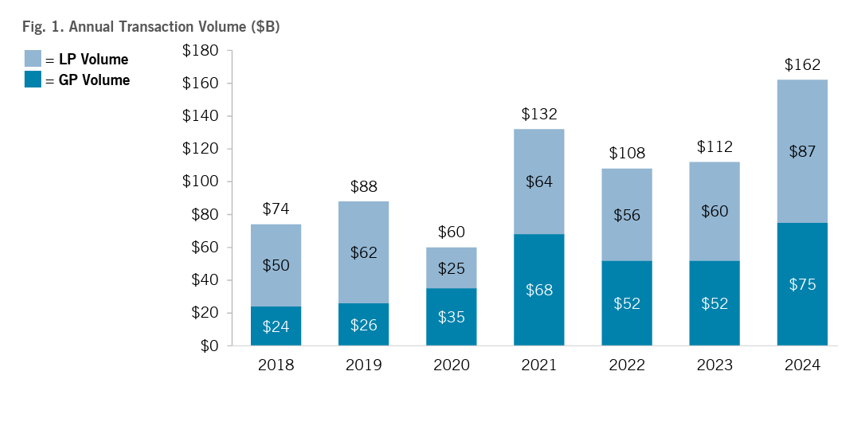
The secondaries market is largely categorized into two buckets: general partner (GP) led and limited partner (LP) led. The difference in these types of transactions lies in who initiates the deal – the GP, or manager of a private equity fund, or the LP, the investor in a private equity fund. In recent months, LP-led secondaries have witnessed a surge in demand, primarily for liquidity reasons, which has pushed prices higher, and subsequently pinched the discount opportunity in the asset class, making relative value opportunities much harder to uncover. The GP-led secondaries sector has also seen increased demand and growth, particularly from traditional buyout private equity sponsors who are grappling with lackluster M&A activity. Part of the interest in GP-led secondaries is related to the increased use of continuation vehicles (CVs). CVs allow the GP to hold onto a portfolio company, typically a better-performing, trophy portfolio company, for a longer period by moving it into a new investment vehicle, the CV. Of the $75 billion in GP-led transactions in 2024, illustrated in Exhibit 5, 84% came from CV transactions.
Exhibit 5: GP-Led Transaction Volume
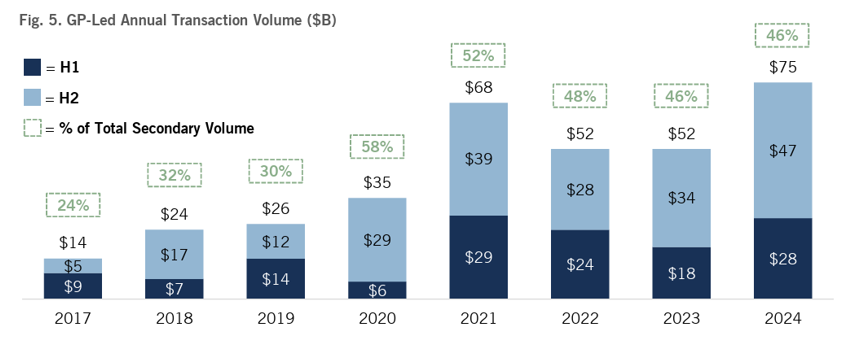
Source: Jefferies
The use of continuation vehicles allows GPs to provide liquidity to LPs in their legacy fund and can also give GPs additional time and capital to nurture a portfolio company, or companies, prior to sale. This can be advantageous if market conditions are less favorable for dealmaking, like what we are experiencing today.
Given the amount of uncertainty related to fiscal and monetary policy, it is largely expected that slow M&A activity will persist in 2025; however, should the Trump Administration turn its attention to de-regulation, this could be the catalyst that dealmakers have been waiting for. On the flip side, if we see greater economic deterioration, or a slowdown, there will likely be an even greater need for liquidity in the asset class, underscoring the need for opportunities within private equity, like what we are seeing in the secondaries market today.
The Bottom Line: M&A activity has remained relatively subdued with a slow exit environment which is not being helped by high interest rates and an uncertain macroeconomic environment, but private equity investors may still find opportunities in the market, as exemplified by recent trends in both LP- and GP-led secondaries.
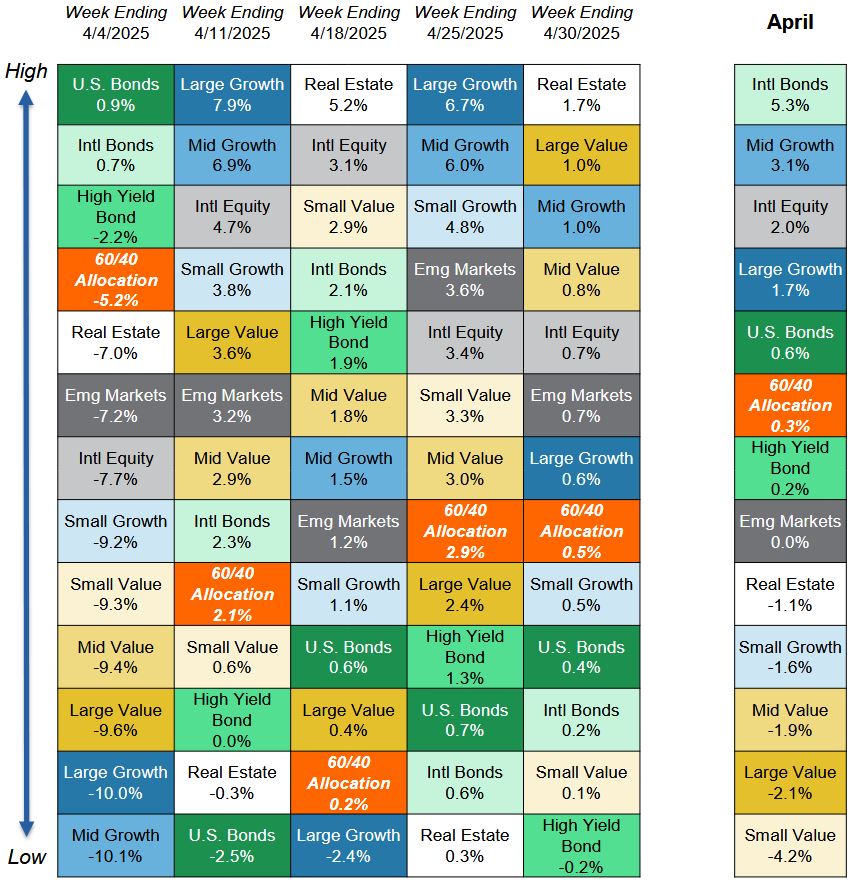
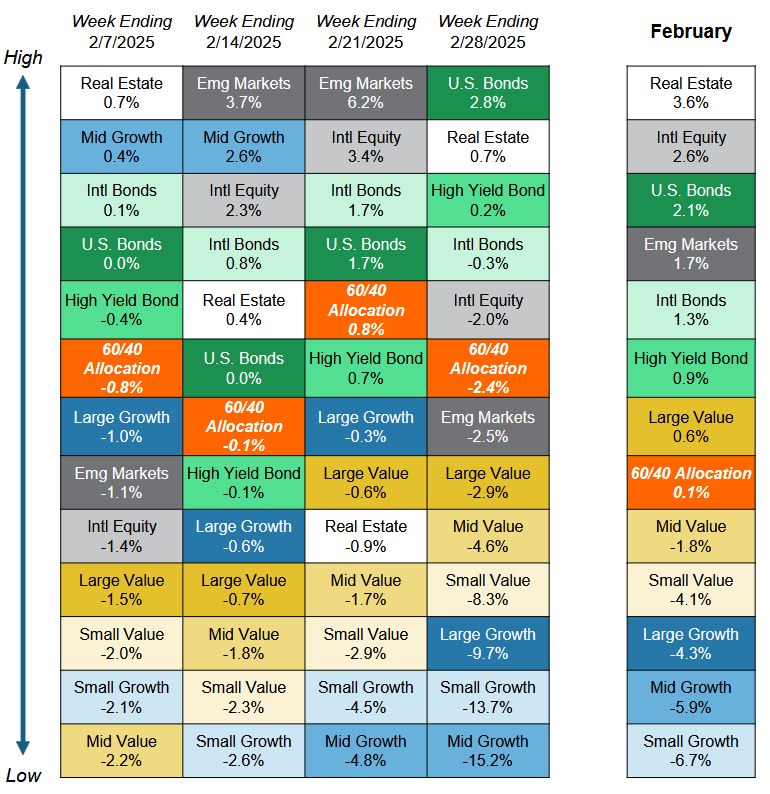
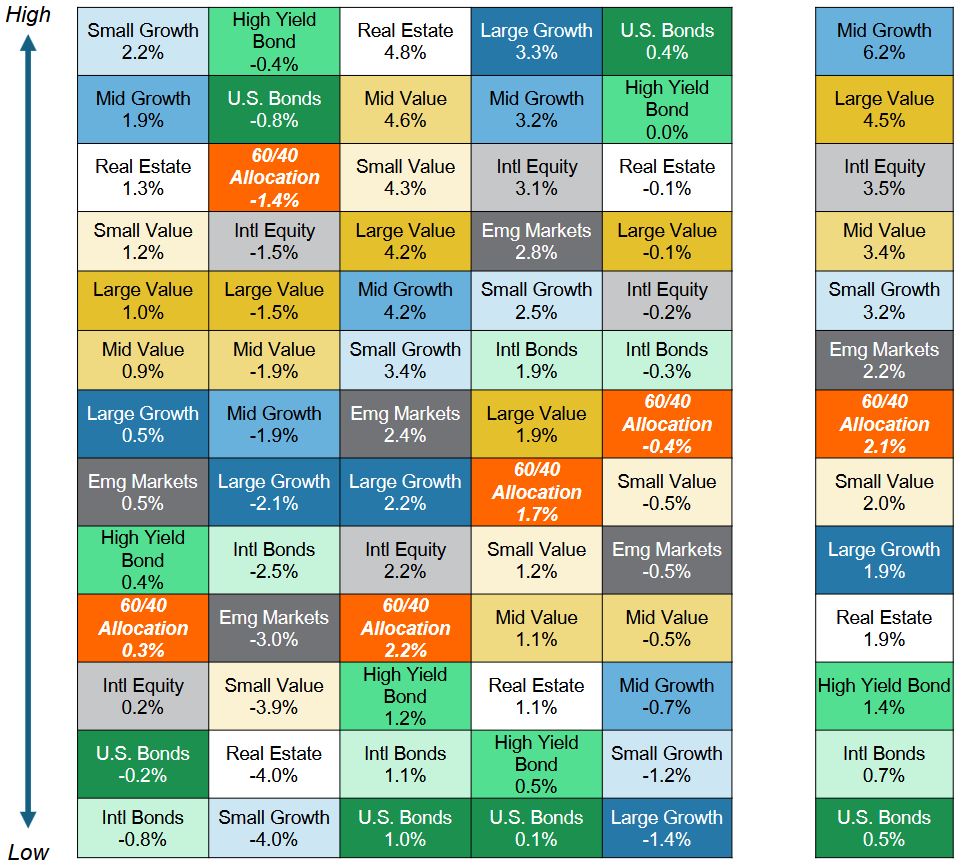
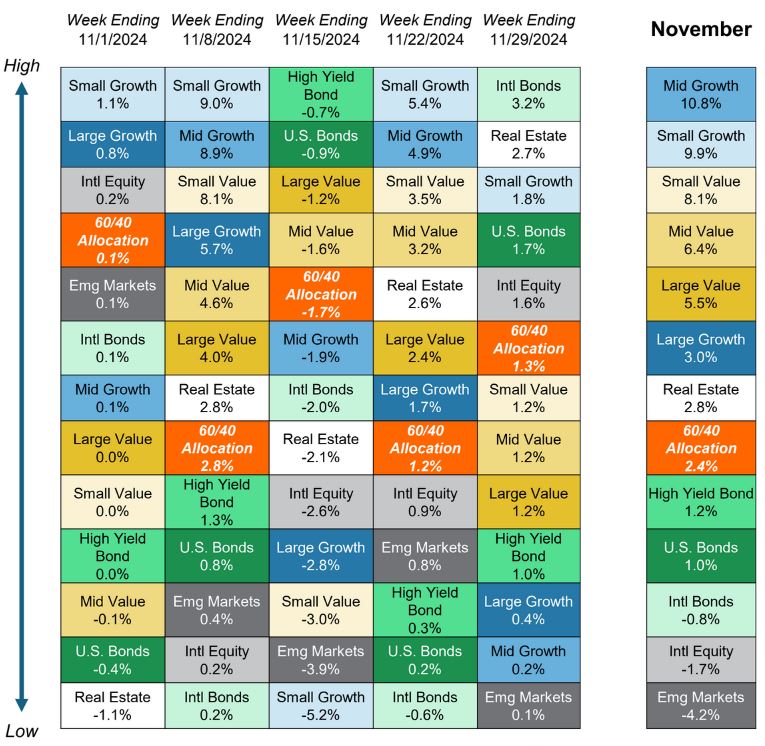
Asset Class Performance Quilt
Markets are ever-changing, making diversification across asset classes and sectors a critical component to portfolio construction. As illustrated below, a Balanced 60/40 portfolio provides greater consistency of returns and less volatility over time.
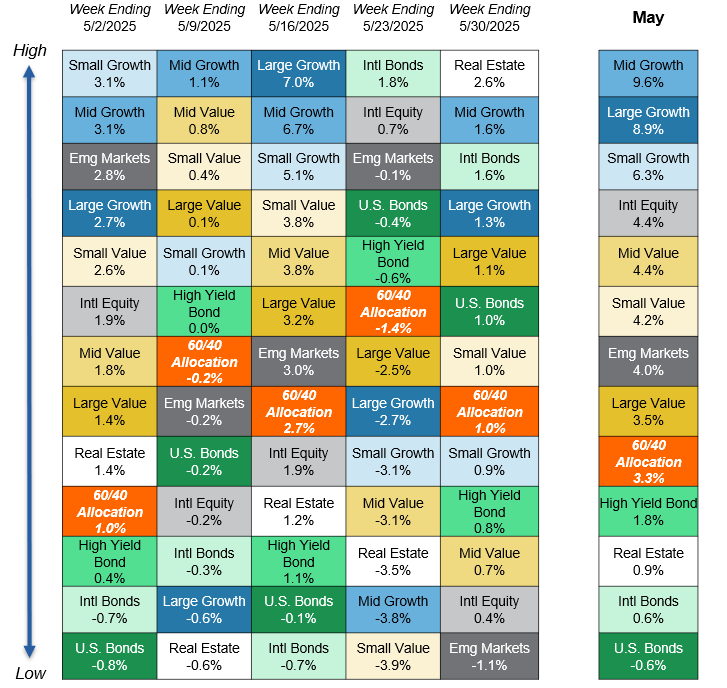
Source: YCharts. Asset class performance is presented using market returns from an exchange-traded fund (ETF) proxy that best represents its respective broad asset class. Returns shown are net of fund fees for and do not necessarily represent performance of specific mutual funds and/or exchange-traded funds recommended by Centura Wealth Advisory. The performance of those funds may be substantially different than the performance of broad asset classes and to proxy ETFs represented here. U.S. Bonds (iShares Core U.S. Aggregate Bond ETF); High Yield Bonds (iShares iBoxx $ High Yield Corp Bond ETF); Intl Bonds (Invesco International Corporate Bond ETF); Large Growth (iShares Russell 1000 Growth ETF); Large Value (iShares Russell 1000 Value ETF); Mid Growth (iShares Russell Mid-Cap Growth ETF); Mid Value (iShares Russell Mid-Cap Value ETF); Small Growth (iShares Russell 2000 Growth ETF); Small Value (iShares Russell 2000 Value ETF); Intl Equity (iShares MSCI ACWI ex US ETF); Emg Markets (iShares MSCI Emerging Markets ETF); and Real Estate (iShares US Real Estate ETF). The return displayed as “60/40 Allocation” is a weighted average of the ETF proxies shown as represented by: 40% U.S. Bonds, 12% International Stock, and 48% Large Blend.