Did you know about 70% of wealthy families lose their wealth by the second generation, and 90% lose it by the third generation?
This is a troubling statistic—which is why, at Centura Wealth Advisory, our goal is to help families explore and implement purposeful strategies and solutions for successful wealth outcomes.
With vast experience working with high-net-worth individuals and families, our team is fully prepared to embrace your family’s complex financial life, circumstances, and strategies. We will help develop the best strategies for you.
Read on to understand why families are losing their wealth so quickly and to learn how to transform your strategy to make your generational wealth last.
Why is Generational Wealth Difficult to Preserve?
As the Chinese proverb says, “The first generation makes the money, the second spends it, and the third sees none of the wealth.”
Typically, in the process of earning wealth, the first generation learns how to:
- Acquire assets
- Optimize investments
- And spend wisely
The second generation, being born into wealth, may forgo the opportunities to learn these skills. Therefore, a common mistake of the second generation is not acquiring assets and investments that:
- Support lifestyle they’re accustomed to
- Can be passed onto the next generation
Consequently, the third generation is left with little remains of the original wealth along with limited financial education and experience.

How Can You Make Your Generational Wealth Last Beyond the Next Generation?
Creating long-term goals, prioritizing financial education, having clear expectations, and communicating clearly are all essential practices in making your generational wealth last.
Identify Your Family’s Purpose
To implement successful strategies, we focus on generational wealth through purpose. This method includes:
- Unpacking your family’s values and dreams
- Helping you define, implement and track your family’s purpose
- Making your family’s purpose the impetus of your wealth
- Significantly lessening the burdens of wealth
Identifying and evaluating your family’s purpose can help lead you to the best strategies for your future. Read on to learn more about finding your North Star and how your purpose can lead to a fulfilling life and valuable goal-setting.
Create Long-Term Goals; Avoid Short-Term Strategies
Avoid responding to daily market conditions, buying the next hot investment product, chasing the latest wealth strategy, or only attempting to preserve your wealth.
At Centura, we instead suggest developing long-term goals that align with your family’s purpose and focus on the growth of existing assets. These goals might include:
- Investing in the stock market
- Investing in real estate
- Building a business to pass down
- Creating a strong retirement plan
We recommend working with one of our trusted advisors to ensure your unique financial situation is progressing towards these goals.
Invest in Financial Education
Financial education is crucial for family members to understand wealth sustainability. Without the proper knowledge and skills, the next generation is likely to deplete the wealth through poor spending habits and a lack of guided investments.
By providing the next generation with financial education, you provide the skills, knowledge, and habits they need to preserve and build their wealth.
This education can range from enrolling family members in relevant courses, teaching them about assets and investments at the office, or even just including them in day-to-day conversations about smart spending.
Provide Clear Expectations and Goals for Your Family
Consider possible goals you may have for your family to ensure their financial stability. Some examples may include:
- Should you require members of your family to commit to their own success?
- Should you ask the next generation to acquire assets and investments to contribute to the wealth of your family?
- Would you like members of your family to build a business to pass down to the next generation?
- Should you insist every member of your family earns a college degree?
These goals can encourage your kin to build their own financial success. Whatever these goals may be, we suggest introducing your expectations early on and in a clear manner.
Prioritize Transparency and Communication
Tell stories of how your family’s wealth was built; include the next generation in current financial conversations. This communication will allow your family to see the difficulties you have overcome to build your wealth as well as the current challenges you still face.
Additionally, your family can learn from your past and current decisions when it becomes their turn to make similar choices.
Healthy family communication is integral to wealth longevity. Consider hiring a family mediator, coach, or therapist to help your family navigate more difficult discussions about money.
Take Advantage of Life Insurance
Life insurance allows you to protect your family in the event of an untimely death. Without your income and resources, the next generation may not be able to maintain generational wealth. By taking advantage of life insurance, you can secure your family’s financial future.
Invest In and Save for Your Children’s Education
Education can give your children the tools and opportunities they need to have successful, independent careers to navigate their own finances.
According to U.S. News and World Report, the average student loan debt has hit a new record high for recent college graduates—exceeding $30,000. If your child graduates college without this debt, they are more likely to begin accumulating their own wealth, become a homeowner, and pass wealth on to the next generation.
Ready to Take These Steps to Ensure Generational Wealth?
With diligent stewardship, care, and attention, a family’s wealth can last for generations. This is what we provide at Centura Wealth Advisory.
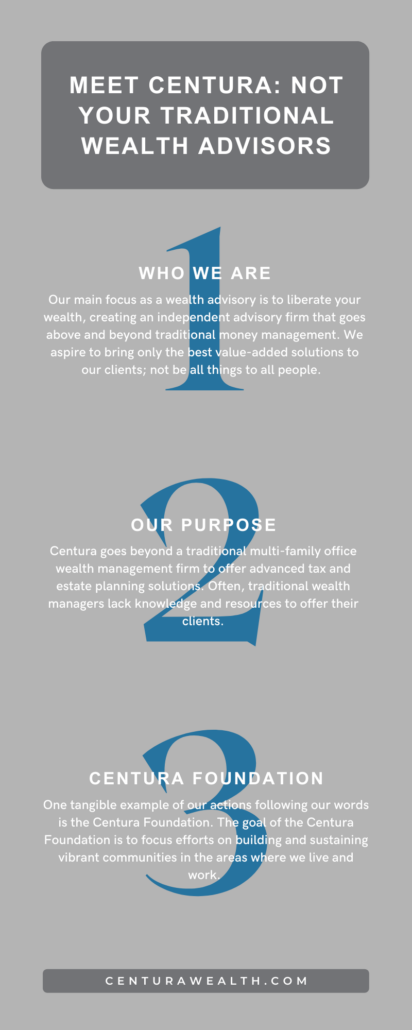
At Centura, our main focus is to liberate your wealth, going above and beyond traditional money management. We aspire to bring only the best value-added solutions to our clients.
Read on to learn more about us and why we are not your traditional wealth advisors.
Centura Wealth does not make any representations as to the accuracy, timeliness, suitability or completeness of any information prepared by any unaffiliated third party, whether linked to or incorporated herein. All such information is provided solely for convenience purposes and all users thereof should be guided accordingly.
We are neither your attorneys nor your accountants and no portion of this material should be interpreted by you as legal, accounting, or tax advice. We recommend that you seek the advice of a qualified attorney and accountant.
For additional information about Centura, please request our disclosure brochure as set forth on Form ADV using the contact information set forth herein, or refer to the Investment Adviser Public Disclosure website (www.adviserinfo.sec.gov). Please read the disclosure statement carefully before you engage our firm for advisory services.