In today’s world, the amount of information an individual has access to is endless. With that being said, it can be challenging to navigate the world of wealth management. With ever-changing market cycles and fluctuations, it’s important to understand your financial goals and how they will guide your portfolio.
How can you sift through all the noise to understand what is best for your financial goals and risk profile? Let’s discuss.
The Role of Emotions in Your Investment Decisions
Understanding the role that emotions play in crafting your wealth profile is one of the first steps in reaching your financial goals.
In an SEC-sponsored research paper, it’s reported that “investors tend to fall into predictable patterns of destructive behavior. In other words, they make the same mistakes repeatedly. Specifically, many investors damage their portfolios by under diversifying; trading frequently; following the herd; favoring the familiar (domestic stocks, company stock, and glamour stocks); selling winning positions and holding onto losing positions (disposition effect); and succumbing to optimism, short-term thinking, and overconfidence (self-attribution bias).”
Knowing this, how can you understand when you may be falling into these predictable, not so profitable, patterns?
It all begins with an understanding of your goals and your risk profile. These two items are the basis for building out a financial portfolio that performs for your needs.
Your Advisor’s Role in Achieving Your Financial Goals
Wealth advisors that thoroughly understand your goals and your risk profile can make a huge difference in navigating your wealth. At Centura, our advisors use the Liberated WealthⓇ Process to guide our client relationships. Our goal is to understand your wealth, identify inefficiencies, design new pathways, and liberate your wealth.
So, what does this process look like?
Uncover
As we mentioned above, it all starts with understanding your risk profile and your financial goals. During this step of the process, Uncover, our team collects data, discusses your purpose and path, and discovers all that we need to know about your current wealth profile. This discovery is a crucial step in the process of understanding how our advisors can help you build sustainable wealth.
Unlock
Following the Uncover step, our advisors Unlock the initial plans, scenarios, and strategies to move forward with your portfolio. From the information that is gathered in the Uncover step, our advisors identify your existing strategy and establish a baseline plan. In this stage, your advisor is looking at the “what if” scenarios associated with your portfolio and using them to guide potential new strategies.
Design
The next step of the Liberated Wealth Process is to actually craft the plan—the Design phase. Your advisor will put together a multi-phase action plan, combined with a wealth scorecard to track your progress.
Liberate
You have now reached the point of implementation. The Liberate step of the process is to implement the plan, coordinate necessary professionals, implement the portfolio, and report on the scorecard.
Steward
Lastly, you get to the Steward step of the process. This step is an ongoing effort of monitoring your plan, reviewing, and recalibrating as needed. The advisor you are working with will help steward you through all of the life events that come your way, whether that is retirement, having a child, starting a business, and the list goes on.
Our goal at Centura Wealth Advisory is to steward our clients toward achieving their financial goals. Want to learn more about why stewardship is at the core of everything we do for our clients? Read on to find out why stewardship is at the core of everything we do.
Estate Tax is a tax on your right to transfer property at your death. When our first article was written, there were very few taxpayers that encountered the Estate Tax because the exemption level was at an all-time high.
Currently, the threshold of estate tax exemption is at $11.7 million at a 40% tax rate. This tax only affects the amount above the $11.7 million thresholds.
The Tax Foundation provides an example of what the future could look like:
“The value of the original asset is $100 million
The value of an asset after $1 million step-up in basis repeal exemption
The Capital gains taxed at ordinary rates 39.6% + 3.8% NIIT = 43.4%
The capital gains tax owed is $42.96 million.
So, then the value of remaining assets in the estate are:
Biden’s estate tax exemption ($11.7 million)
Added to the taxable estate, and estate tax rate (40%)”
Following this example means that with the value of the original asset being $100 million, the total taxes being paid is $61.10 million, with the effective tax rate being 61.1%.
The Proposed Gift and Estate Tax Exemptions
The current proposal includes a reduction from the current $11.7 million (inflation-adjusted for 2021) threshold to a $5 million (inflation-adjusted) threshold proposed to start on January 1, 2022. The 40% estate and gift tax rate did not change, and the changes will not be retroactive if this proposal goes through.
What to do before the proposed tax plan goes into effect
There is a short period of time before any tax changes go into effect. As you begin planning for the next year, think about where you may want to adjust your portfolio to account for these potential changes.
Because the proposed tax plan is not retroactive, any gifts that end before 2021 will not be subject to the updated tax structure. There are also a few things to consider while you plan.
What is a Grantor Trust?
Grantor Trusts are trusts that separate the Grantor and contributor for both estate tax purposes and income tax purposes. The Grantor would be considered the “owner” of the trust for income tax purposes, transactions between trusts, and they are considered “disregarded.” This means that assets sold or exchanged with the trust will not trigger income tax consequences.
However, this Grantor Trust must be established prior to the new plan going into place in order to be grandfathered into the current tax plan.
QRPT, GRATs, and CLATs
The use of life insurance trusts, Grantor Retained Annuity Trusts (GRATs), Qualified Personal Residence Trusts (QPRTs), and Charitable Lead Annuity Trusts (CLATs) may also be affected by this updated tax plan. It’s important to ask your wealth advisor what trust options may be affected by the updated tax plan in 2022, in order to take advantage of the current tax plan while you can.
Will the estate tax changes affect me?
The estate tax of those worth $11.7 million or more (individually or $23.4M jointly) is a federal tax that will affect those taxpayers. Any updates to the federal estate tax will affect all states.
However, some states also charge a state estate tax. The Tax Foundation reports that the states that have an estate tax in 2021 include:
Oregon
Minnesota
Illinois
Maryland
Vermont
Connecticut
New York
Rhode Island
Massachusetts
Maine
Hawaii
Washington, D.C.
As you look to plan for your family’s future be sure to consider the implications of updates to tax plans. Do you have a strong strategy for your family’s future? Get started on your strategy by reading our article, “Generational Wealth: Transform Your Strategy to Make It Last.“
https://centurawealth.com/wp-content/uploads/2024/08/iStock-1268029692.jpg15002000Andre Lawrencehttps://centurawealth.com/wp-content/uploads/2024/07/Centura-Logo-White.pngAndre Lawrence2021-11-21 17:18:002025-04-08 16:16:37Estate Tax: What to Expect from Upcoming Changes
If you’re new to financial planning, it can be difficult to know what questions to start with—even if you’re not new to planning, this is true. Here are five questions to ask your financial planner at your next meeting.
What is Your Wealth Advisory’s Philosophy?
If your personal philosophy aligns with your wealth advisor, chances are it’ll be a successful partnership.
For example, Centura Wealth Advisory believes in Liberating your Wealth® through many different avenues and passions. At the end of the day, finding an advisor that will understand you, and that you trust fully to navigate through the calm and stormy waters is important.
What’s Your Financial Planning Process?
It’s important to know what the plan is with your investments and wealth. Centura Wealth follows the Liberated Wealth Process®, but our process might look different than another advisory. As an example, our process follows these five steps:
Uncover
Holistic discovery by gathering and understanding data; the client’s purpose, path, and professional roster.
Unlock
The next phase is to follow a precise design by analyzing and triangulating existing strategies, establishing a baseline plan, considering “what if” scenarios, and identifying a planning scope.
Design
The design element is a core piece of the Liberated Wealth Process®. The design element includes a multi-phase action plan, a wealth scorecard, and charting new pathways.
Liberate
Understanding purposeful deployment. This includes implementation and advancement with plan implementation, coordinating professionals, portfolio implementation, and scorecard reporting.
Steward
The final step of the Liberated Wealth Process® is to monitor and pivot through purposeful deployment. This includes plan monitoring, timely recalibration, and life events reset.
This is one detailed explanation of what a process can look like to a client. It’s important to understand what the short and long-term goals are for your wealth management, and understanding your advisor’s process is the first step to completing those goals.
What is Your Company Culture Like?
You want to work with people you enjoy and who are going to go the extra mile to manage your wealth. Understanding their company culture can unlock what future meetings and communication will look like.
Centura Wealth likes to highlight creating energy in the workplace, but this is not everyone’s style. Hear from the Centura Wealth team as they provide an inside look at how the company culture looks like, “Seeking the Best: An Inside Look at Centura’s #1 Asset.”
Roby Kotcamp, Senior Wealth Advisor explains the culture. “One of the things that strikes you about Centura from an associate, employee, partner perspective, is that really there’s an embracing of people where they’re at. Real encouragement for people to be their authentic selves is valued.”
This is one example of a company culture that is founded on the goal of encouraging its’ own team and clients.
What is Your Client Retention Rate?
When you’re picking out a restaurant to eat at, where do you look first for input? Past customers write reviews and post photos that you’re likely to sift through before selecting.
Similarly, it can be helpful to ask about their client retention rate to gauge if they have a loyal clientele base.
How Much Will This Cost Me?
It’s important to ask about pricing upfront, so there are no surprise extra fees or costs along the way. Or, does the financial planning firm receive any compensation recommended for investments?
Since your financial planner is working with your money, it should be an initial conversation to avoid any miscommunications.
The terms ‘wealth manager’ and ‘financial advisor’ are often thrown around, but what are their differences? Learn more on our blog post, “Wealth Manager vs. Financial Advisor.”
https://centurawealth.com/wp-content/uploads/2024/08/iStock-1264328238.jpg14142120Andre Lawrencehttps://centurawealth.com/wp-content/uploads/2024/07/Centura-Logo-White.pngAndre Lawrence2021-11-05 17:32:002025-04-08 16:16:36Five Questions to Ask Your Financial Planner
Tim Maurer with Forbes said it best, “Personal finance is more personal than it is finance.”
Financial planning is a big step towards Liberating your Wealth® and will come more naturally if intention plays a role in decision making.
In the basics of journalism, the questions that are used to determine the intent of a story are:
What?
When?
Who?
Where?
Why?
How?
These questions can loosely be applied to financial planning, and are a great guideline to follow when navigating through intention. Are those questions following your goals and intention with your financial planning?
For example, if at one point you wanted to highlight philanthropic efforts as an important foundation for your financial plan, that is one intention that can answer the six journalistic questions.
Liberate your Wealth®
If you’re trying to Liberate your Wealth®, odds are intention is at the forefront of your decision-making. This is great news. If your mind and heart are wanting intentionality to influence your financial planning, then the processes and strategy to do so will become more tangible.
Family Involvement
One example of intention influencing financial planning is succession planning and inheritance. The intention behind financial planning is to set up your family members for success and provide for future generations. Since there is a passion for protecting your loved ones, the intention fuels the fire of financial planning.
It can also be broken down into smaller moments within financial planning. For instance, talking to aging family members about wealth and inheritance can be a difficult conversation. Therefore, the intention must be behind the conversation about financial planning.
Find your Why
Centura Wealth acknowledges that as a wealthy family, you likely carry the burden of your wealth. Because wealth has many complexities and responsibilities, it can be easy to lose intention in the daily tasks of financial planning.
Finding your why is remembering back to when your career (or need for financial planning) started.
What were your passions and goals for your wealth?
Are those still true to your planning efforts now?
If you feel like you have strayed from your original goals, that’s okay. This is why intention does influence financial planning, and your purpose with your intention can always be found again.
Choosing a Financial Advisor or Wealth Manager
Are you confused about the difference between a financial advisor and a wealth manager? Learn about the differences here to help you understand who you’re wanting to partner with. The main difference between the two roles is clientele needs. If you want to hire someone who works with intention, then it’s worth taking the time to find an equal match.
Centura Wealth strives to create energy inside and outside the office. Some of our advisors have embarked on trying new meditation strategies, patterns, and exercises to create energy. Find out how it’s going here, “How Does Centura Wealth Create Energy?”
Do you ever wonder what it’s like to be a part of the Centura Wealth team? Watch the video below to learn more about how Centura works to balance personal and professional life for all of our employees.
As an advisory, we believe in encouraging people to be their authentic selves and motivating them to achieve their North Star, or the legacy they want to leave behind. The North Star is a bearing point in someone’s journey. It embodies our client’s and our employee’s goals, values, and purpose for their life and their wealth.
Tell us about your experience at Centura Wealth Advisory
Derek Myron, Managing Director
“We founded the company in 2014, and I’m one of the original founders. I think that being in financial services, there’s a lot of different models for service. And we saw a need to really add value to the folks that we serve.”
Tigran Muradyan, Associate Advisor
“A friend of mine introduced me to Centura Wealth Advisory. It’s interesting working as a financial wholesaler. I have the opportunity to really visit many different financial advisory offices as a consultant. And you get to see their best practices, their approaches, their ideologies, kind of the dos and the don’ts.
And I could truly say that this is home for me. This is one of the best financial advisory offices in the country that truly takes the care, and a holistic approach to meet high net worth clients’ needs.”
Zoe Singh, Associate Advisor
“My name is Zoe and I am an associate advisor at Centura. And I started here as an intern back in 2017, and I was a student at SDSU, at the time, and I really enjoyed the internship here. It was my first internship, so you could say this was my first real job. And it was a great experience because I really liked everybody here.”
What’s unique about Centura Wealth Advisory?
Dana Levin, Client Relationship Manager, Philanthropic Strategies
“We offer a lot of really unique benefits to working on our team, in terms of comradery, but we also have experts in a variety of different spaces.
We have people who are insurance experts. We have people who are planning experts. I bring the unique value proposition of having somebody specific to philanthropy, which really sets our team apart from your standard RIA.
And we really pride ourselves in being ahead of the game, ahead of the strategy, so that we can really add the most value for our clients. Being part of that team, and gaining new colleagues with the drive to be better will only enhance our impact.”
“What is different about our firm is we live to the values that we set forth in our company, and we make decisions based on those values.
One of the things we bring to our clients is excellence. We try to deliver A-plus work, A-plus service, A-plus solutions, and we take a lot of pride in the work that we do, and we spend a lot of time and effort to get it right.”
Who does Centura Wealth Advisory serve?
Matt Griffith, Senior Wealth Advisor
“We have a variety of clients. I think the type of client that fits well is, some who has experienced a catalyst; there’s something in their life that’s happening, and they’re saying, “Look, we need help figuring out some of this complexity.” And maybe it’s just, “Over time, our income has continued to drift higher. How do we handle and look to mitigate some of the taxes around this higher income?” ”
Who are you looking for to join the team?
Derek Myron, Managing Director
“We’re looking for people who are intellectually curious, who have a thirst for constantly learning new things. In the planning environment, laws constantly change. You have to constantly be talking to centers of influence, who are figuring out new ways to provide value. The types of people that we’re looking for are people that are just not satisfied and are constantly want to learn new things.
And in every relationship, whether it be a client relationship, a center of influence, or an employee, we’re looking to figure out how we can create exponential value. How do you plus me together add up to be more than two? How does it get to be three, or four, or five?”
What is the company culture like at Centura?
Roby Kotcamp, Senior Wealth Advisor
“The culture of Centura is really one of the most impressive things that I’ve seen in some time.
One of the things that strikes you about Centura from an associate, employee, partner perspective, is that really there’s an embracing of people where they’re at. Real encouragement for people to be their authentic selves is valued.”
“Here at Centura, we believe everybody has a north star. I have a north star, all of the employees here have a north star, our clients each have their own north stars. Our job, my role, and our firm’s role is to help people achieve their north star.
And by the north star, I mean, what’s important to you in your life? What is it that you want to accomplish? What is the legacy you want to leave? How do you want people to remember you? And our job is simply to help facilitate that. And oftentimes, we do that in a financial capacity.
Our job is similar to a life coach in helping people understand, “Hey, you can do this, you can achieve that. And here’s the best way to do that.” ”
How has the culture impacted you personally?
Libby Dingfield, Vice President, Growth and Development
“We have an executive coach that the entire company gets to work with. Right now, we’re currently reading a book together, and we meet and discuss how we’re going to implement that into our own lives. It’s not only how we can better ourselves here at work, but how we can grow as individuals and become truly more well-rounded people?
Because anytime you’re going to grow professionally, you have to do the work to grow in your personal life as well.”Hear more directly from the team on their goals, and how implementing them has created energy in the workplace and their personal lives on our blog, “How Does Centura Wealth Create Energy?”
https://centurawealth.com/wp-content/uploads/2024/08/A-Look-Inside-Centura-Wealth-Advisory.png7201280Andre Lawrencehttps://centurawealth.com/wp-content/uploads/2024/07/Centura-Logo-White.pngAndre Lawrence2021-10-22 17:42:002025-04-08 16:22:15Seeking the Best: An Inside Look at Centura’s #1 Asset
Sometimes the emotions of investing can cause quick reactions, following the trends—which isn’t always the most successful.
The Liberated Wealth® Process helps us uncover and solve big and small challenges. Sometimes these are common issues and opportunities for wealthy families, and sometimes they are unique.
Unique opportunities can include emotional investing that can happen with trends and quick reactions. But there are ways to implement room for risk and create a diverse portfolio that can sustain for generations.
Understand The Motivation
The psychology behind quick judgments reveals a lot about human nature.
Just like there are stages of grief, there are emotional stages of trading and wealth. Committing to a snap decision with a high-risk can bring a roller coaster of emotions: excitement, hope, anxiety, fear, panic, and relief (if all goes well). This is true for financial planning in general.
Investor behavior has been the target of many studies because investment (even when unwanted), is powered by emotions. Ask yourself some of the following questions about your potential investment:
Why am I investing?
Does this align with my long-term goals?
Can I pivot my wealth if this fails?
What do I want in life and does this decision support this?
Setting Goals Instead
Implementing long-term goals is always a good idea, especially when you might have a history of pulling the trigger on quick investments that failed. Dollar-cost averaging and diversification are two approaches that investors can implement to make consistent decisions that are not driven by emotion.
Life is About Balance!
At the end of the day, finding a balance of overconfidence and underconfidence might find you not in the sweet spot of the exhilaration of investing, but the confidence of having sustainable wealth.
And better yet, there is a tangible way to measure balance—a diversified portfolio!
Talk to one of our trusted wealth advisors today at Centura Wealth Advisory to learn more about liberating your wealth!
Centura Wealth does not make any representations as to the accuracy, timeliness, suitability or completeness of any information prepared by any unaffiliated third party, whether linked to or incorporated herein. All such information is provided solely for convenience purposes and all users thereof should be guided accordingly.
We are neither your attorneys nor your accountants and no portion of this material should be interpreted by you as legal, accounting, or tax advice. We recommend that you seek the advice of a qualified attorney and accountant.
For additional information about Centura, please request our disclosure brochure as set forth on Form ADV using the contact information set forth herein, or refer to the Investment Adviser Public Disclosure website (www.adviserinfo.sec.gov). Please read the disclosure statement carefully before you engage our firm for advisory services.
https://centurawealth.com/wp-content/uploads/2024/08/iStock-1225117361.jpg14142121Andre Lawrencehttps://centurawealth.com/wp-content/uploads/2024/07/Centura-Logo-White.pngAndre Lawrence2021-09-25 17:54:002025-04-08 16:16:36How to Sustain Wealth in an Ever-Changing Market
Professionals have compared structured notes to the innovative mindset behind mutual funds—with the main draw being zero interest rates. In the past, structured notes were a high-risk, high-return investment that only very wealthy investors could get involved in. Recently, however, the transition to using more technology for investing has opened the door for more individuals and families to invest using structured notes.
Centura Wealth Advisory works with clients to build a diversified portfolio when financial planning, and considering structured notes is a step toward having a more diverse portfolio.
Listen to the recent Live Life Liberated podcast, “Structured Notes Simplified with Robert Sowinski,” for a professional perspective.
What Are Structured Notes?
There are different types of structured notes that can be helpful to understand before investing.
There are a few categories to know for understanding structural notes:
Maturity
Underlying Asset
Protection Amount
Return/Payoff
Structured notes can be compared to a “hybrid security.” They combine the features of various financial products into one. Structured notes combine bonds and additional investments to offer the features of both debt assets and investment assets.
Structured notes aren’t direct investments, but derivatives. They track the value of another product. The amount on a structured note will depend on the issuer repaying the premium and underlying bond.
How do they work?
The basic ways structured notes can be ‘structured’ are the following:
Provide downside market protection
Provide upside (or enhanced) participation
Provide regular payments/income in the form of coupons if certain market conditions are met
Provide a payout/return at maturity if certain market conditions are met
The U.S. Securities and Exchange Commission (SEC) provides more detailed information on structured notes: “Structured notes have a fixed majority and include two components—a bond component and an embedded derivative.”
Financial institutions, as a result, are generally responsible for designing and issuing structured notes, so then the Broker/Dealer can sell them to individual investors.
Potential Risks
It’s important to understand that structured investments will not be a perfect match for all investors based on their risk profile and current portfolio. They are risky as your investments can sit idly without growth
The SEC lists the risks that come with investing in structured notes:
Market Risk
Insurance Price and Note Value
Liquidity
Payoff Structure (which is affected by participation rates, capped maximum returns, and knock-in feature)
Credit Risk
Call Risk
Tax Considerations
Talk to us!
If you’re interested in structured notes and diversifying your portfolio, speak to one of our trusted financial advisors today.
https://centurawealth.com/wp-content/uploads/2024/08/Should-You-Consider-Adding-Structured-Notes-to-Your-Portfolio.jpg14092128Andre Lawrencehttps://centurawealth.com/wp-content/uploads/2024/07/Centura-Logo-White.pngAndre Lawrence2021-09-05 17:57:002025-04-08 16:16:36Should You Consider Adding Structured Notes to Your Portfolio?
Opportunity Zones (O-Zones) are a unique product of the 2017 Tax Cuts and Jobs Act (TCJA). Since being introduced, opportunity zone investments (OZs) have been a hot topic for potential tax planning. So much so, it’s been reported that Qualified Opportunity Funds have raised over $6.7 billion thru December 2019, a number that grew at a rapid pace at the end of 2019 as taxpayers looked for ways to defer capital gains.
When it comes to O-Zone, tax breaks are the headliner, but the actual underlying investment within the Opportunity Zone shouldn’t be overlooked. Questions investors should ask include:
Where am I investing my money?
Are there enough good investment opportunities in this space?
Will the tax benefits be significant enough to outweigh an under-performing investment?
Would the investor be better off just paying the tax and re-investing in an investment of their choosing?
In this blog post, we’re going to dive into Opportunity Zones, which can be a hybrid tax planning and investment solution for those that have recognized a large capital gain. We’ll define the basics of the Opportunity Zones, discuss the tax benefits, compare O-Zones to other types of investments, and explore the characteristics of an investor that might consider an investment in a Qualified Opportunity Zone.
What is an Opportunity Zone?
The Tax Cuts and Jobs Act of 2017 brought about a new type of investment offering, Opportunity Zones, which provide a unique way of mitigating capital gains tax. The Opportunity Zones were created to incentivize investment of capital gains into low income or economically distressed communities. By investing in these communities, taxpayers may be allowed to defer capital gains when investing funds into a Qualified Opportunity Fund (QOF) and meeting other requirements.
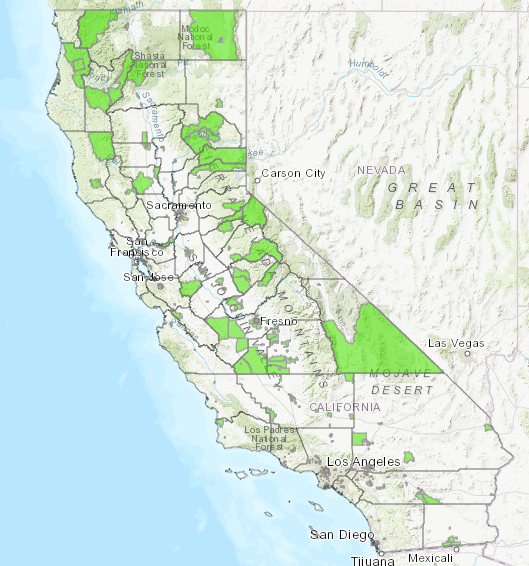
Check out the California Opportunity Zone map here.
What is a Qualified Opportunity Fund (QOF)?
A Qualified Opportunity Fund is an investment vehicle that files either a partnership (Form 1065) or corporation (Form 1120/1120S) federal income tax return and is organized for the purpose of investing in Qualified Opportunity Zone property.
What are the tax benefits of investing in a QOF?
There are three main categories for the tax benefits:
Deferral of a Capital Gain
Step-up in Basis of the deferred gain amount
Tax free gain on new Qualified Opportunity Fund growth
Deferral of Capital Gain
When a capital gain is recognized on the sale of an asset, you have the option to take any part of the capital gain and re-invest the proceeds into a Qualified Opportunity Fund (QOF). If the capital gain proceeds are re-invested into a QOF within 180 days of the gain being recognized, the dollar amount invested will be eligible for deferring the capital gain until the earlier of:
The tax year when the QOF interest is sold
Or December 31, 2026
At that time, the capital gain amount that was initially deferred when proceeds were invested into the QOF, would be recognized (less any step up in basis, see below) and taxes will be paid. The capital gain tax rate will be based on the tax rate applicable during the year the gain is eventually recognized.
Step-Up in Basis
If the investment in the QOF is held for at least 5 years, there is a 10% step-up in the basis of the deferred capital gain. If the QOF investment is held for 7 years, there is an additional 5% step-up in basis of the deferred capital gain (for a total of 15%). For those investing in 2020 and beyond, there will not be a 5% step up since it will be impossible to reach the 7-year holding period by 2026.
Tax free growth
If the interest in a QOF is held for 10 years or more, the post-acquisition gains in the QOF will be excluded on the sale of the QOF interest, thereby completely avoiding capital gains tax on this portion of the gain. There are several tax incentives that could be a big win for the long-term investor. However, taxes alone should never drive an investment decision, so let’s review a few of the primary risks associated with investing in a Qualified Opportunity Fund.
Risks Abound
The TCJA just put Opportunity Zones on the map in 2017, and as recent as December of 2019, the IRS published its final regulations on Opportunity Zones. The Qualified Opportunity Funds are new vehicles and due diligence is paramount. Investors will be facing questions of operator risk, investment risk, and illiquidity risk to name a few.
Operator risk– There won’t be an extended track record for any of the funds or operators. Are they putting the money to work in good opportunities that will net investors a positive return? Are they operating in compliance to meet the requirements of a Qualified Opportunity Fund?
Investment risk– While the Opportunity Zone rules do encourage more than just real estate development, it is likely that a lot of early projects will be in real estate development. Any real estate development project carries its own risks, not to mention that the developments will be located in Opportunity Zones, which by design are designated as an economically distressed area. As such, investing in these areas could carry additional risk(s) and expectation of returns should be scrutinized closely. Depending on the QOF, there could be single property risk if the fund has only invested in one project versus others that plan to invest in multiple projects.
Illiquidity – depending on the fund, the investment could be illiquid. To capture the tax benefits and defer the gain the maximum number of years, you would need liquidity elsewhere. This will be a 10-year investment if you want to hit the tax trifecta (deferred gains, step-up in basis, and future tax-free growth). If holding the QOF investment for ten years, the investor would also need to set aside cash to pay the initial capital gain tax that was deferred and recognized in 2026, so plan accordingly.
Is an Opportunity Zone Investment Worth Consideration?
For comparison, we ran a hypothetical scenario to help evaluate the break-even return required by an investor that has captured a tax benefit from the Opportunity Zone (OZ) investment:
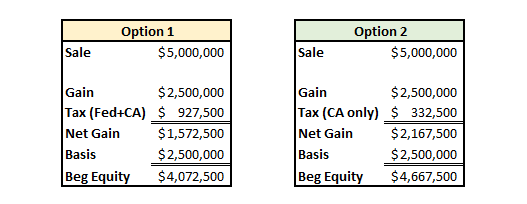
Option 1: Recognize capital gains on an investment, pay tax on those gains for Federal and California (assuming a California tax payer), and reinvest all the net proceeds (gain and basis) into a new investment
Option 2: Recognize capital gains on an investment, pay tax on those gains for California only, and reinvest the net gains in a Qualified Opportunity Fund while putting the basis in a new investment
It’s clear the Opportunity Zone investor has the beginning advantage with more capital to invest in year 1 (Option 2). A larger starting investment can compound at lower rates of return and still arrive at the same future dollar amount over 10 years. But, how much lower can the return be for the tax advantaged investor before the lackluster investment performance wipes out the tax advantages?
The goal here was to find the break-even return required from an Opportunity Zone fund to put the investor on par with just paying the tax and re-investing.
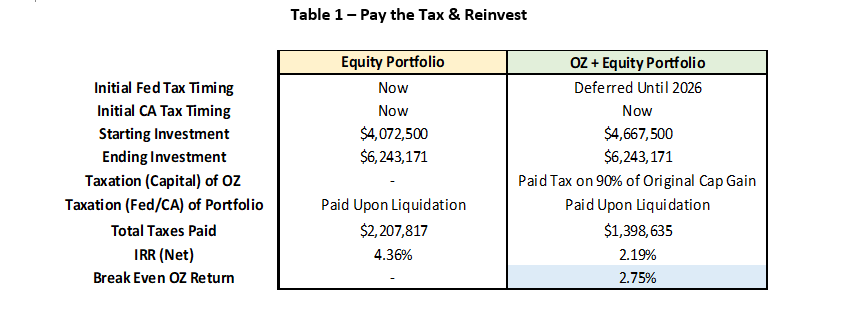
For the first scenario (Table 1), we assumed the investor paid the tax and re-invested the remaining proceeds into an equity portfolio with an expected return of 6.33% (see Capital Market Assumptions Blog). The Opportunity Zone investor invested the gain portion into a QOF and the basis in an equity portfolio. Assumptions are that all investments are liquidated at the end of ten years. The numbers are as follows:
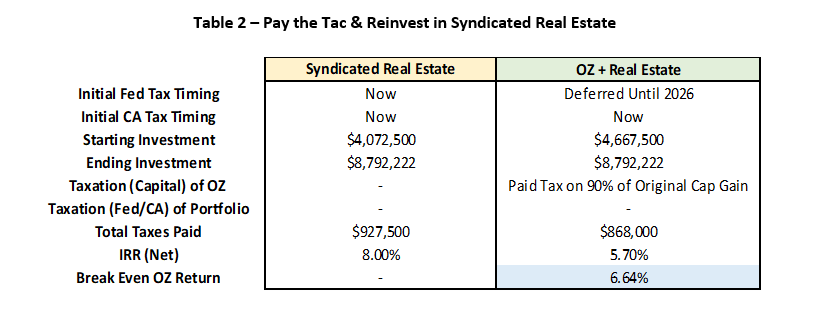
For the second scenario (Table 2), we assumed the investor paid the tax and re-invested the net proceeds into syndicated real estate that is expected to return 8%. The real estate investment has additional tax deferral options at the end of the ten-year holding period. It is still assumed that both options are liquidated at the end of ten years. The breakdown comparison of the options are shown below:
The QOF has merit when compared to paying the taxes and investing in an all equity portfolio. The break-even return required in the QOF of 2.75% (see Table 1) gives the investor a nice cushion provided by the tax savings. However, for accredited investors with the options to place funds within more sophisticated investment vehicles, the results become more convoluted. The QOF investor would require a break-even rate of return at 6.64% which is a much higher hurdle for an Opportunity Zone investment that carries many additional risks outlined earlier.
Conclusion
Let’s summarize where the Opportunity Zone seems to be an optimal solution.
At minimum, it’s an investor that has recognized or will be recognizing a significant capital gain. If the investor:
Has liquidity elsewhere to allow for a 10-year investment horizon in a QOF and liquid assets to pay the deferred tax due in year 2026
Would like to diversify a portion of their portfolio to real estate
Desires to invest money within economically disadvantaged areas for community/social benefits
Based on the comparison we modeled, if the motivation is strictly financial, an accredited investor in California (zero state tax benefits) with access to private syndicated real estate investment opportunities might just consider paying the tax and investing in a lower risk real estate investment. Instead of investing money in projects requiring development, existing properties with current cash flows may be a lower risk option.
Of the tax incentives, the ‘tax free’ growth on a new investment in an Opportunity Zone sounds appealing. However, real estate investments already allow for significant tax efficiency. Real estate investors can defer unrealized gains in future 1031 (IRC Section 1031) exchanges and heirs of real estate property receive a step up in cost basis at death.
In addition, certain types of real estate investments also allow investors to utilize depreciation to shield income from taxation; until exhausted or exchanged into a new property via 1031 exchange.
Given the existing tax efficiency and opportunity to invest outside of economically disadvantaged areas, private syndicated real estate has the potential to outperform a higher risk Opportunity Zone investment in the long run.
If you’ve incurred or will be incurring a significant capital gain and need help evaluating your options, contact Centura Wealth Advisory for a consultation.
Centura Wealth Advisory (“Centura”) is an SEC registered investment adviser located in San Diego, California. This brochure is limited to the dissemination of general information pertaining to Centura’s investment advisory services. Investing involves risk, including risk of loss.
Centura Wealth does not make any representations as to the accuracy, timeliness, suitability or completeness of any information prepared by any unaffiliated third party, whether linked to or incorporated herein. All such information is provided solely for convenience purposes and all users thereof should be guided accordingly.
We are neither your attorneys nor your accountants and no portion of this material should be interpreted by you as legal, accounting or tax advice. We recommend that you seek the advice of a qualified attorney and accountant.
For additional information about Centura, please request our disclosure brochure as set forth on Form ADV using the contact information set forth herein, or refer to the Investment Adviser Public Disclosure web site (www.adviserinfo.sec.gov). Please read the disclosure statement carefully before you engage our firm for advisory services.
https://centurawealth.com/wp-content/uploads/2024/08/AdobeStock_75443283-scaled.jpeg14492560Andre Lawrencehttps://centurawealth.com/wp-content/uploads/2024/07/Centura-Logo-White.pngAndre Lawrence2020-02-07 17:36:002025-04-08 16:16:35O-Zones (Opportunity Zones): Is the Juice Worth the Squeeze?
Given an ever-shifting market, it’s important to stay abreast of asset class expectations and how changes in market levels over time can help drive asset allocation decisions in an investment portfolio. In our first blog series on capital markets, we presented our forward-looking risk and return estimates. In this blog we will check current markets relative to our projections and illustrate how we use risk premiums to garner insights necessary for optimal portfolio recommendations. Keep reading to learn more about risk premiums, what they might mean for your portfolio and why now is a prudent time to take inventory of your asset allocation across your entire balance sheet.
Introduction
Both stock and bond markets are at or near all-time highs but historically these markets have not been correlated like they are today. In fact, the S&P 500 Beta for the Barclays US Aggregate Bond Index is -0.03 which indicates virtually no relationship between the change in price between stocks and bonds and suggests that price correlations will likely diverge at some point in the future. Thus, the question is not whether stocks or bonds will go up or down but whether stocks are cheap relative to bonds; and other assets like real estate. In order to solve this riddle, we can utilize risk premiums in different markets to evaluate which may be over/under valued. This blog post will examine current risk premiums in the stock and bond market(s) to assess relative valuations between the two and garner investment insights.
Risk Premiums – What are they?
Risk premiums represent the price of risk in different markets and investors can use them as a gauge of relative risk. They also reflect fundamental judgement about how much risk we see in an economy/market and what price we attach to that risk. The price of risk influences our asset allocation decisions as well as security selection within each asset class. The following are some (not all) factors that influence risk premiums:
Risk Aversion
Consumption Preferences
Economic Risk
Information
Liquidity and Fund Flows
Catastrophic Risk
Government Policy
Monetary Policy
Behavior
As seen in the list above, risk premiums are complex, and embedded in them is a significant amount of information. Fortunately, risk premiums can be extracted from market data which infers that the considerations above are baked in to prices. Utilizing market data allows investor’s to assess risk premiums relative to their own forward looking views and relative to other markets.
Investment implications
Before diving into the different risk premiums, it is important to lay the foundation for why looking at risk premiums matters. By comparing risk premiums, investors and practitioners can evaluate risk and returns on a relative basis and make investment decisions accordingly. The table below provides an overview of the relationship between different assessments of risk and the related market interpretation and investment action.
Table 1 – Risk Premium Assessments
Too High
Accurate
Too Low
Market Interpretation
Under Valued
Fairly Valued
Over Valued
Investment Action
Buy
Hold
Sell
Equity Risk Premium
The equity risk premium (ERP) represents the price of risk in equity markets and can be inferred as the expected excess return over the risk-free rate. For example, if the risk-free rate is 2% and equity markets are expected to earn 7% then the ERP is 5%. This risk premium is interpreted as the opportunity cost for investing in a market as well as the expectation of what that market will return, on average. Both considerations can be adjusted by volatility (standard deviation) to provide a risk adjusted comparison as well.
In our blog series on capital market projections, we forecasted US Large Cap Equity market returns of 6.33% over 10 years with volatility of 15.58%. If we utilize our current 10-year treasury yield of 1.64% we would derive an estimated ERP of 4.69%. However, in practice there are a variety of methods for utilizing market prices and other data to model and estimate the ERP. At Centura, we calculate the current ERP to be 5.65% which would imply that relative to our 10-year outlook, stocks are currently undervalued at today’s low interest rates and may represent an attractive long-term investment. With the ERP explained, we turn to the RP of debt (bond) markets, also known as Credit Risk Premium.
Credit Risk Premium
When it comes to evaluating the bond market, we typically look to the default spread between a bond and the risk-free alternative (e.g., Corporate bonds vs US treasuries) to estimate the credit risk premium (CRP). Default spreads are the market’s interpretation of credit risk premiums at different maturities, and the tighter spreads get the more overvalued the market becomes (see Table 1). Fortunately, the US Federal Reserve provides default spreads, and for Aaa and Baa corporate bonds relative to 10-year constant maturity treasuries (i.e., risk free rate) the current (as of September 2019) spreads are:
Aaa Corporate Bond Yield vs 10 yr treasury (constant maturity): 1.30%
Baa Corporate Bond Yield vs 10 yr treasury (constant maturity): 2.20%
At Centura, our capital markets projection for US Fixed Income is 3.49%, which versus the current 10-yr treasury yield of 1.64% represents a 10-year projected CRP of 1.85%. This implies that fixed income is priced efficiently with our long-term credit market forecasts.
Stocks vs Bonds
On a relative basis, at a blended CRP of 1.85% vs an ERP of 5.65%, bonds look expensive versus stocks. That said, at Centura we prefer to look at risk adjusted returns when comparing what it takes to earn that extra risk premium. For example, fixed income standard deviation is estimated to be 3.45% which when paired with a blended CRP of 1.85% begets a Sharpe Ratio of 0.54. Equity Market standard deviation is estimated to be 15.58% which when paired with an ERP of 5.65% equals a Sharpe Ratio of 0.36. Thus, on a risk adjusted basis bonds are more attractive than equities. So, what does all this mean?
Conclusion
In summary, at current market levels the equity risk premium (ERP) implies that equities are cheap relative to bonds. The ERP also implies that equities are cheap relative to our forward-looking capital market projections; whereas bonds look more efficiently priced based on our forward estimates. Thus, we are bullish on equities for the long term (i.e., 10+ years). While we are neutral on bonds, we recognize that they provide enhanced risk adjusted returns and can serve a vital role in portfolio management as they help steady returns. Additionally, they allow us to target specific risk/reward mandates.
At Centura, we construct portfolios of stocks, bonds and other alternative assets utilizing risk premiums to assess relative value between asset classes and intra asset class as well. Given the long bull run in risk assets over the past 10+ years, we at Centura feel that this is a prudent time to take inventory of holdings across your entire balance sheet to ensure your asset allocation is in line with your risk tolerance and portfolio objectives. If you self-direct your own portfolio, or are interested in a second opinion on your managed portfolio, contact Centura Wealth Advisory for a complimentary portfolio review.
Disclosures
Centura Wealth Advisory (“Centura”) is an SEC registered investment adviser located in San Diego, California. This brochure is limited to the dissemination of general information pertaining to Centura’s investment advisory services. Investing involves risk, including risk of loss.
Centura Wealth does not make any representations as to the accuracy, timeliness, suitability or completeness of any information prepared by any unaffiliated third party, whether linked to or incorporated herein. All such information is provided solely for convenience purposes and all users thereof should be guided accordingly.
We are neither your attorneys nor your accountants and no portion of this material should be interpreted by you as legal, accounting or tax advice. We recommend that you seek the advice of a qualified attorney and accountant.
For additional information about Centura, please request our disclosure brochure as set forth on Form ADV using the contact information set forth herein, or refer to the Investment Adviser Public Disclosure web site (www.adviserinfo.sec.gov). Please read the disclosure statement carefully before you engage our firm for advisory services.
https://centurawealth.com/wp-content/uploads/2024/08/AdobeStock_139544481-scaled.jpeg12582560Andre Lawrencehttps://centurawealth.com/wp-content/uploads/2024/07/Centura-Logo-White.pngAndre Lawrence2019-09-26 17:30:002025-04-08 16:16:35Risk Premiums and What They Mean for Your Portfolio
Two retirement reform bills (the SECURE Act and RESA) have been circling around Washington, and if passed, may make significant changes to many retirement and estate plans. Notably, the proposed changes outlined in the bill(s) have meaningful implications as the rules on inherited IRA’s are up for debate. Both the House and Senate have different views on the technical aspects of how tax shelters for inherited wealth could be reduced. Read our blog to learn about the differences in proposed changes for “Stretch IRA’s” and what they could mean for tax planning, wealth accumulation and wealth transfer.
Introduction
Retirement savings and tax laws are inextricably linked. For example, IRA’s, 401(k)’s and other tax deferred retirement vehicles have been designed to assist savers in meeting their future income needs so that Social Security is not the sole source of retirement income. While lawmakers have created different ways to save (e.g., traditional IRA vs Roth IRA), the RMD (required minimum distribution) types of accounts that have currently garnered attention from lawmakers are “stretch” IRA’s. This post will examine new bill(s) from both the US House of Representatives and US Senate, as they pertain to stretch IRA’s, evaluating the potential implications from a financial planning perspective (especially taxes).
What is a Stretch IRA?
A stretch IRA is an estate planning strategy that extends the tax-deferred status of an inherited IRA when it is passed to a non-spouse beneficiary. This approach allows for continued tax-deferred growth of an individual retirement account (IRA) and sets limits to the amount that must be withdrawn each year. The goal of this type of strategy is to limit the required distributions on an inherited IRA, stretching them over time, in order to avoid a large tax bill.
The IRS blesses this approach through Required Minimum Distribution (RMD) factors (based on age), which guide how much of an IRA must be withdrawn each year (at a minimum). The RMD amount withdrawn is taxable and therefore represents revenue to the United States government. Thus, while investors seek to extend the period of withdrawal to be as long as possible, lawmakers looking to accelerate tax revenues have honed in on stretch IRA’s.
Proposed Legislation
On March 29, 2019 the House Ways and Means Committee presented HR 1994, also known as the SECURE Act, which eventually passed on May 23, 2019 and is currently awaiting senate approval. SECURE is an acronym for Setting Every Community Up for Retirement Enhancement and represents a bipartisan bill. In the House bill, inherited IRA’s would need to be withdrawn within a 10-year period. Depending upon taxpayer preference, this could be periodically, at regular intervals, or even ballooned on the back end. Taxes will be paid on the distribution(s) when taken and after 10 years the entire IRA balance must be depleted.
Following suit, on April 1, 2019 the Senate introduced a bipartisan bill known as RESA; Retirement Enhancement and Savings Act. The Senate version allows a “stretch” on the first $400,000 of aggregated IRA’s and the exceeding balance must be distributed within 5 years. Taxes would be paid on the distribution(s) when taken.
Both proposed bills cover a wide range of retirement issues, and allow exceptions for distributions to minor children, disabled or chronically ill beneficiaries, or beneficiaries who are not more than 10 years younger than the deceased IRA owner. Both versions would apply to inherited IRA’s for deaths occurring after December 31, 2019 and are applicable to Roth IRA’s as well as traditional IRA’s and Qualified Plans.
Potential Impact
To illustrate the potential impact of this legislation, we will model three scenarios to garner insight into how they compare and what they might mean for a beneficiary. The three scenarios we will model include:
Current Law for stretch-IRA’s
House Bill HR 1994 for stretch-IRA’s
Senate Bill RESA for stretch-IRA’s
The assumptions we use for all three scenarios include a 50-year-old beneficiary with a 30% effective tax rate (federal & state), inheriting a $1,000,000 traditional IRA. For simplicity, we use a flat effective tax rate of 30% to illustrate the effects of legislation on taxation and assume a linear withdrawal rate on non-stretch assets; however, we note that in reality “bracket creep” is likely to occur, absent tax planning.
Bracket creep means that incremental income (e.g., RMD’s) moves you into higher tax brackets and increases the overall taxes that you pay. This would mean that effective tax rates are likely to be higher than 30% when RMD’s are accelerated (ceteris paribus), exacerbating the punitive effect of taxes and increasing the value of tax planning.
Thus, for individuals at or near retirement (and/or in high tax brackets) accelerated RMD’s as proposed by the House and Senate could have detrimental effects on wealth retention, and tax planning strategies should be considered.
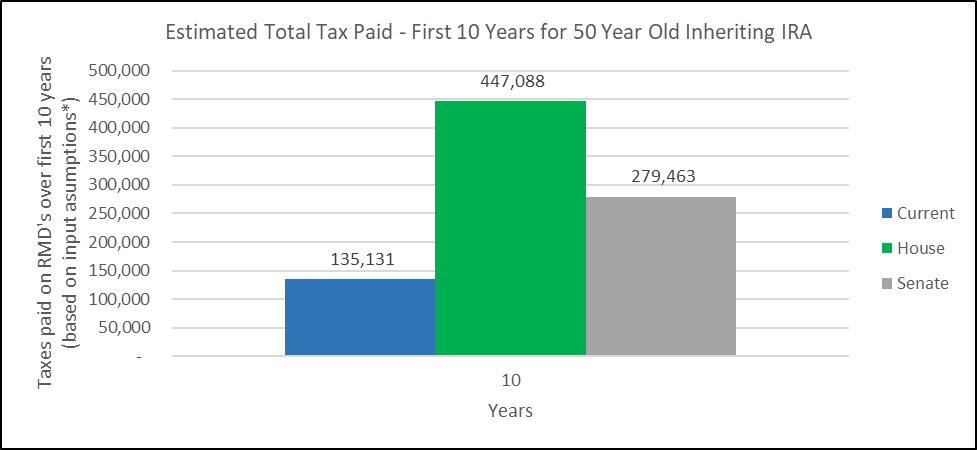
Ignoring the supplemental effects of “bracket creep,” we find that a $1,000,000 portfolio that earns an annualized 8% pays the following taxes over 10 years:
Chart 1 – Estimated Total Tax Paid: Hypothetical Example
Evaluating the results shown above, we find that under the current law a 50-year-old, at a 30% effective tax rate, would pay $135,131 in total taxes over a 10-year period. This compares to $447,088 in total taxes paid over 10 years under the House Bill (HR 1994) and $279,463 under the Senate Bill (RESA). Intuitively these results make sense as the House Bill is asking beneficiaries to deplete entire account balances over 10 years, whereas the Senate Bill only asks that a portion (in this example 60%) is accelerated over 5 years. See summary results in Table 1.
These proposed legislative changes have huge financial planning implications as increased tax burdens are never welcome. At Centura, we specialize in tax and estate planning, designing plans for 10, 20, 30+ year periods so these changes create new opportunities and strategies for us to discuss (and potentially use) with clients.
For example, under these proposals Roth conversions become increasingly valuable as does charitable giving; pairing the two together in the right way can liberate wealth transfer, decrease taxes and fulfill philanthropic goals for your estate. Additionally, permanent life insurance will be more valuable as it can be used to pass death benefits tax free to heirs, mitigating the negative impact of taxation on their inherited assets.
Challenges beget opportunities and we believe this legislation has the potential to make sweeping changes to many estate plans. As such, we are closely following this legislation and diligently working to be ahead of the curve with strategies and solutions to deploy. We encourage clients (and advisors) to follow this proposed legislation, and if passed, contact us to discuss the ramifications and appropriate solutions.
Disclosures
Centura Wealth Advisory (“Centura”) is an SEC registered investment adviser located in San Diego, California. This brochure is limited to the dissemination of general information pertaining to Centura’s investment advisory services. Investing involves risk, including risk of loss.
Centura Wealth does not make any representations as to the accuracy, timeliness, suitability or completeness of any information prepared by any unaffiliated third party, whether linked to or incorporated herein. All such information is provided solely for convenience purposes and all users thereof should be guided accordingly.
We are neither your attorneys nor your accountants and no portion of this material should be interpreted by you as legal, accounting or tax advice. We recommend that you seek the advice of a qualified attorney and accountant.
For additional information about Centura, please request our disclosure brochure as set forth on Form ADV using the contact information set forth herein, or refer to the Investment Adviser Public Disclosure web site (www.adviserinfo.sec.gov). Please read the disclosure statement carefully before you engage our firm for advisory services.
https://centurawealth.com/wp-content/uploads/2024/08/AdobeStock_164050571-scaled.jpeg17072560Andre Lawrencehttps://centurawealth.com/wp-content/uploads/2024/07/Centura-Logo-White.pngAndre Lawrence2019-08-16 17:24:002025-04-08 16:16:35Stretch IRA – What Proposed Legislation Could Do to Your Wealth Transfer Plans