The second quarter of 2025 marked a period of pronounced market volatility, characterized by sharp fluctuations across global financial markets. Investors navigated a complex landscape dominated by trade policy uncertainties, geopolitical tensions, and mixed economic data.
Despite significant headwinds, markets demonstrated remarkable resilience, with the S&P 500 concluding the quarter positively after experiencing dramatic swings in response to evolving trade dynamics. The quarter was defined by President Trump’s aggressive tariff policy, ongoing international conflicts, and mounting concerns about economic growth prospects amid rising inflation expectations. Central banks, particularly the Federal Reserve, maintained their cautious stance as they weighed the competing risks of inflation and an economic slowdown. This quarter witnessed several pivotal events that shaped investor sentiment and market direction, ultimately testing market participants’ resolve amid heightened uncertainty, including:
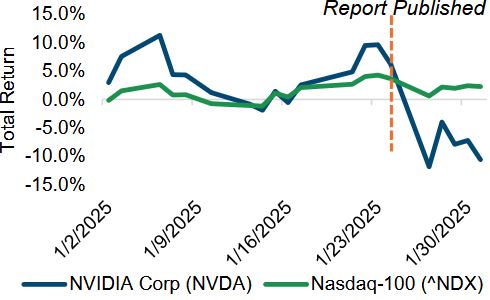
- The S&P 500 and Nasdaq-100 soared towards new record highs, boosted by Nvidia, which reclaimed most valuable company status by market cap and reignited the AI trade. Notching nine straight days of gains – the longest streak since 2004 – the S&P 500 index closed the quarter just shy of new all-time highs.
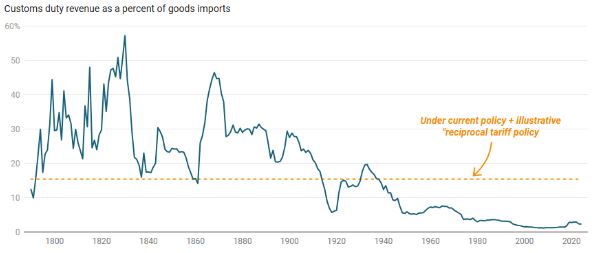
- Trump’s Tariff Announcements: On April 2, 2025, in what became known as “Liberation Day,” President Trump announced sweeping reciprocal tariffs affecting major trading partners. This announcement included a 10% baseline tariff on most countries and significantly higher duties on specific nations, with China facing tariffs exceeding 100%. The immediate market reaction was severe, with the S&P 500 plummeting 4.8% and the Nasdaq-100 falling 5.4%, erasing approximately $3 trillion in market value. However, on April 9, President Trump authorized a 90-day pause on many tariffs while maintaining higher rates on China, sparking a historic market rally with the Nasdaq gaining 12% in a single day.
- US-Iran Geopolitical Tensions: The quarter witnessed a significant escalation in Middle Eastern tensions leading to US strikes on Iranian nuclear facilities. Market concerns about potential disruptions to global oil supplies drove crude prices higher initially, but they subsequently tumbled after President Trump announced a ceasefire between Israel and Iran on June 23. West Texas Intermediate crude plunged nearly 15% over two sessions to settle around $64 per barrel. The temporary resolution alleviated immediate concerns about energy supply disruptions, allowing markets to refocus on domestic economic issues.
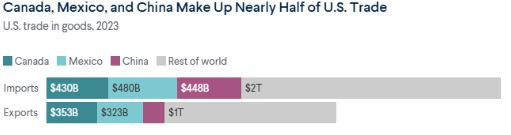
- US-China Trade Negotiations: Throughout the quarter, evolving US-China trade dynamics continued influencing market sentiment. Following the initial tariff announcements, which elevated duties on Chinese imports to 125%, both countries engaged in retaliatory measures. By June, negotiations showed signs of progress, with Commerce Secretary Howard Lutnick announcing that China would “deliver rare earths to us” as part of an agreement signed in late June. Currency markets reflected the changing dynamics, with the Chinese yuan experiencing significant volatility as markets assessed the implications of trade tensions on global growth prospects.
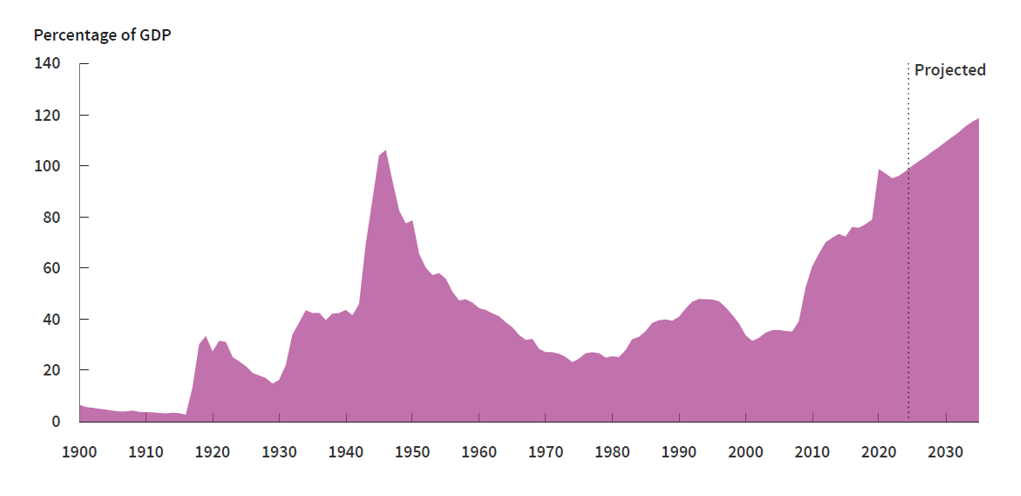
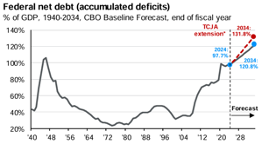
- Moody’s US Credit Rating Downgrade: On May 16, Moody’s downgraded the United States’ credit rating from Aaa to Aa1, citing the nation’s inability to address growing deficits. This historic development meant that for the first time, all three major credit rating agencies had downgraded US debt below their top rating. Moody’s highlighted concerns about growing federal interest payments driven by elevated interest rates and substantial debt accumulation through increased federal spending and reduced tax revenues, estimating that interest payments would exceed $1.8 trillion annually by 2035.
- Consumer Spending Decline: May’s Personal Consumption Expenditures (PCE) report, released on June 27, showed consumer spending declining 0.3% after adjusting for inflation, the largest drop since early 2025. This worrying development indicated that elevated uncertainty surrounding the administration’s economic policies is increasingly weighing on household expenditures. The drop occurred despite a 0.4% increase in wages, suggesting growing consumer caution amid economic uncertainty.
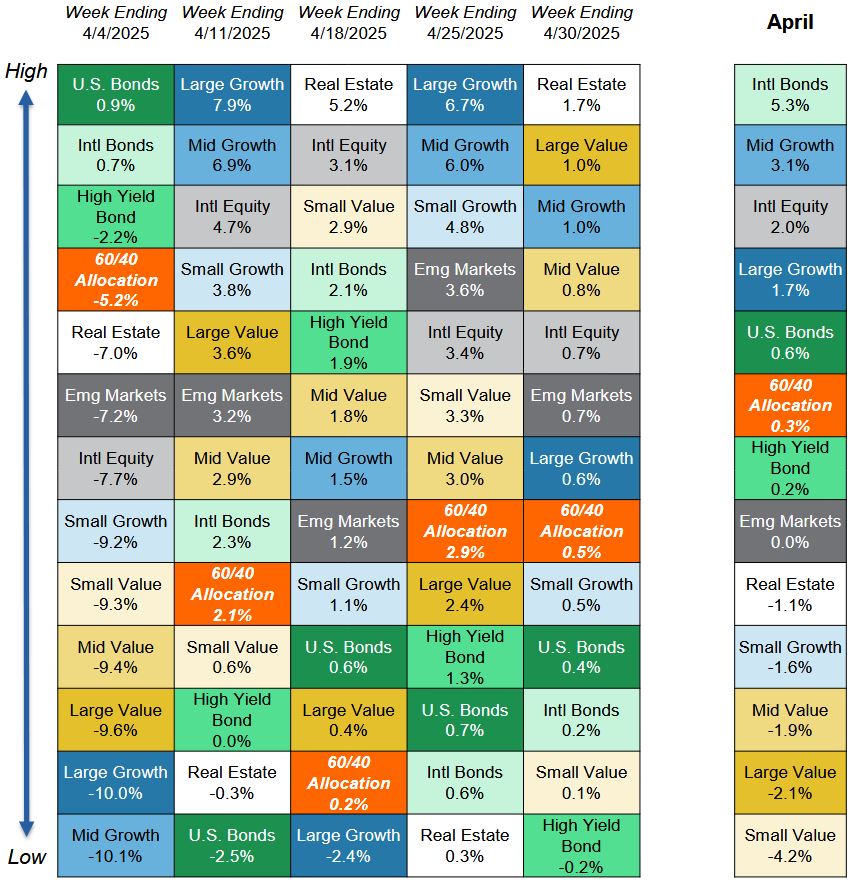
Market Recap: Is US Exceptionalism a thing of the past?
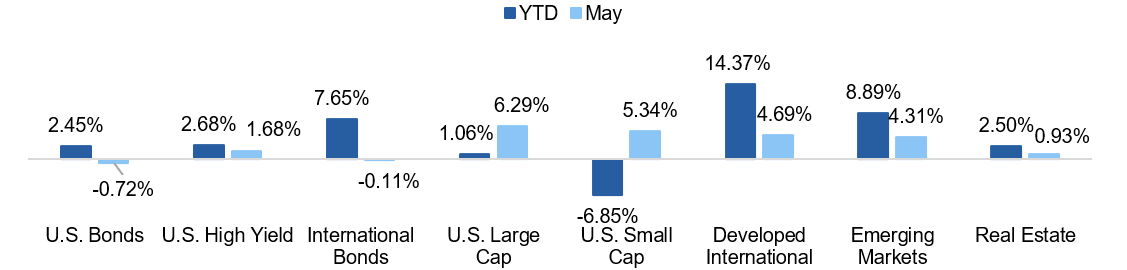
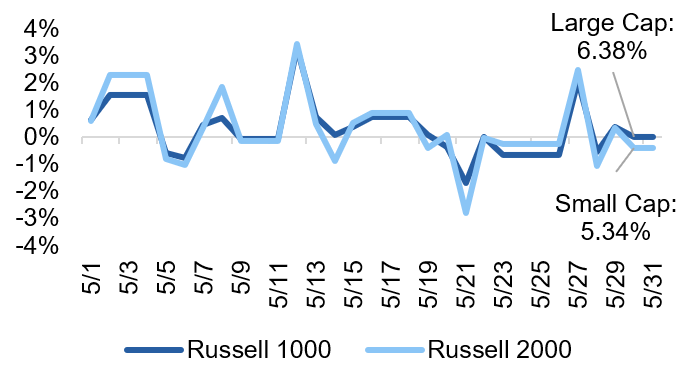
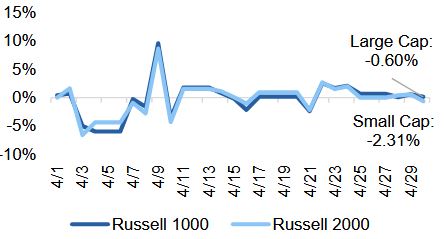
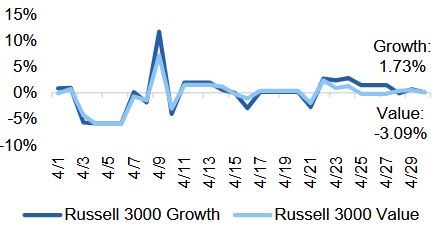
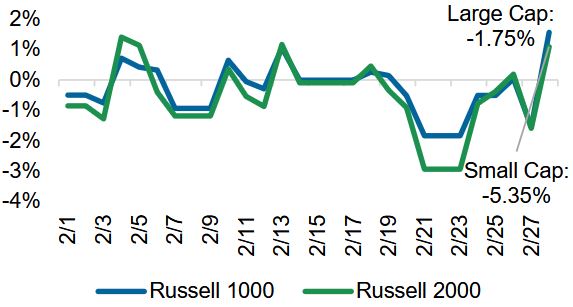
Equities – The quarter presented a tale of two markets, with extreme volatility giving way to a remarkable recovery. After April’s tariff announcements triggered one of the worst market days since the pandemic, equities staged an impressive comeback. The S&P 500 concluded the quarter with a gain of 6.2% for the year, and approximately 8% from its April lows, surpassing the 6,200 milestone by quarter-end—its best quarterly performance since December 2023. The Nasdaq Composite exhibited even stronger performance, erasing all of its losses since “Liberation Day” and setting new record highs by late June.
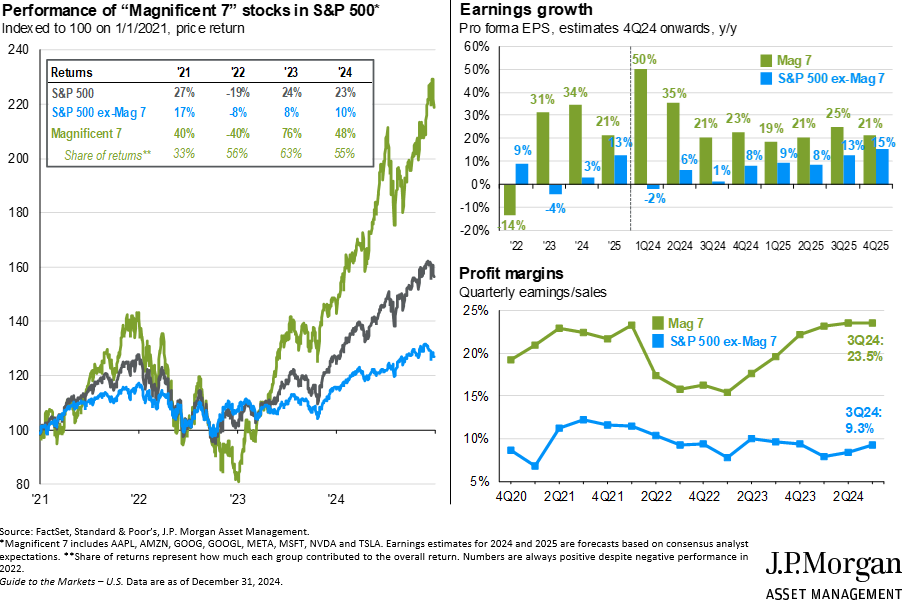
Technology stocks demonstrated remarkable resilience throughout the quarter’s turbulence. After initially bearing the brunt of the sell-off, the sector staged an impressive recovery, with the Magnificent Seven tech stocks gaining over $1.8 trillion in market value during a single day following Trump’s tariff pause announcement on April 9. Nvidia led the charge with a 19% gain and a $440 billion market value increase in that session alone. By quarter-end, tech stocks had reasserted their market leadership, though concerns about supply chain disruptions and potential Chinese retaliation remained.
Manufacturing sectors most exposed to tariffs, including automobiles and consumer goods, faced significant uncertainties. Ford and General Motors both pulled their full-year outlooks during the quarter, citing unpredictable tariff impacts on their supply chains and cost structures. Meanwhile, import-dependent retailers struggled to manage inventory amid rapidly changing trade policies.
Commodity markets were dominated by oil’s dramatic movements. WTI crude prices plummeted to approximately $64 per barrel by quarter-end, levels not seen in four years, primarily influenced by geopolitical developments and concerns about global demand. Gold, meanwhile, continued its ascent, reaching $3,308 per ounce—benefiting from its status as a haven amid heightened uncertainty and a weakening dollar.
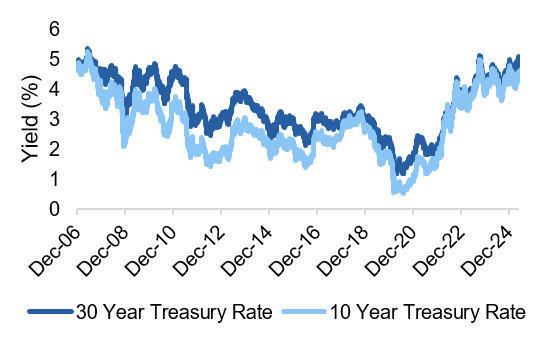
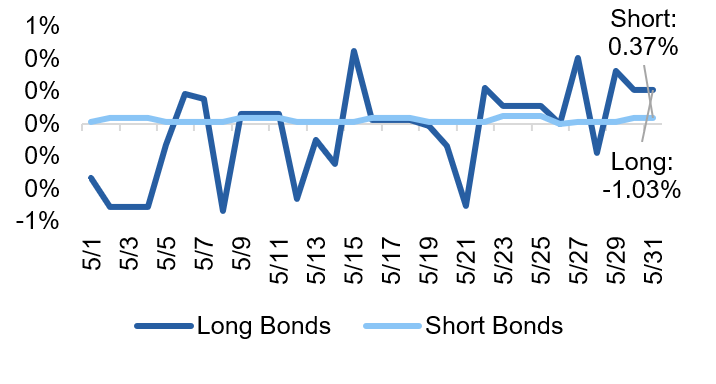
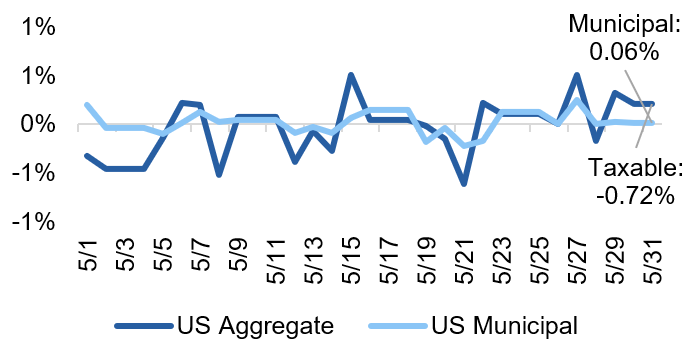
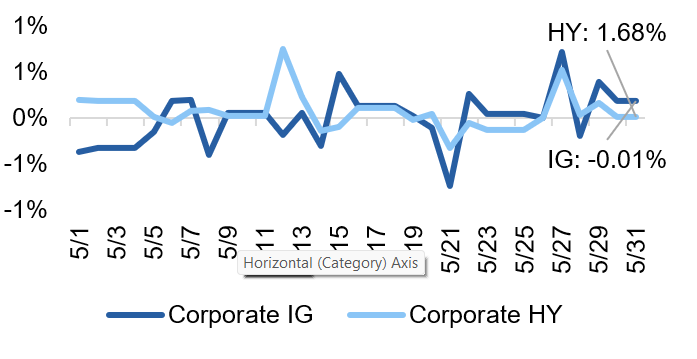
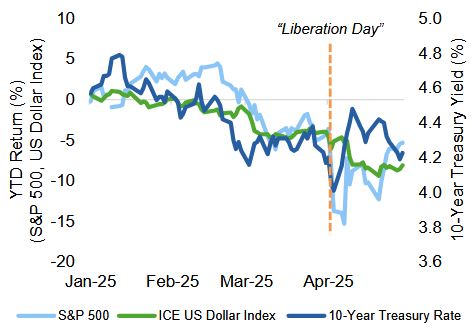
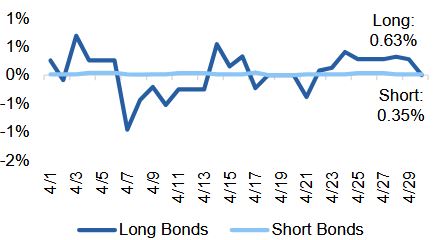
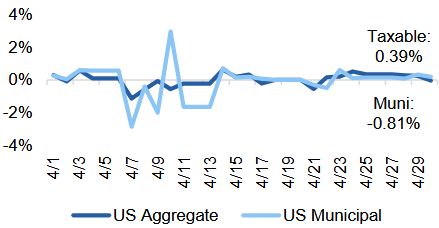
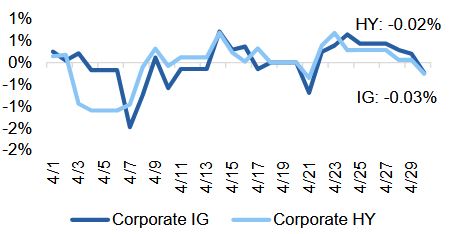
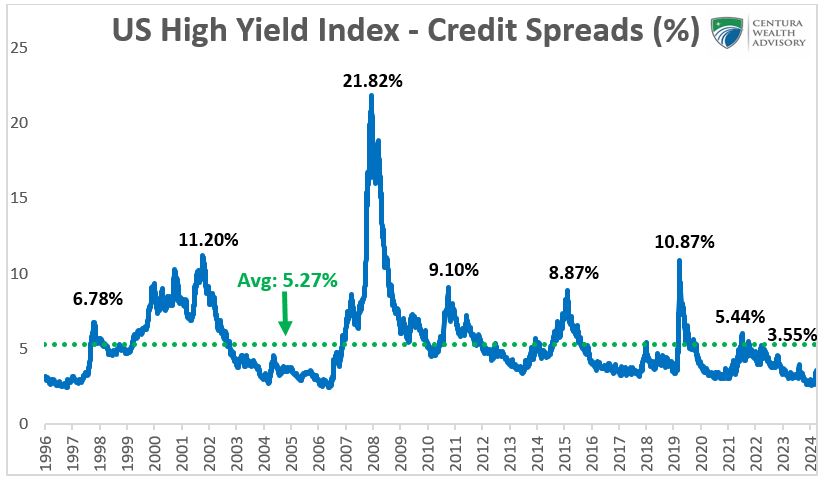
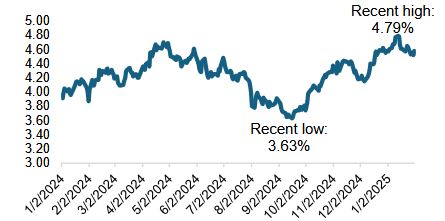
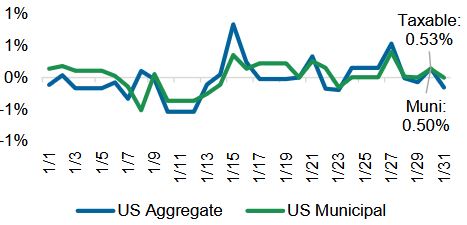
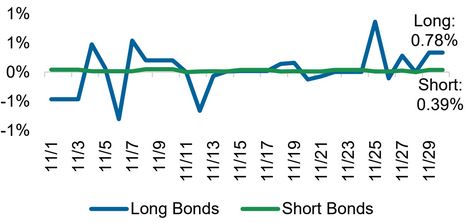
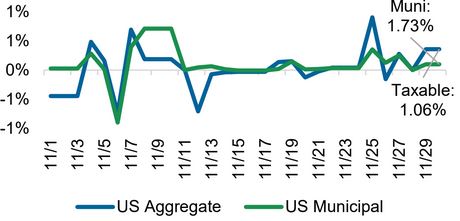
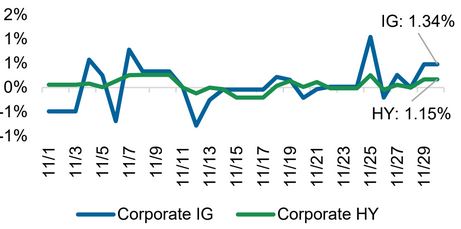
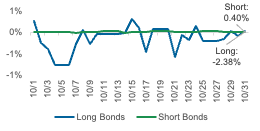
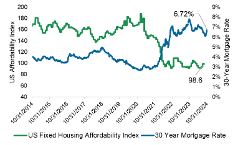
Bonds – Bond markets experienced significant fluctuations throughout the quarter. The yield on the 10-year Treasury briefly surged above 4.47% in early April amid fears about tariff-induced inflation and concerns about foreign investors potentially reducing their Treasury holdings. However, as recession fears mounted and the Federal Reserve maintained its cautious stance, yields retreated, with the 10-year ending the quarter at approximately 4.29%—representing the best first-half performance for Treasuries in five years.
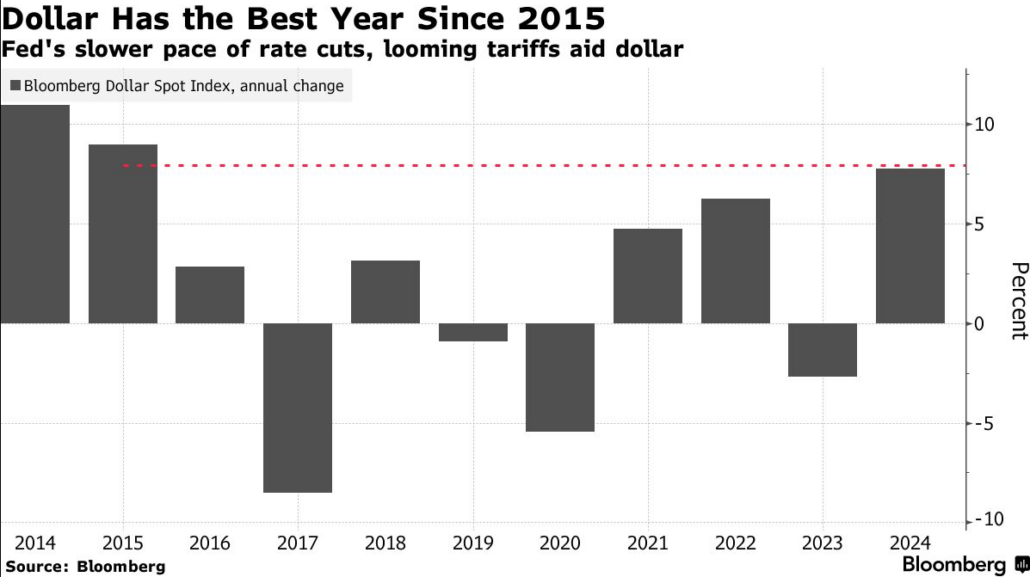
Currencies – The US dollar experienced substantial weakness, recording its longest monthly decline since 2017. The Bloomberg Dollar Spot Index tumbled as much as 2.1% in a single day in early April—its sharpest intraday decline since its launch in 2005. This decline reflected shifting global capital flows as investors reassessed America’s economic prospects amid trade uncertainties and fiscal challenges.
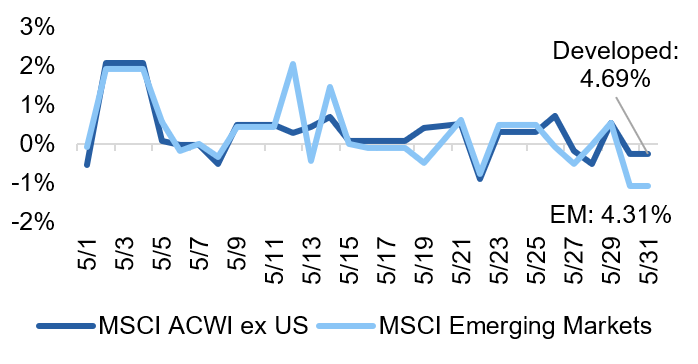
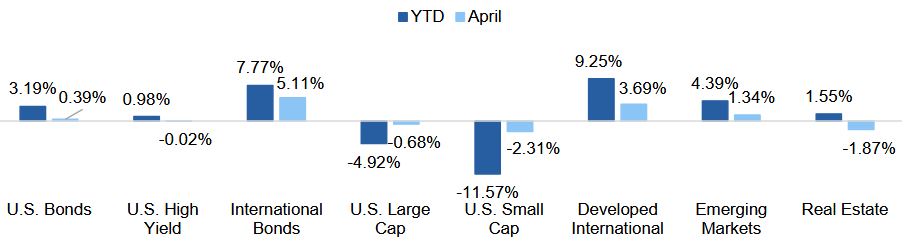
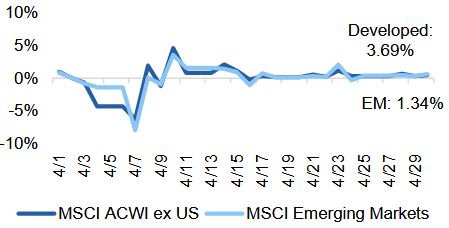
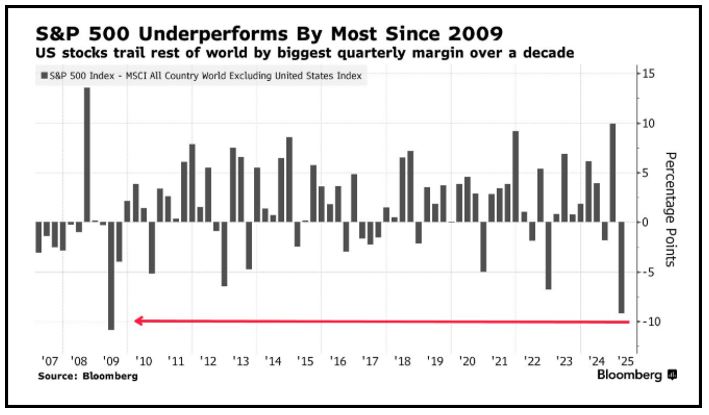
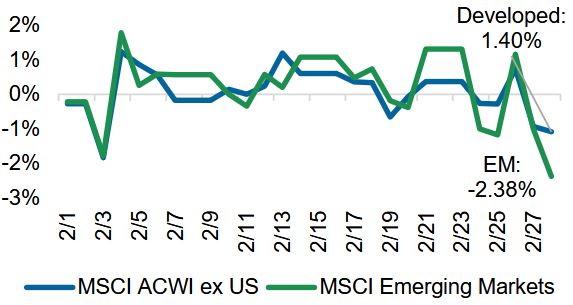
Emerging market local-currency bonds continued to capture investor attention, underpinned by a weakening US dollar and growing expectations for interest rate cuts in developing countries. This trend highlights the challenges facing US exceptionalism—a belief in the United States’ unparalleled economic prowess—amid ongoing fiscal and trade policy uncertainties. The disappointing GDP figures, combined with the downgrade of the US credit rating by Moody’s, signal potential vulnerabilities that could undermine the perception of the US as an economic safe haven. Such shifts are prompting some investors to seek opportunities elsewhere, as demonstrated by the stronger performance of non-dollar assets like local-currency bonds in emerging markets. As the third quarter unfolds, the questions surrounding US economic leadership will persist, particularly in light of mounting fiscal pressures and the global appetite for diversification away from traditionally dollar-denominated investments.
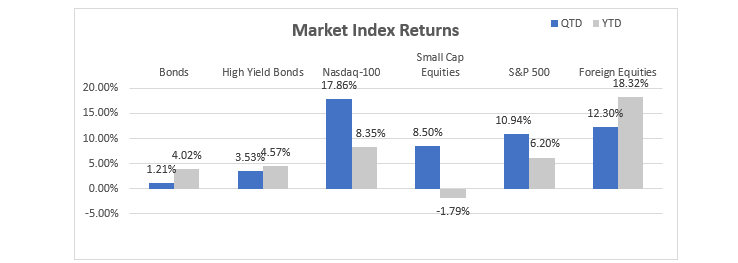
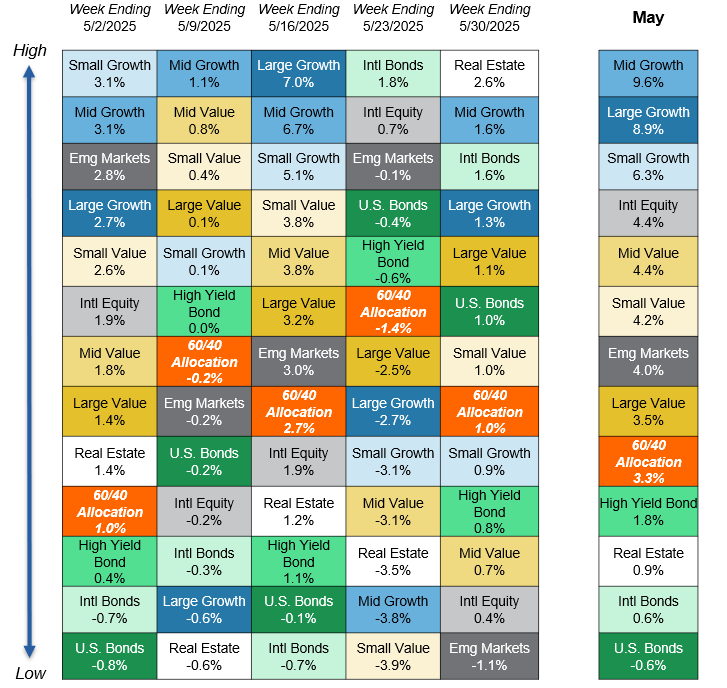
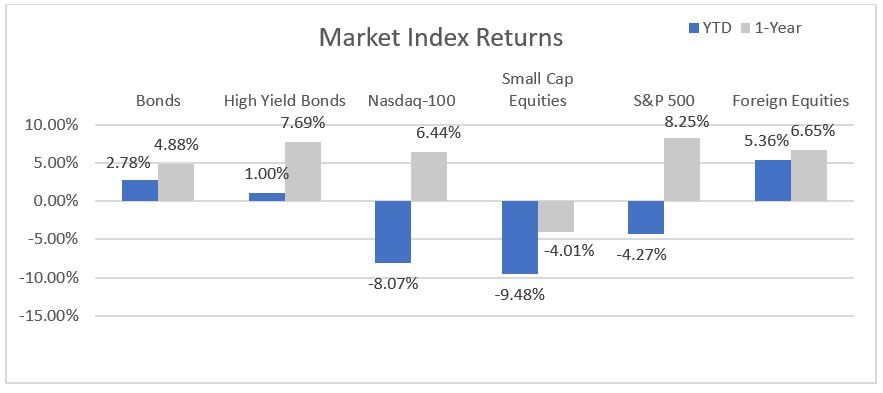
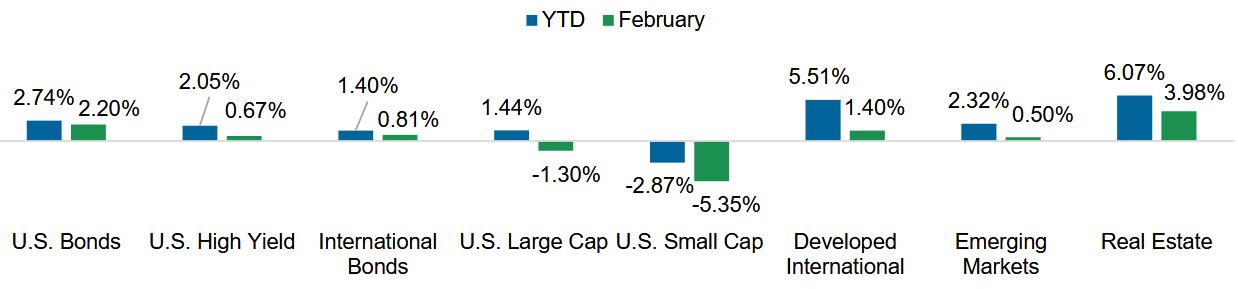
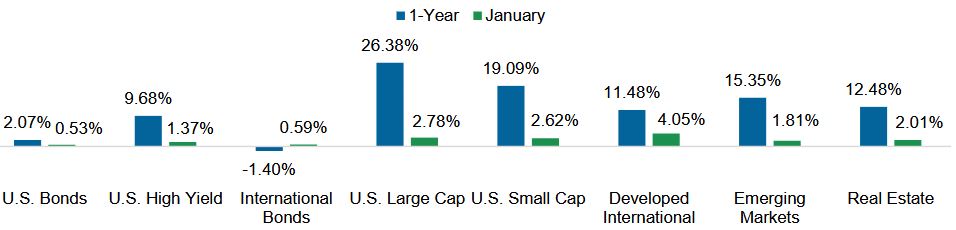
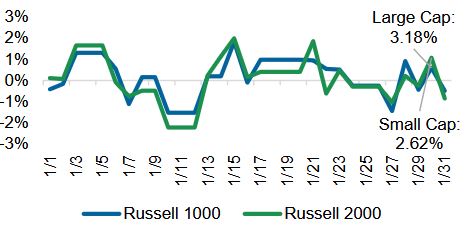
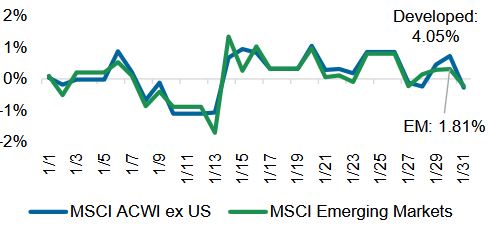
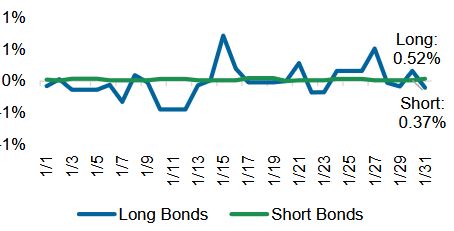
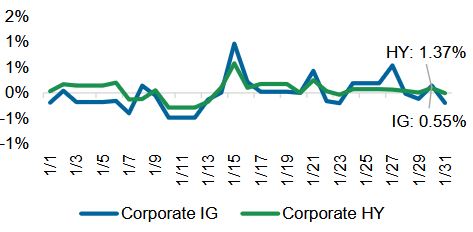
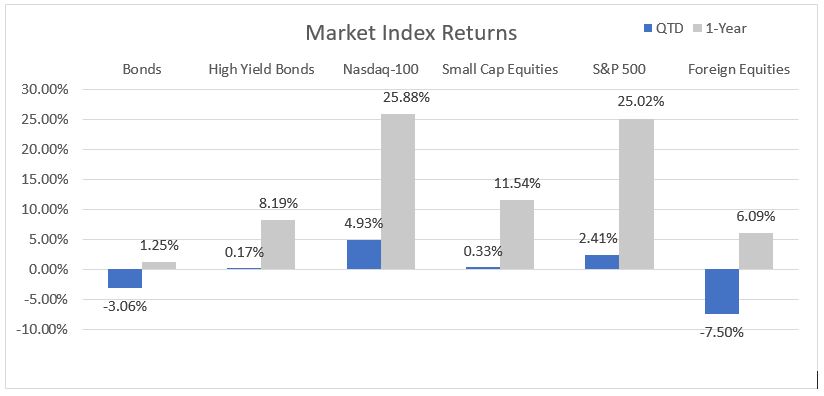
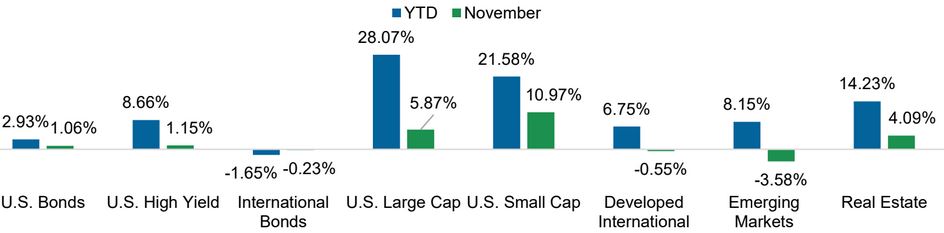
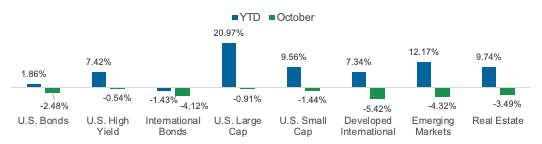
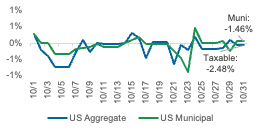
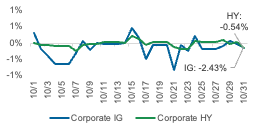
Source:YCharts. The Bloomberg US Aggregate Index was used as a proxy for Bonds; the Bloomberg US High Yield 2% Issuer Capped Index was used as a proxy for High Yield Bonds; the Russell 2000 Index was used as a proxy for Small Cap Equities; and the MSCI ACWI EX USA Index was used as a proxy for Foreign Equities. All returns are based on total return levels as of 6/30/2025.
Economy
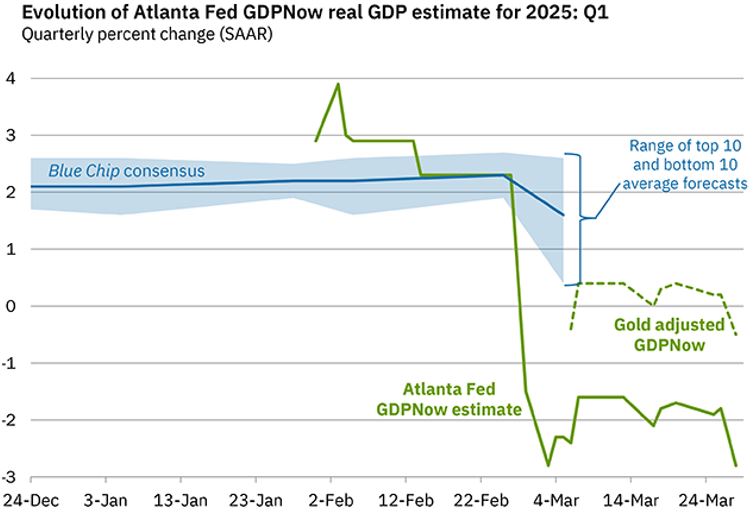
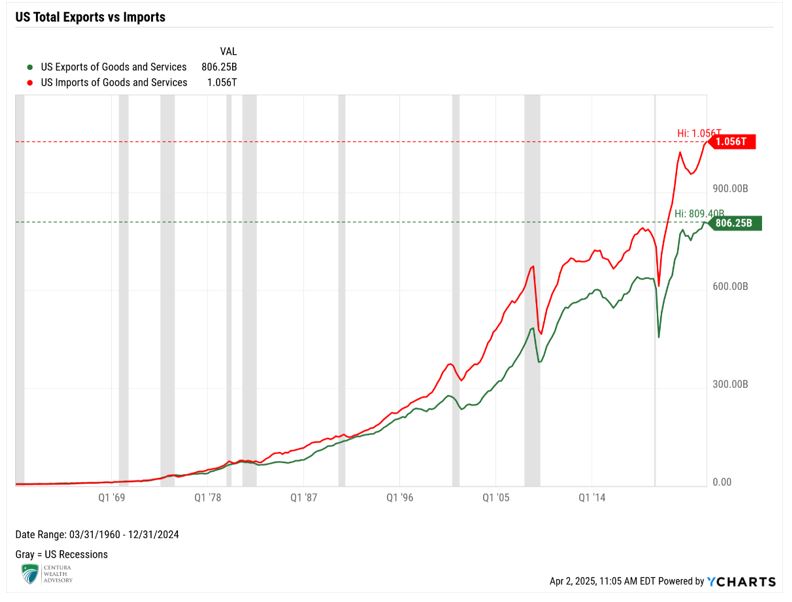
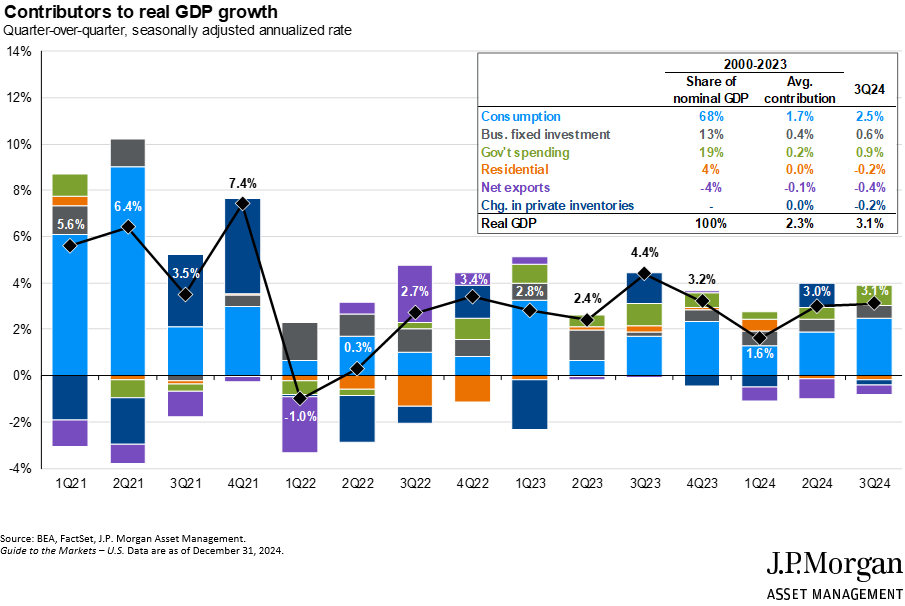
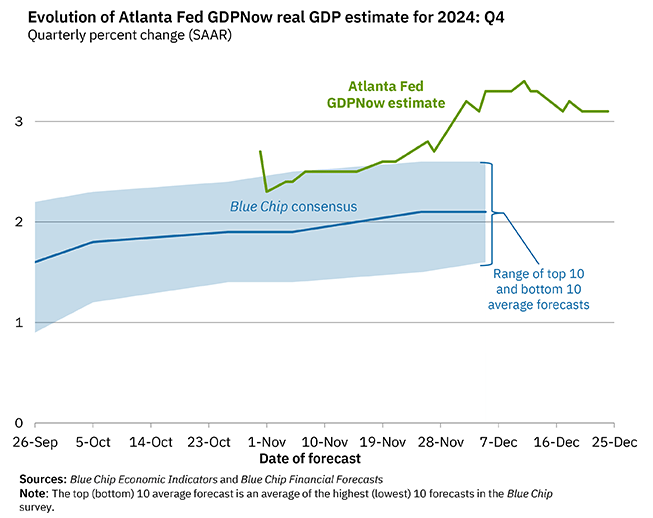
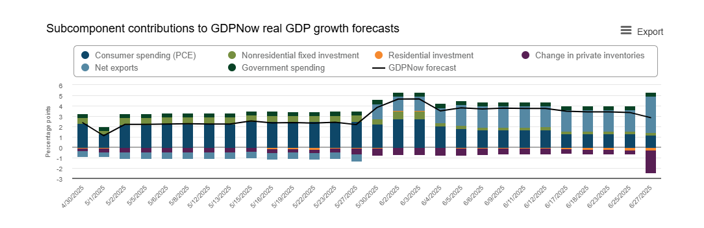
The US economy displayed clear signs of slowing during the second quarter, with multiple indicators pointing to diminishing momentum. The first quarter’s revised GDP contraction of 0.5% established a weak foundation, though the Atlanta Fed’s GDPNow model projected a significant rebound to 2.9% growth for Q2, largely driven by an anticipated surge in net exports.
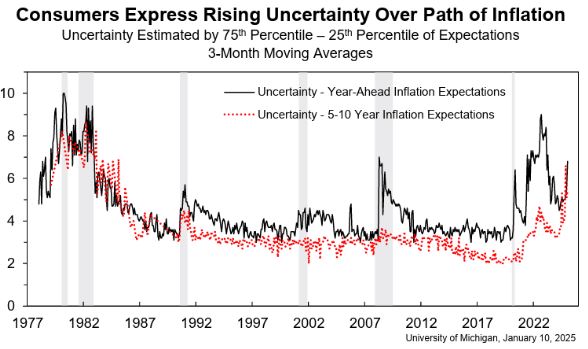
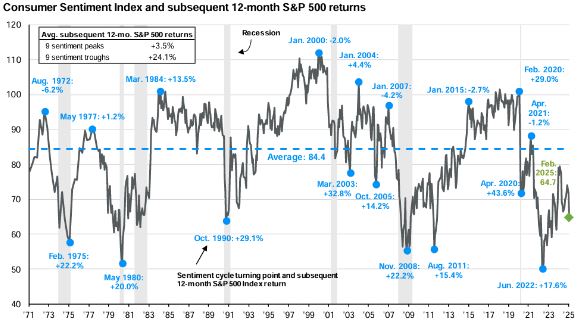
Consumer spending, the economy’s primary driver, showed concerning weakness. May’s 0.3% decline in real personal consumption expenditures marked the first monthly drop since early 2025, suggesting that tariff uncertainties were beginning to affect household behavior. Consumer sentiment remained subdued, with households expressing concerns about future economic prospects despite modest improvements in inflation expectations.
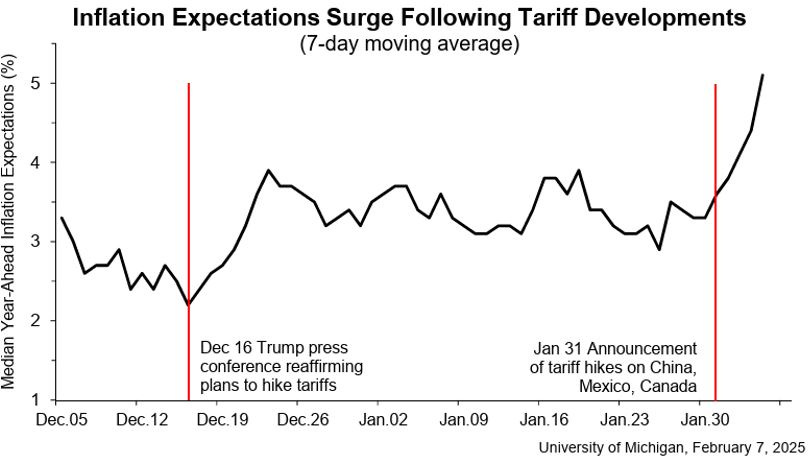
Inflation
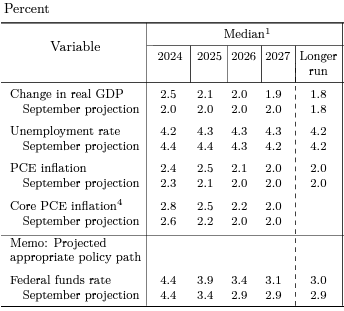
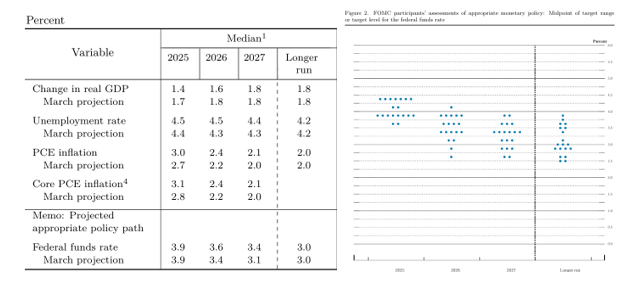
Inflation data presented a mixed picture, as inflation continued trending lower, though tariff impacts remained a key concern throughout the quarter. Despite widespread expectations of rising prices, the Consumer Price Index rose just 0.1% in May, bringing the year-over-year increase to 2.4%—slightly below expectations. Core PCE inflation, the Federal Reserve’s preferred gauge, remained elevated at 3.1% in the Fed’s June projections, up from 2.8% in March.
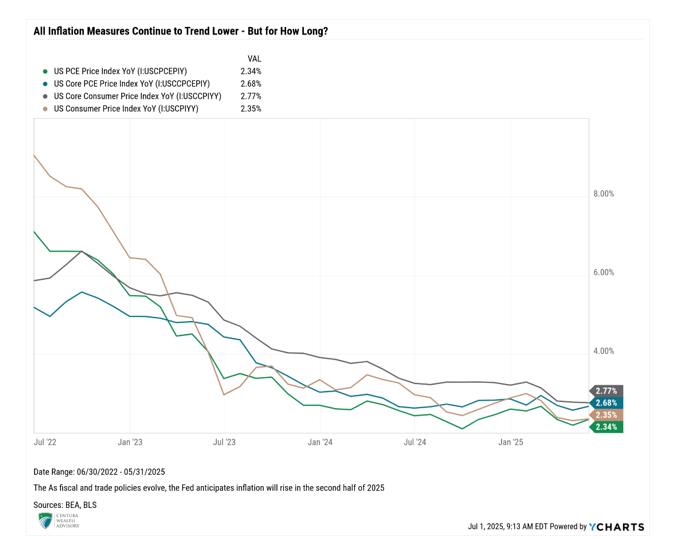
With Core PCE currently at 2.68%, this expected increase reflects growing concerns about tariff-induced price pressures, despite limited evidence of such effects in recent data. In summary, while inflation data throughout the quarter appeared muted, the underlying pressures from tariff policies suggests that consumer prices could face upward revisions in subsequent reports. Investors and policymakers remained vigilant, carefully weighing the emerging dynamics between inflation trends and economic growth prospects.
Unemployment
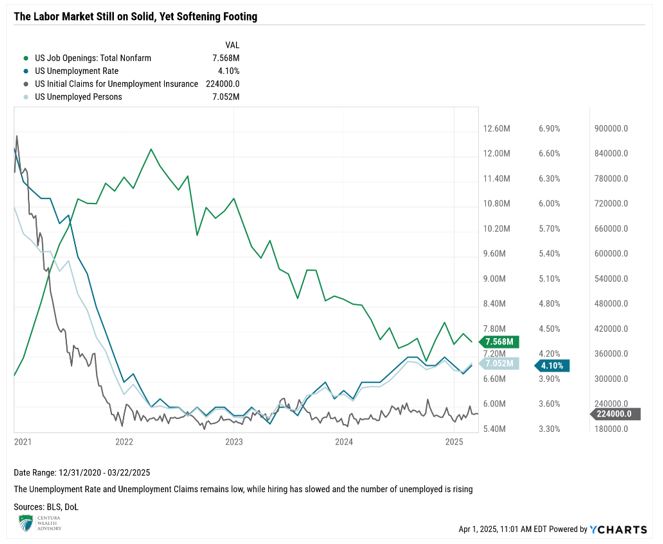
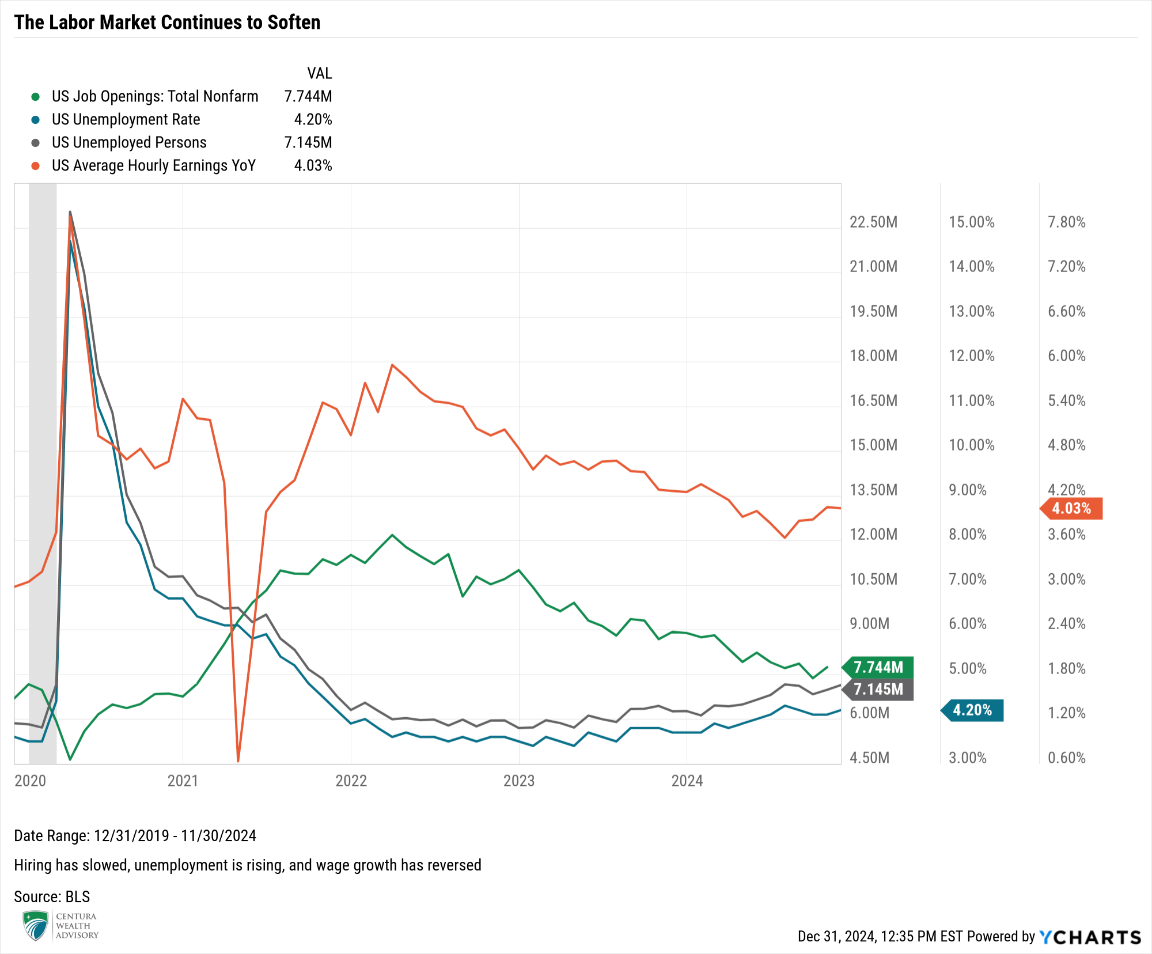
While still relatively robust, labor market conditions exhibited early signs of softening. May’s employment report showed nonfarm payrolls increasing by 139,000—above expectations but continuing a moderation trend. More worrisome is the number of people collecting unemployment benefits for extended periods approached a three-year high, potentially signaling emerging labor market weakness. The unemployment rate held steady at 4.2%, though Initial Unemployment Claims continue to trend higher, and the household survey indicated a substantial decline of 696,000 workers —highlighting divergences in employment data.
Crucially, worker pay increased more than anticipated, with average hourly earnings climbing 0.4% in May and rising 3.9% year-over-year. This wage growth outpaced inflation, suggesting that consumer spending power has the ability to remain intact for now. However, the persistence of elevated tariffs and their cascading effects on costs and demand may continue to test this strength in subsequent months.
The Fed
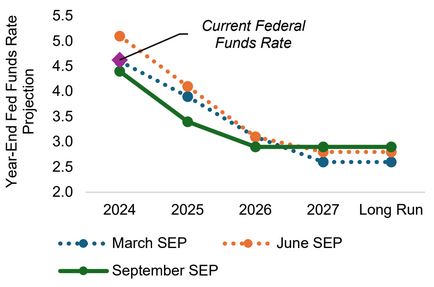
A careful balancing act marked the Federal Reserve’s role during the second quarter as it grappled with the dual challenges of managing inflation risks and supporting economic growth. As geopolitical tensions and trade uncertainties heightened market volatility, the Fed’s decisions became crucial in sustaining market confidence. At its June 18 meeting, the Fed decided to hold its benchmark interest rate steady in the range of 4.25% to 4.50%, reflecting a cautious approach amid tariff-induced inflation concerns and mixed signals from the labor market. The Federal Open Market Committee (FOMC) minutes revealed a split among policymakers regarding the future path of interest rates. This division underscored the complexity of the current economic environment where ten officials saw the need for at least two rate cuts by year-end, showcasing a dovish lean, while seven forecasted maintaining rates, a sign of more hawkish sentiment.
Source Link: Federal Reserve
Chair Powell emphasized the need for prudence, stating, “We haven’t been through a situation like this and think we have to be humble about our ability to forecast it,” highlighting that the economic landscape requires a cautious approach to forecasting amid unprecedented challenges. He pointed to the challenges in predicting the full economic impacts of recent tariffs and geopolitical developments. Powell’s comments highlighted the Fed’s commitment to data dependence, with the Chair noting that future policy decisions would rely heavily on the unfolding economic indicators of inflation and labor market health. The Fed’s forward guidance, marked by projections that showed a rise in expected inflation, slower growth, and higher unemployment, reiterated the delicate position the central bank occupied in steering monetary policy amid significant uncertainties. As the summer progresses, the Fed’s actions, particularly concerning potential rate cuts, are expected to remain front and center as markets navigate the continued complexities of the global economic environment.
Centura’s Outlook
As we look toward the second half of 2025, several critical factors will likely shape market direction. The July 9 deadline for trade negotiations represents a pivotal moment, as the Administration’s decisions regarding tariff implementation could significantly impact economic trajectories. European Union officials have indicated a willingness to accept a 10% universal tariff on many exports, though they continue to seek key exemptions, illustrating the ongoing nature of these complex negotiations.
The Federal Reserve’s monetary policy decisions remain another crucial variable. Market participants increasingly anticipate rate cuts in the latter half of the year, with September emerging as the most likely timing for the first reduction. However, the Fed’s ability to ease monetary conditions will depend significantly on inflation developments, particularly the extent to which tariffs drive up consumer prices. Chair Powell has indicated that inflation effects from tariffs should become more visible during the summer months as inventory stockpiled before tariff implementation is depleted.
Economic growth prospects remain uncertain, with projections for 2025 GDP growth declining to 1.4% in the Fed’s June projections, down from 1.7% in March. This reflects growing concerns about the combined impact of trade tensions, fiscal tightening, and persistent inflation. The labor market’s resilience will be crucial in determining whether the economy achieves a “soft landing” or experiences a more pronounced downturn. While we still believe we are likely headed for an economic downshift, rather than a recession, we anticipate economic data will continue to be marred with noise over the next several months, further clouding forward-looking projections and likely resulting in market volatility.
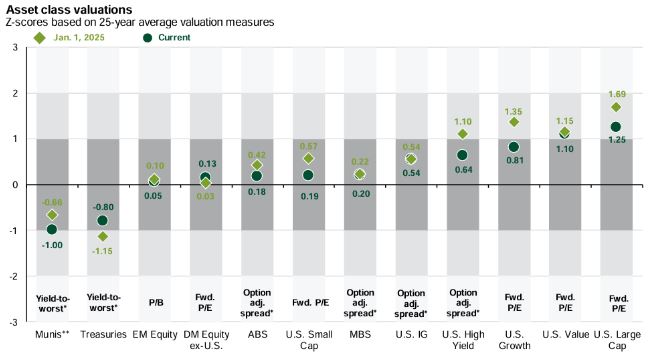
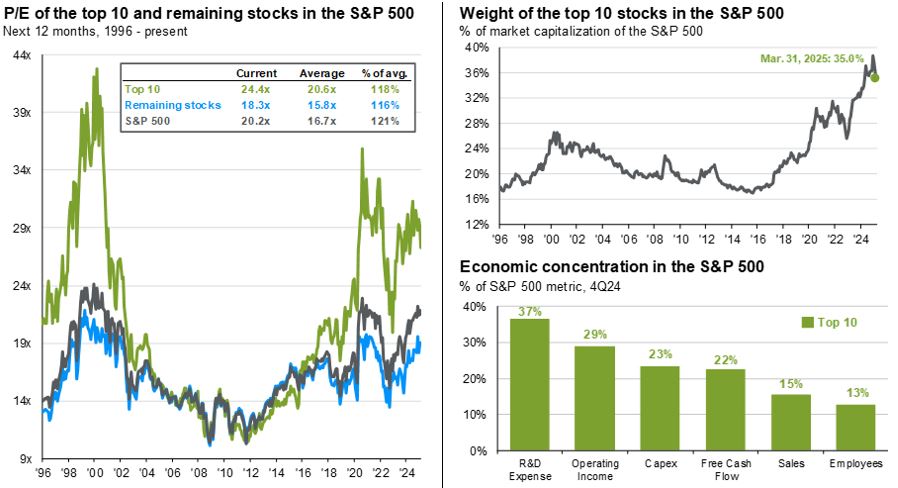
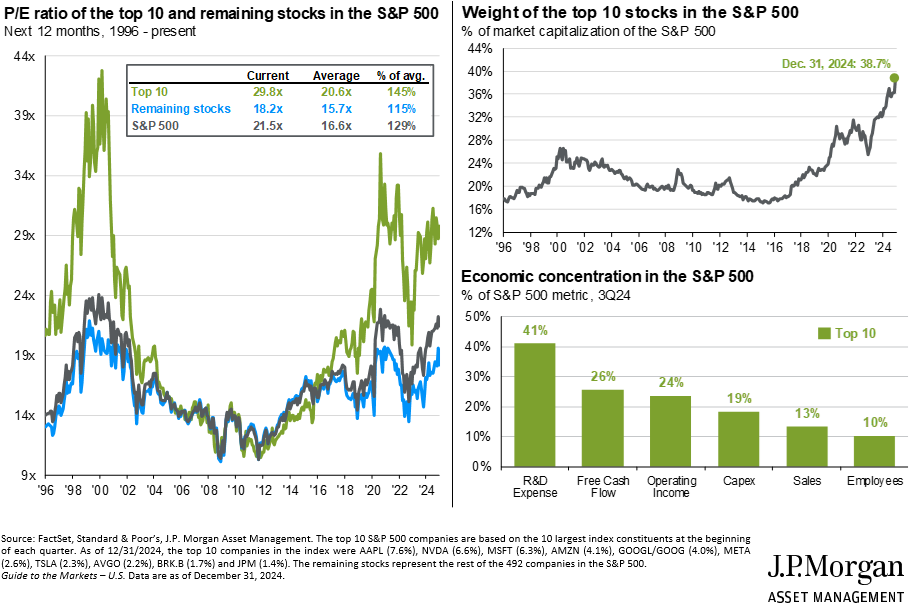
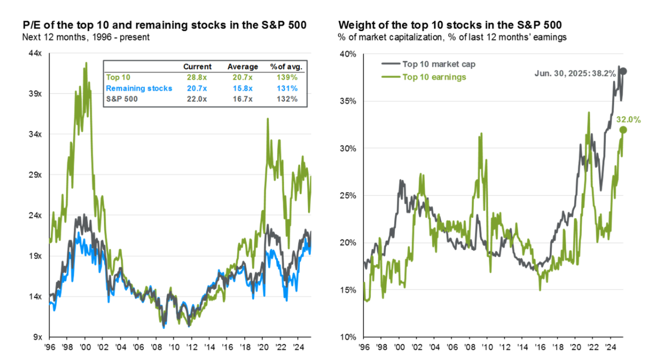
Valuations have returned to stretched levels; according to FactSet, the forward 12-month price-to-earnings ratio (P/E) increased from 20.5x at first quarter-end to 21.9x as of June 27, which is further elevated above both the 5-year and 10-year averages of 19.9x and 18.4x, respectively. As we witnessed in the first quarter, valuations continue to pose a risk to the market, as negative sentiment can lead to sharper sell-offs on overvalued securities. However, most of the rich valuations are concentrated in the 10 largest stocks, which now make up more than 38% of S&P 500 index. When removing those 10 securities from the index, the valuations for the remaining 490 companies are trading at 20.7x, much more reasonable multiples. While the concentration of the top 10 largest stocks in the S&P 500 fell in Q1 2025, they rebounded sharply in Q2. As illustrated on the chart on the right below, those 10 largest companies also produce almost a third of the earnings in the index, suggesting that there are fundamental reasons for the concentration in market cap. Stretched valuations paired with significant concentrations still pose a significant risk, especially during periods of heightened volatility and uncertainty.
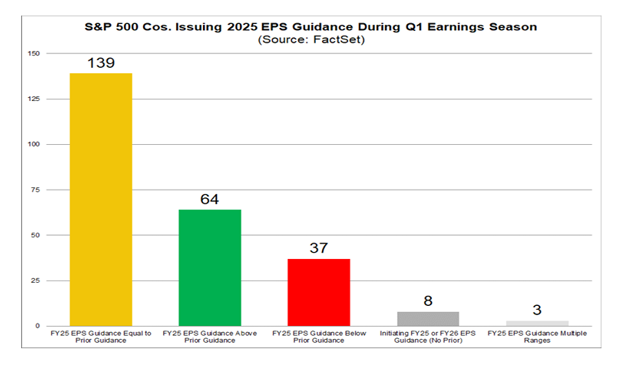
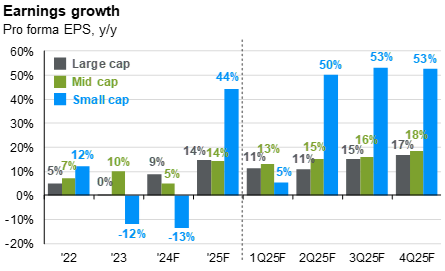
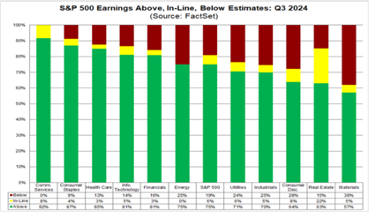
Corporate earnings turned in a strong start to the year, growing almost 14% year-over-year in the first quarter, nearly double the 7% expectations. However, companies will face significant tests in the upcoming reporting season as they navigate the complex landscape of higher import costs, supply chain adjustments, and potentially weakening consumer demand. Goldman Sachs strategists have warned that profit margins may face compression if companies cannot pass along higher costs to consumers. FactSet projects a 2Q earnings slowdown to 5% year-over-year, as companies grapple with the changing landscape.
Geopolitical developments, particularly in the Middle East, in addition to US-China relations, maintain the potential to introduce additional volatility. While immediate tensions appear to have eased, underlying conflicts remain unresolved and could rapidly reignite with little ability to predict the timing of such conflicts.
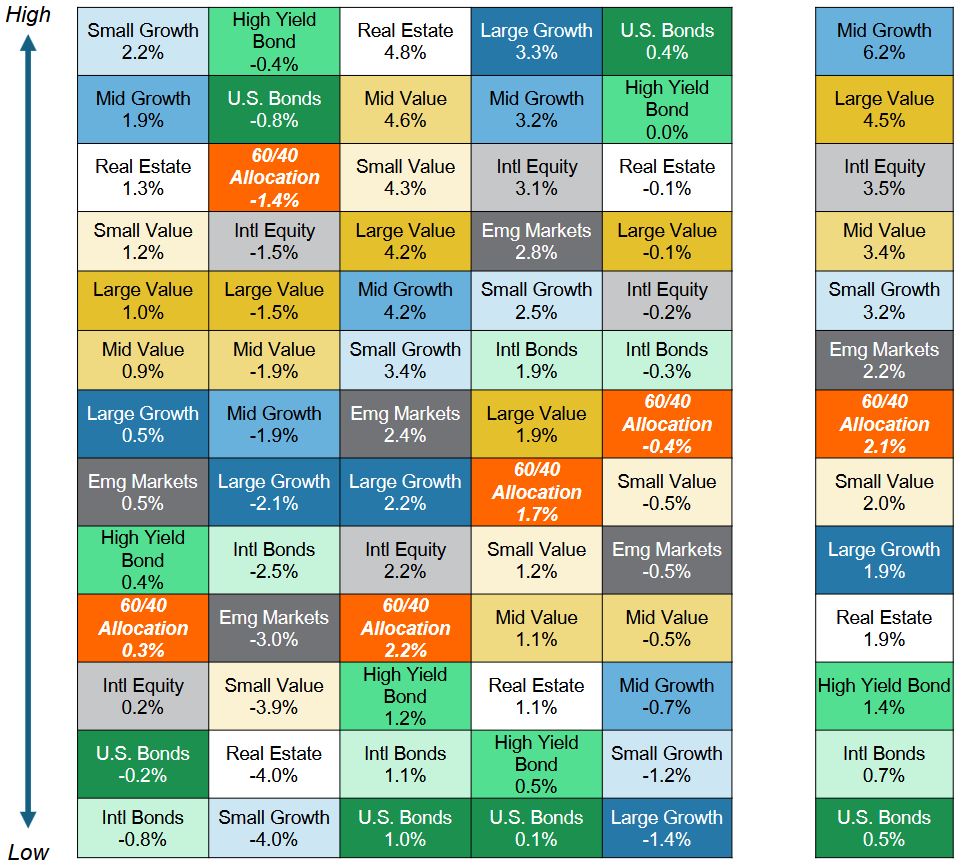
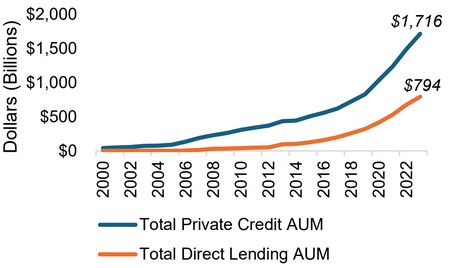
Still staring at the face of uncertainty across many factors, our allocations remain balanced and in line with our long-term targets. We continue to expect volatility in the short-term as markets work through the political noise and reassess potential economic ramifications; however, in the longer-term, we expect earnings growth to rebound from their paltry 2Q projection to drive equity markets. Diversification across several public and private market asset classes should serve clients well in 2025 as we navigate this complex investing environment.
We remain committed to helping you navigate these challenging market conditions. Our team continues to monitor developments closely and stands ready to provide guidance tailored to your specific financial objectives. We encourage you to schedule a review of your portfolio positioning in light of the evolving economic landscape. As always, we appreciate your continued trust and welcome any questions you may have regarding this quarter’s developments or your overall financial strategy.
Thank you for your continued confidence and support. If you have questions or concerns, please contact your Centura Wealth advisor.
The information provided is for educational and informational purposes only and does not constitute investment advice and it should not be relied on as such. It should not be considered a solicitation to buy or an offer to sell a security. It does not take into account any investor’s particular investment objectives, strategies, tax status or investment horizon. You should consult your attorney or tax advisor.
The views expressed in this commentary are subject to change based on the market and other conditions. These documents may contain certain statements that may be deemed forward-looking statements. Please note that any such statements are not guarantees of any future performance and actual results or developments may differ materially from those projected. Any projections, market outlooks, or estimates are based upon certain assumptions and should not be construed as indicative of actual events that will occur. All information has been obtained from sources believed to be reliable, but its accuracy is not guaranteed. There is no representation or warranty as to the current accuracy, reliability, or completeness of, nor liability for, decisions based on such information and it should not be relied on as such.
Centura Wealth Advisory is a registered investment advisor. Advisory services are only offered to clients or prospective clients where Centura Wealth Advisory and its representatives are properly licensed or exempt from licensure. 12255 El Camino Real, St. 125, San Diego, CA 92130.