In the current risky environment –with inflation and interest rates on the rise– we are often asked by clients, “How do we manage risk? How will these changes impact our portfolios? Why are these changes happening?”
At Centura, we use alternative investments and believe in taking an institutional approach to our asset allocation. In this challenging market, we guide our clients towards alternative investments such as private real estate, private equity and private credit.
Before we discuss why investors are using these alternative investments as a hedge against inflation, let’s take a quick look at why the market is changing and how these changes will impact investors.
What Has Changed in the Market Over the Last Twelve Months and Why?
The short answer: inflation. Let’s review how inflation got to where it is today and how we can navigate this challenging market moving forward.
From 2009-2021: Inflation and Interest Rates were Low
In the past, for instance from 2009 to 2021, investing seemed simple; the Federal Reserve was continually lowering interest rates or adding liquidity into the economy whenever the market became problematic. Inflation remained low. During this period, investors would invest “by the dip,” or, in other words, invest while the market dipped before the Fed would take action to rectify the situation.
Quantitative Easing in 2020
In 2020, the Fed began quantitative easing (QE) to encourage investment and spur economic activity. In this process, the Fed expanded its balance sheet.
In June 2022, however, roughly two years after the quantitative easing plan was announced, the Federal Reserve began quantitative tightening (QT).
The Federal Reserve, Quantitative Tightening and Inflation
The quantitative tightening process includes allowing the Fed allowing purchased bonds to reach maturity and run off its balance sheet, which results in rising interest rates and has the effect of withdrawing liquidity from the economy.
Inflation remains prevalent in the American economy. In fact, in Q2 2022, inflation – now in the 8-9% range –sat at its highest point since 1982.
What Does This Mean For Investors?
It may be time to become actively involved in the management of your portfolio.
How to Seek Greater Returns and Reduce Risk in a Challenging Market
In constructing an optimized portfolio, there are many elements to consider. The goal of an optimized portfolio is to maximize the return while minimizing risk.
How do we accomplish an optimized portfolio at Centura? We utilize alternative investments and an institutional approach to our asset allocation.
For instance, this means we could have a client with an allocation to alternatives at 30-40%.
In this inflationary market, we guide our clients to alternative investments in private real estate, private equity and private credit.
Private Real Estate
Private real estate can serve as a hedge against inflation and be an attractive option for investors for several reasons, including that private real estate maintains intrinsic value and recovers quickly in a challenging market.
Private real estate has produced solid results for decades and while nothing is recession-proof, many investors consider real estate “recession-resistant.”
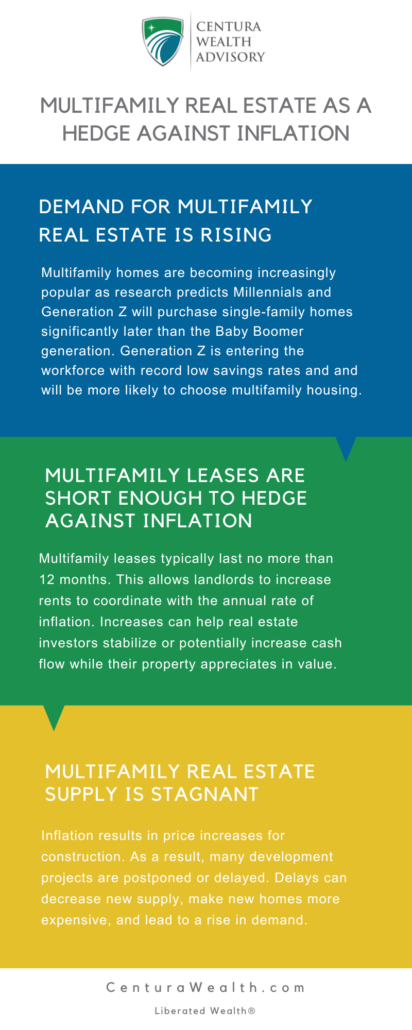
Multi-family real estate remains a strong option for investors looking for a hedge against inflation. Why? Demand for multi-family real estate continues to increase while supply remains stagnant.
Learn more about how investors are using multi-family real estate as a hedge against inflation.
Private Equity
Private equity investments are deemed “private” because they involve buying shares or an ownership stake in private companies or funds, rather than ones traded publicly on the stock market.
Private equity provides companies with easy access to capital as an alternative to traditional financing options, such as bank loans. For investors, private equity serves as a vast range of opportunities in which to find value and invest.
Private Credit
Private credit can provide several advantages and opportunities in a market with inflation and rising interest rates.
Floating Rate Loans
In a rising rate environment, floating rate loans are a highly attractive opportunity for investors. Why? Income increases alongside rising interest rates.
Private credit is typically a floating rate. This may help to limit both the rate risk and the duration risk that are associated with traditional fixed income.
Privately Negotiated Deals
Private credit transactions are direct negotiations between the lender and the borrower. This allows investors to access a wide range of private transactions and negotiate terms that best work for them.
For example, private credit investors tend to negotiate for better protections to make credits more defensive, such as a senior secured structure, call protection, or covenant terms.
As the Economy Recovers, Credit Quality Improves
Credit quality typically improves with economic recoveries. While investors should seek the assistance of professional private credit managers to prioritize downside protection, extensive due diligence, and quality of credit.
Structured Notes
Structured notes, written by high credited banks, are customizable and well-suited for a rising interest rate environment and can help investors maintain returns. For more detail, listen in to Episode 35 of Live Life Liberated, “Structured Notes Simplified with Robert Sowinski.”
Tune into the Live Life Liberated Podcast to Learn More
In Episode 61 of the Live Life Liberated Podcast, Roby Kotcamp, Senior Wealth Advisor, and Chris Osmond, Chief Investment Officer, discuss Centura Wealth Advisory’s approach to risk management. They also explore strategies to achieve greater risk-adjusted returns.
Roby and Chris discuss:
- A brief overview of the Fed’s recent actions — and their market implications
- Why cash flow is more important than the rate of return
- How private real estate, private equity, and private credit can be a useful addition to your portfolio
- The benefits of structured notes in risk management
- And more
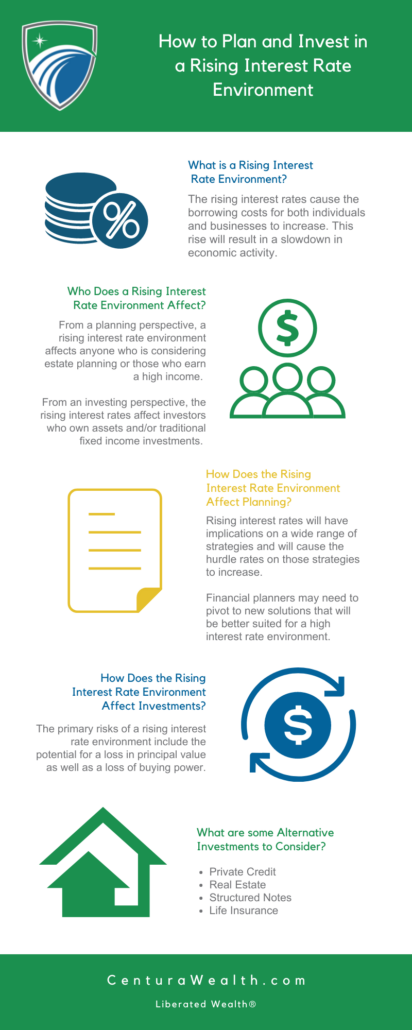
Interested in Learning More About How to Invest in Rising Interest Rate Environments?
At Centura, we are dedicated to our role as stewards in leading our clients to purposeful financial planning and investing strategies to ensure their success. One of our goals is to help our clients navigate and understand challenging economic changes, such as the current rising interest rate environment.
Read our article for more information here.
Disclosures
Centura Wealth does not make any representations as to the accuracy, timeliness, suitability or completeness of any information prepared by any unaffiliated third party, whether linked to or incorporated herein. All such information is provided solely for convenience purposes and all users thereof should be guided accordingly.
We are neither your attorneys nor your accountants and no portion of this material should be interpreted by you as legal, accounting, or tax advice. We recommend that you seek the advice of a qualified attorney and accountant.
For additional information about Centura, please request our disclosure brochure as set forth on Form ADV using the contact information set forth herein, or refer to the Investment Adviser Public Disclosure website (www.adviserinfo.sec.gov). Please read the disclosure statement carefully before you engage our firm for advisory services.